3rd WaveHello All,
In Elliott Wave Theory, 3rd wave is not the shortest one in the waves 1/3/5 and it's usually longest one. so if we can catch it then we may get good opportunities to trade. This script finds 3rd wave experimentally. it can be also the 3rd waves in the waves 1, 3, 5, A and C. the 3rd wave should have greater volume than other waves, the script can check its volume and compare with the volumes of the waves 1 and 2 optionally.
Pine Team released Pine version 5! This script was developed in v5 and it uses Library feature of Pine v5 for the zigzag functions. This script is also an example for the Pine developers who learn Pine v5 and Libraries.
Options:
Zigzag Period: is the length that is used to calculate highest/lowest and the zigzag waves
Min/Max Retracements: is the retracement rates to check the wave 2 according to wave 1. for example; if min/max values are 0.500-0.618 then wave 2 must be minimum 0.500 of wave 1 and maximum 0.618 of wave 1.
Check Volume Support: is an option to compare the volumes of1. 2. and . waves. if you enable this option then the script checks their volume and 3rd wave volume must be greater then 1 and 2
there are 4 options for the targets. you can enable/disable and change their levels. targets are calculated using length of wave 1.
Options to show breakout zone, zigzag, wave 1 and 2.
and some options for the colors.
The Library that is used in this script:
P.S. This is an experimental work and can be improved. So do not hesitate to drop your comments under the script ;)
Enjoy!
Lonesometheblue

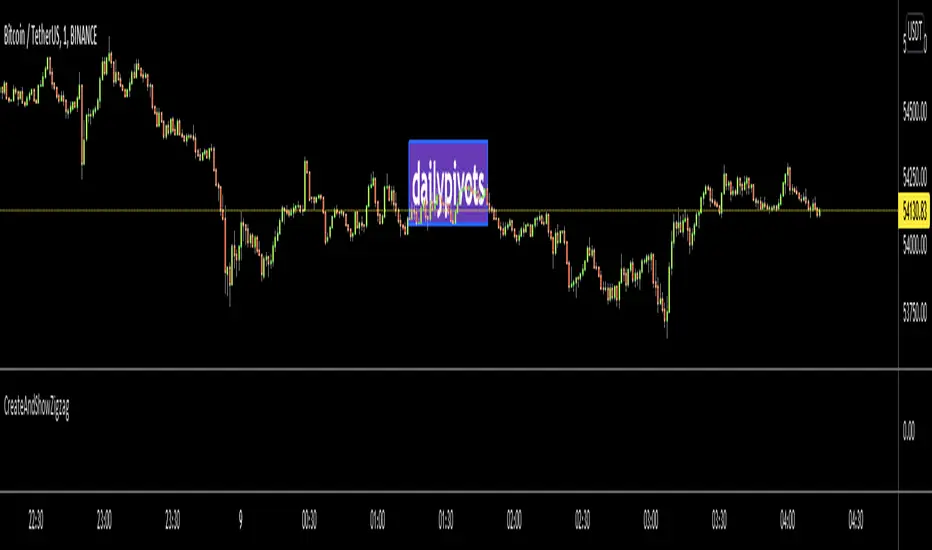
CreateAndShowZigzagLibrary "CreateAndShowZigzag"
Functions in this library creates/updates zigzag array and shows the zigzag
getZigzag(zigzag, prd, max_array_size) calculates zigzag using period
Parameters:
zigzag : is the float array for the zigzag (should be defined like "var zigzag = array.new_float(0)"). each zigzag points contains 2 element: 1. price level of the zz point 2. bar_index of the zz point
prd : is the length to calculate zigzag waves by highest(prd)/lowest(prd)
max_array_size : is the maximum number of elements in zigzag, keep in mind each zigzag point contains 2 elements, so for example if it's 10 then zigzag has 10/2 => 5 zigzag points
Returns: dir that is the current direction of the zigzag
showZigzag(zigzag, oldzigzag, dir, upcol, dncol) this function shows zigzag
Parameters:
zigzag : is the float array for the zigzag (should be defined like "var zigzag = array.new_float(0)"). each zigzag points contains 2 element: 1. price level of the zz point 2. bar_index of the zz point
oldzigzag : is the float array for the zigzag, you get copy the zigzag array to oldzigzag by "oldzigzag = array.copy(zigzay)" before calling get_zigzag() function
dir : is the direction of the zigzag wave
upcol : is the color of the line if zigzag direction is up
dncol : is the color of the line if zigzag direction is down
Returns: null
ZigZag Chart with SupertrendHello All,
This script creates Zigzag Chart by using Zigzag waves, so it's timeless chart meaning that no time dependency on X-axis. Optionally it can calculate & show Zigzag Supertrend or Simple Moving Average. Also it can change bar colors of the main chart by trend direction of Zigzag Supertrend.
As seen below, each zigzag wave is a candle on Zigzag chart:
You have a few options and using these options you can find best settings for the securities/timeframes.
You can change Zigzag period, if you change Zigzag Period then all zigzag and the chart is recalculated/reconstructed.
You have option to show Zigzag Supertrend or Zigzag Moving Average, the options you have;
- You can change ATR Length and ATR multiplier for supertrend
- You can change Length for Simple Moving Average
You can change Zigzag candle & wick colors using options. Also you have option to change bar colors according to Zigzag Supertrend direction.
As it's timeless chart, below you can see how/when bar colors and Zigzag Supertrend change:
You can see Simple Moving Average of the Zigzag Candles:
You can play with ATR length and multiplier to find best supertrend:
You can play with the candle & wick colors:
Enjoy!

Trading ABCHello Traders,
For a few months I have been getting requests from my followers about ABC pattern and finally I decided to make this indicator.
How it works?
- It creates Trend Cloud using Simple and Exponential moving averages with the lenghts 50, 100, 150, 200, 20, 40 by default and checks the trend. you can change the lengths as you wish
- It also creates ZigZag using the ZigZag Period in the options.
- Using last 2 zigzag waves it checks if there is suitable ABC pattern according the Trend, the Min/Max Fibonacci levels and Error Rate
- Then it check if the price bounces after this ABC pattern
- And if all these conditions met then it plot triangle
- If there are multiple bouncing then you can see multiple triangles
You can change/set;
- Zigzag Period
- Fibonacci Max level
- Fibonacci Min Level
- Error Rate
- The Lengths that are used for Moving Averages
- Keeping old ABC lines/labels
- Show Zigzag and min/max Fibonacci levels
- Show Trend Cloud
- and colors
if you don't want to see old ABC lines/labels you can disable it:
if you don't want to see Trend Cloud you can disable it:
Zigzag and Fibonacci levels:
P.S. if you have new ideas to improve this indicator then let me know please. We together can do this life easier!
Enjoy!

Volume Profile / Fixed RangeHello All,
This script calculates and shows Volume Profile for the fixed range . Recently we have box.new() feature in Pine Language and it's used in this script as an example. Thanks to Pine Team and Tradingview!..
Sell/Buy volumes are calculated approximately!.
Options:
"Number of Bars" : Number of the bars that volume profile will be calculated/shown
"Row Size" : Number of the Rows
"Value Area Volume % " : the percent for Value Area
and there are other options for coloring and POC line style
Enjoy!

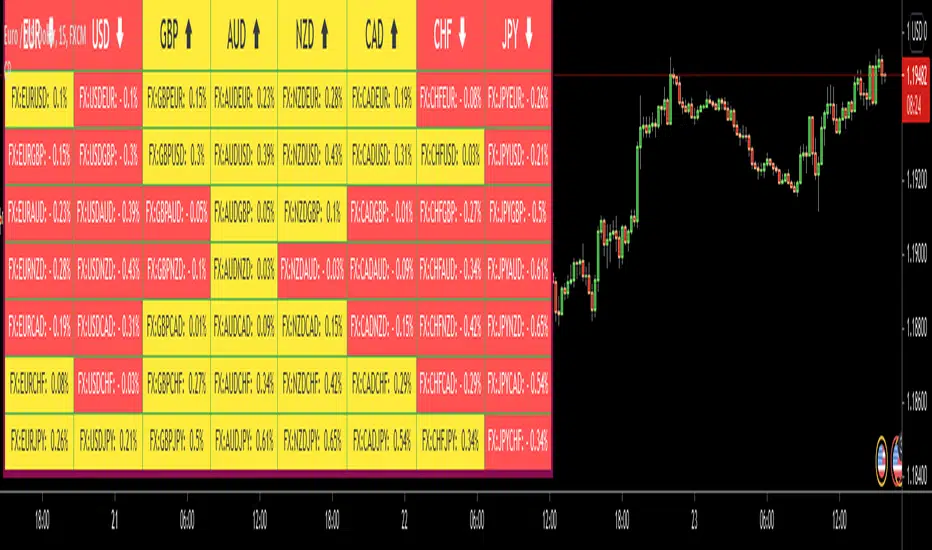
Currency PairsHello All,
This script shows comparisons between major currencies for the specified time frame. it checks the change since the last bar and set the background and text color.
You can change time frame and background & text colors. you can also change the location of the table as you wish.
in the following example, the script was added to the chart two times, "4 hours" and "Day" time frames used. also changed the colors.
Enjoy!
Cup FinderHello All,
This script finds the Cups and you can use it while analysing the symbols. it creates circle and channel for the potential Cups and checks the number of bars included by the channel, if included bars is equal or greater than the value you set then it shows the cup.
The Options:
"Number for Bars to search" : Maximum length of a Cup
"Channel Width of the Cup" : Tate by the channel width of highest/lowest levels in last 300 bars, by default it's 5%
"Check for Breakout" : if there is Cup then it checks Close or High/Low is used a source for breaokuts, usuful while cheking historical bars
"Contained Bar Rate %" : after channel is created the script checks number of bars included by the channel of the Cup, you can set rate of included bars by this option
"S how Channels of Cups ": if you enable this option then you can see the channels around the Cups and set it as you wish
and there are some other options for labeling/removing old Cups and for coloring
Here you can see how channel looks like:
Cup with different colors:
P.S. This is an experimental work and sorry for no explanation in the script.
in the future if I have time I will try to write a script for Cup&Handle
This script is also an example to calculate and draw circles :)
Enjoy!

Breakout FinderHelo All,
I got many requests for a Breakout script and here it's. This script searches the breakouts/breakdowns and draw square if there is one.
The options:
"Period" is used to find Pivot Points
"Max Breakout Length" is the maximum length to search breakouts
"Threshold Rate %" is channel width of the breakout area. calculated using highest/lowest of last 300 bars.
"Minimum Number of Tests" is the minimum number of tests that the Price tried to break the S/R level
and some options for coloring and linestyle
Lets see some examples:
in this example "Minimum Number of Tests" is 2 so the Price must have tested to break resistance area 2 times and then it breaks it as seen in the screenshot:
in following example Threshold rate is %10, so the channel width is very big:
as you can see in followinf screenshot you can choose different colors and line styles:
Alerts added ;)
Enjoy!

Indicator PanelHello All,
This script shows Indicator panel in a Table. Table.new() is a new feature and released today! Thanks a lot to Pine Team to add this new great feature! This new feature is a game changer!
The script shows indicator values for each symbol and changes background color of each cell by using current and last values of the indicators for each symbol. if current value is greater than last value then backgroung color is green, if lower than last value then red, if they are equals then gray.
You can choose the indicators to display. Number of columns in the table is dynamic and is changed by number of the indicators.
You can choose 5 different Symbols, 6 Indicators and 2 Simple or Exponential Moving averages, you can set type of moving averages and the lengths. You can also set the lengths for each Indicators.
Indicators:
- RSI
- MACD ( MACD and Signal and Histogram )
- DMI ( +DI and -DI + and ADX )
- CCI
- MFI
- Momentum
- MA with Length 50 (length can be set)
- MA with Length 200 (length can be set)
In this example RSI, MACD and MA 200 were chosen, you can see how table size changes dynamically:
Enjoy!

LTB Zigzag CirclesHello All,
Today I am here with a new idea and script, " LTB Zigzag Circles ". The idea is to create Circles using last 2 zigzag waves and to catch the breakouts earlier than horizontal lines. if a circle is broken then the script shows entry for Long/Short positions. and if broken circle reappears again then the position is closed. You can change Zigzag period as you wish and see the different results.
Here you can see how the script calculates and draws the Circles:
Below you can see how the script draws part of the circle on each bar:
Optionally the script can show levels:
P.S. I haven't tested it as a strategy, Result and Performance may change by Zigzag period, you need to find best Zigzag period according to your strategy. By the way, my Zigzag Circles idea can be improved, if you have any recommendation let me know please ;)
Enjoy!

Tick Data DetailedHello All,
After Tick Chart and Tick Chart RSI scripts, this is Tick Data Detailed script. Like other tick scrips this one only works on real-time bars too. it creates two tables: the table at the right shows the detailed data for Current Bar and the table at the left shows the detailed data for all calculated bars (cumulative). the script checks the volume on each tick and add the tick and volume to the specified level (you can set/change levels)
The volume is multiplied by close price to calculate real volume .There are 7 levels/zones and the default levels are:
0 - 10.000
10.000 - 20.000
20.000 - 50.000
50.000 - 100.000
100.000 - 200.000
200.000 - 400.000
> 400.000
With this info, you will get number of ticks and total volumes on each levels. The idea to separate this levels is in order to know which type of traders trade at that moment. for example volume of whale moves are probably greater than 400.000 or at least 100.000. Or volume of small traders is less than 10.000 or between 20.000-50.000.
You will get info if there is anomaly on each candle as well. what is anomaly definition? Current candle is green but Sell volume is greater than Buy volume or current candle is red but Buy volume is greater than Sell volume . it is shown as (!). you should think/search why/how this anomaly occurs. You can see screenshot about it below.
also "TOTAL" text color changes automatically. if Buy volume is greater than Sell volume then its color becomes Green, if Sell volume is greater than Buy volume then its color becomes Red (or any color you set)
Optionally you can change background and text colors as shown in the example below.
Explanation:
How anomaly is shown:
You can enable coloring background and set the colors as you wish:
And Thanks to @Duyck for letting me use the special characters from his great script.
Enjoy!

Support Resistance ChannelsHello All,
For Long time I was planning to make Support/Resistance Channels script, finally I had time and here it is.
How this script works?
- it finds and keeps Pivot Points
- when it found a new Pivot Point it clears older S/R channels then;
- for each pivot point it searches all pivot points in its own channel with dynamic width
- while creating the S/R channel it calculates its strength
- then sorts all S/R channels by strength
- it shows the strongest S/R channels, before doing this it checks old location in the list and adjust them for better visibility
- if any S/R channel was broken on last move then it gives alert and put shape below/above the candle
- The colors of the S/R channels are adjusted automatically
You can set/change following settings:
- Pivot Period
- Source : High/Low or Close/Open can be used
- Maximum Channel Width %: this is the maximum channel width rate, this is calculated using Highest/Lowest levels in last 300 bars
- Number of S/R to show : this is the number of Strongest S/R to show
- Loopback Period: While calculating S/R levels it checks Pivot Points in LoopBack Period
- Show S/R on last # Bars: To see S/R levels only on last N bars
- Start Date: the script starts calculating Pivot Point from this date, the reason I put this option is for visuality. Explained below
- You can set colors/transparency
- and You can enable/disable shapes for broken S/R levels
Examples:
You can change colors as you wish:
here " Show S/R on last # Bars " set 100:
Sometimes visuality may corrupt because of old S/R levels, to solve it you need to set "Start Date" in the options to start the script in visual part (last 292 bars)
here in first screenshot it doesn't look good (shrink), then on second screenshot I set the "Start Date" it looks better, if you change time frame don't forget to set it again :)
Enjoy!

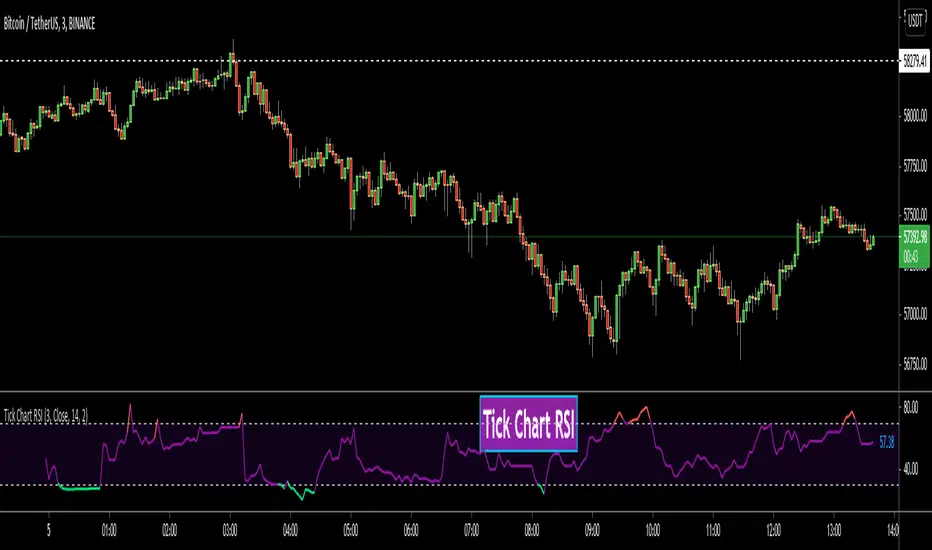
Tick Chart RSIHello All,
This is Tick Chart RSI script and it calculates & shows RSI for Tick Chart. What is Tick chart? Tick Chart is created using ticks and each candlestick in Tick Chart shows the price variation of X consecutive ticks (X : Number of Ticks Per Candle). For example if you set "Number of Ticks Per Candle" = 100 then each candlestick is created using 100 ticks. so, Tick Charts are NOT time-based charts (like Renko or Point & Figure Charts). Tick is the price change in minimum time interval defined in the platform. There are several advantages of Tick Charts. You can find many articles about Tick Charts on the net.
Tick Chart and Tick Chart RSI only work on realtime bars.
You can set " Number of Ticks Per Candle " and the colors. You can also set any of the candles OHLC values as source for RSI.
While using Tick Chart RSI I recommend you to add Tick Chart as well.
P.S. Tick Chart RSI script can be developed using different methods. in this script, all RSI values are calculated on each tick because RSI is calculated for only real-time bars, and also calculated for limited number of bars
Tick Chart and Tick Chart RSI:
Tick Chart RSI:
Enjoy!
Tick ChartHello All,
Tick Chart is created using ticks and each candlestick in Tick Chart shows the price variation of X consecutive ticks ( X : Number of Ticks Per Candle ). for example if you set Number of Ticks Per Candle = 100 then each candlestick is created using 100 ticks. so, Tick Charts are NOT time-based charts (like Renko or Point & Figure Charts). Tick is the price change in minimum time interval defined in the platform. There are several advantages of Tick Charts. You can find many articles about Tick Charts on the net.
Tick Chart only works on realtime bars.
You can set " Number of Ticks Per Candle " and " Number of Candles" using options. You can change color of body, wicks abd volume bars as well.
The script shows current, minimum, maximum and average volumes. it also shows OHLC values on the last candle.
Tick Chart using different number of ticks
Volume info:
Enjoy!

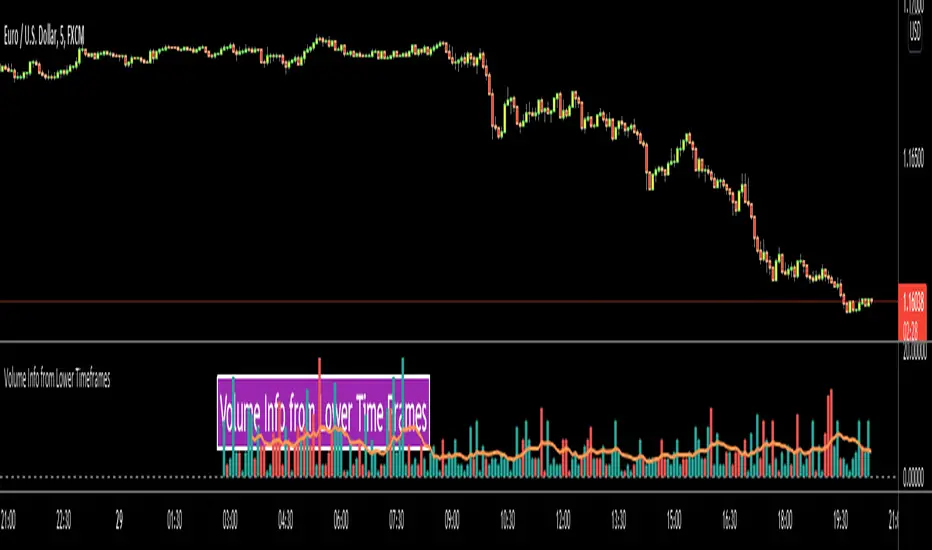
Volume Info from Lower Time FramesHello Traders,
We are now able to get info from lower time frames, Many Thanks to Pine Team .This script gets volume info from lower time frames and give alert if there is extreme volumes on last X lower time frame candles (if last X volumes are higher than volume moving average). so that if you set alerts on different securities then you will be able get alert if there is extreme volume moves and you can check the chart immediately.
The options:
Timeframe in Seconds : you can set lower time frames in seconds. by default it's 5 seconds. if you set it 60 then it will show 1min volumes, if you set it 1 then it will show 1 seconds volumes
MA Length : The script draws simple moving average using this length info. by default it's 20.
Number of Bars to Check for Alert : by default it's 5. meaning that if last 5 candles is greater than moving average and if you set alert then you get the alert "Extreme Volume"
Other options are for colors and line width.
As you can see in following example, chart time frame is 1 hour and the script shows volume info of 5 seconds candles:
Enjoy!
Monte Carlo Simulation - Random WalkHello All,
Monte Carlo Simulation is a model used to predict the probability of different outcomes when the intervention of random variables is present. it is used by professionals in such widely disparate fields as finance, project management etc. You can find many articles about Monte Carlo Simulation on the net.
In this script I tried to make Monte Carlo Simulation and "Random Walk". it calculates results over and over, each time using a different set of random values that is created using historical data (500 times by default) and show min-max and some random paths. number of "random walks" is calculated by using number of bars to predict, so if you change "Number of Bars to Predict" then number of random walks may change. Total number of the lines must be less than 500.
"Number of Simulations " is 500 by default, more simulation better results. but if you increase it a lot then you may get "loop takes too long error"
"Number of Bars to Predict" can be between 10-100
"Number of Bars to use as Data Source" is the number of historical bars to use in simulations
Thanks to Ricardo Santos (@RicardoSantos) for letting me use his Random Number Generator Function.
P.S. I am not mathematician and I tried to make it as far as I understood the method. so if you see any issue let me know please.
Some examples:
Number of Bars to Predict = 100:
Number of Bars to Predict = 10:
if you enable "Keep Past Min-Max Levels" option then min-max levels will stay on the chart
Enjoy!

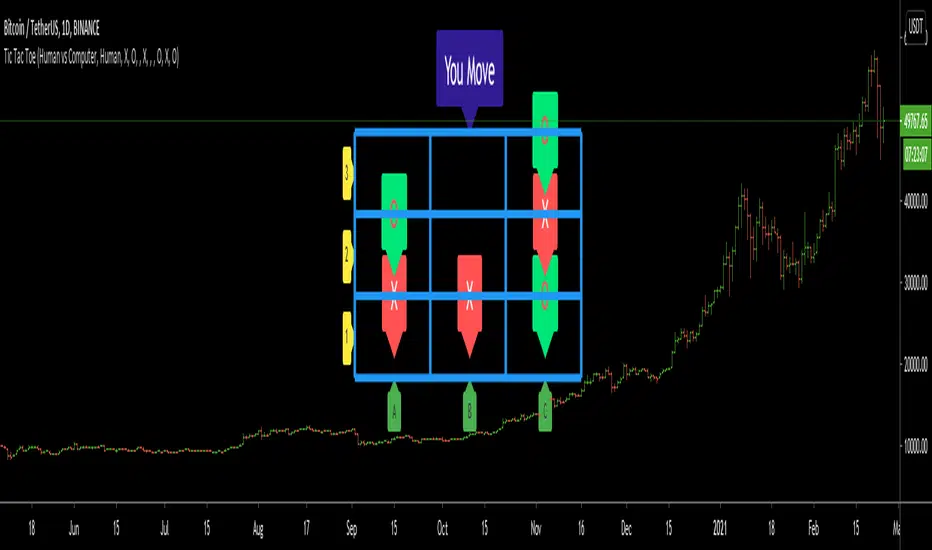
Tic Tac Toe (For Fun)Hello All,
I think all of you know the game "Tic Tac Toe" :) This time I tried to make this game, and also I tried to share an example to develop a game script in Pine. Just for fun ;)
Tic Tac Toe Game Rules:
1. The game is played on a grid that's 3 squares by 3 squares.
2. You are "O", the computer is X. Players take turns putting their marks in empty squares.
3. if a player makes 3 of her marks in a row (up, down, across, or diagonally) the he is the winner.
4. When all 9 squares are full, the game is over (draw)
So, how to play the game?
- The player/you can play "O", meaning your mark is "O", so Xs for the script. please note that: The script plays with ONLY X
- There is naming for all squears, A1, A2, A3, B1, B2, B3, C1, C2, C3. you will see all these squares in the options.
- also You can set who will play first => "Human" or "Computer"
if it's your turn to move then you will see "You Move" text, as seen in the following screenshot. for example you want to put "O" to "A1" then using options set A1 as O
How the script play?
it uses MinMax algorithm with constant depth = 4. And yes we don't have option to make recursive functions in Pine at the moment so I made four functions for each depth. this idea can be used in your scripts if you need such an algorithm. if you have no idea about MinMax algorithm you can find a lot of articles on the net :)
The script plays its move automatically if its turn to play. you will just need to set the option that computer played (A1, C3, etc)
if it's computer turn to play then it calculates and show the move it wants to play like "My Move : B3 <= X" then using options you need to set B3 as X
Also it checks if the board is valid or not:
I have tested it but if you see any bug let me know please
Enjoy!
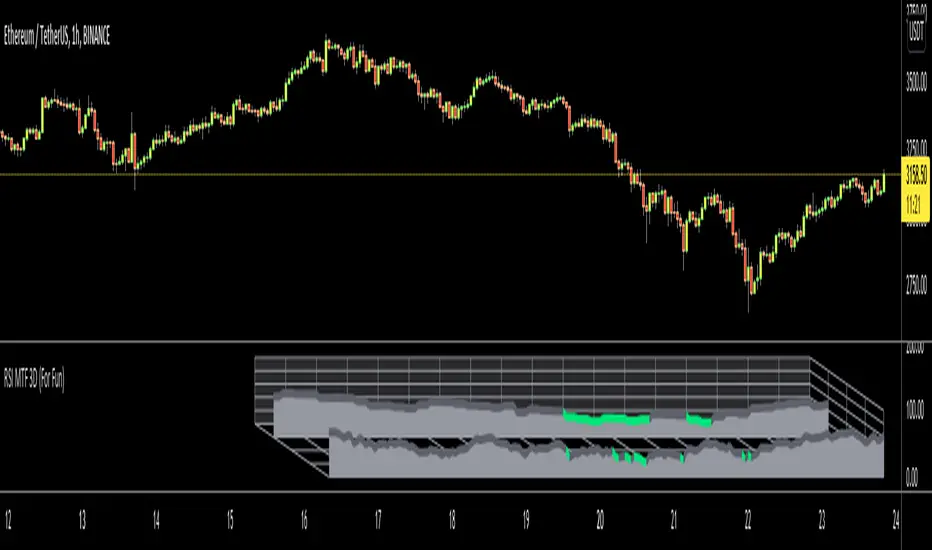
Multi Time Frame Candles with Volume Info / 3DHello Traders,
This is my second Multi Time Frame Candles script but with this new one, you will have some new features such volume info, remaining time to close of higher time frame candle and also developed using new features of Pine such array of lines. also I tried to make it 3D for better visualization ;) also it shows new highs/lows / breakouts.
I tried to make many things optional, so you can change almost everything using options.
What you can change using options:
- Higher time frame
- Number of Candles
- Candle Colors Up/Down
- Wick Color
- Volume colors Up/Down
- Text color of Remaining Time
- Shadow Color
- Background color
- Start bar of the candles (so you can see many higher times frame candles in same window)
- 3D effect, by default it's enables but you can disable 3D view
Lets see some examples:
Remaining time:
Breakouts:
You can combine different higher time frames:
if you don't want 3D view then combining different higher time frames:
You can change background color:
Enjoy!

Volume-Supported Linear Regression TrendHello Traders,
Linear Regression gives us some abilities to calculate the trend and if we combine it with volume then we may get very good results. Because if there is no volume support at up/downtrends then the trend may have a reversal soon. we also need to check the trend in different periods. With all this info, I developed Volume-Supported Linear Regression Trend script. The script checks linear regression of price and volume and then calculates trend direction and strength.
You have option to set Source, Short-Term Period and Long-Term Period. you can set them as you wish.
By default:
Close is used as "Source"
Short-Term Period is 20
Long-Term Period is 50
in following screenshot I tried to explain short term trend (for uptrend). Volume supports the trend? any volume pressure on trend? possible reversal? same idea while there is downtrend.
in following screenshot I tried to explain long term trend:
You can also check Positive/Negative Divergences to figure out possible reversals (to automate it, you can use Divergence for Many Indicators v4 , it has ability to check divergences on external indicators)
Enjoy!

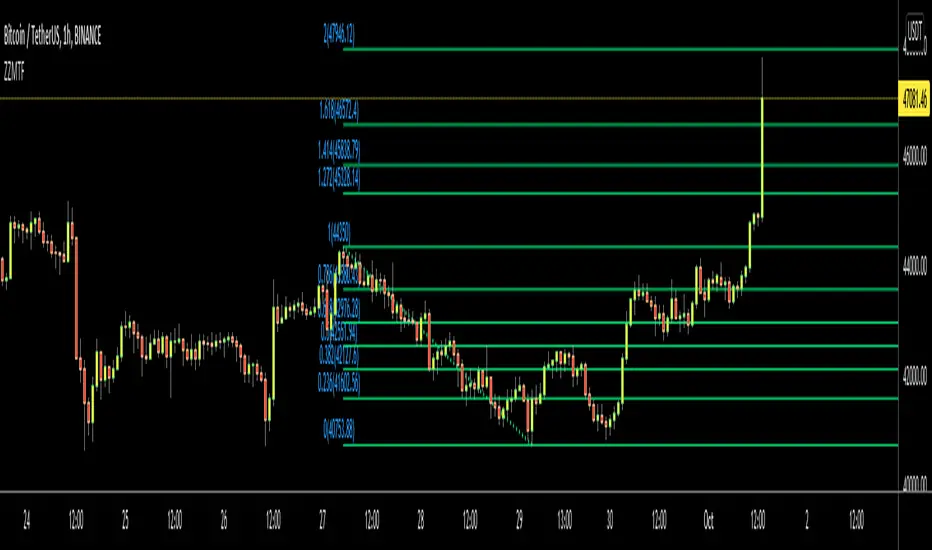
ZigZag Multi Time Frame with Fibonacci RetracementHello Traders,
This is ZigZag Multi Time Frame with Fibonacci Retracement script. It calculates the ZigZag using Higher Time Frame, draw Fibonacci Retracement lines and put labels accordingly. I already published Zigzag with Fibonacci Levels script but this one is Multi Time Frame and I didn't want to change/update it.
You can set ZigZag Period and Resolution as you wish. Zigzag is calculated using higher time frames (ex: 1day) so you better choose small numbers as Zigzag Period, such 2, 3 etc. you should choose higher time frame wisely, meaning that you should not set 1Day while chart resolution is 1min ;)
It draws Fibonacci levels between 0%-100% and If the price goes higher/lower than 100% level than the script draws Fibonacci Levels accordingly. This means it draws Fibonacci levels until this levels get higher/lower than the price.
"Show Zig Zag" is not enabled by default, you can enable it if you want to see ZigZag as well.
You have options to set Text Color, Line Color, Zigzag Up Color and Zigzag Down Color.
You can set the location of the Fibonnaci Levels -> Left or Right
You also have option to enable/disable following Fibonnaci Levels:
---> 0.236
---> 0.382
---> 0.500
---> 0.618
---> 0.786
I added "Colorful Fibonacci Levels" for fun. if you enable it then Fibonacci line colors will be different randomly on each move, see it for yourself :)
Some Screenshots:
if you enable "Show Zigzag Option":
how the script adjust levels automatically:
if you set Label Location as "Right":
if you enable "Colorful Fibonacci Levels" then Line colors will be changed on each move randomly ;)
Enjoy!
Point and Figure Chart - LiveHello Traders,
This is "Point and Figure Chart (PnF)" script that run in separated window in real time. The separated PnF chart window is timeless, so no relation with the time on the chart. PnF chart consist of "X" and "O" columns. While "X" columns represents rising prices, "O" column represents a falling price. If you have no idea about what PnF charting is then you should search for "Point and Figure Charting" on the net and get some info before using this script.
Now lets talk about details. PnF Chart requires at least two variables to be set => Box size and Reversal. Box size represents the size of each X/O in PnF chart and the reversal is used to calculate new X/O or reversal. for example if currrent column is X column then for new "X", "box size * 1" move is needed and for new "O" column or reversal, "box size * revelsal" move is needed. in the script I use lines as X/O columns.
In the options you can set "Box Size Assingment Method". you have 3 options Traditional, ATR, Percentage . what are they?
Traditional: user-defined box size, means you can set the box size as you wish, using the option . if you use this option then you should set it accordingly.
ATR : that's dynamic box size scaling and on each columns it's calculated once, you can set length for ATR
Percentage: that's also dynamic box size scaling according to closing price when new column appeared. if you use this option then you should set it accordingly.
Reversal: The reversal is typically 3 but you can change it as you wish
"Change Bar Color by PnF Trend": if you enable this option then bar color changes by PnF columns, by default it's not enabled
"Change Column Color When Breakout Occurs": PnF color changes if Double Top/Bottom breakout accours. enabled by default and you can set the colors as you wish using the options
"Change Bar Color When Breakout Occurs": bar colors changed if Double Top/Bottom breakout accours. enabled by default and you can set the colors as you wish using the options
the script checks only Double Top/Bottom breakouts at the moment. there are many other breakouts such Triple/Quadruple, Ascending/Descending Triple Top/Bottom breakouts, Catapult etc.
Also the script shows new X/O level and reversal Levels in PnF window. An example:
If you enable "Change Bar Color by PnF Trend" option:
An example if you disable the option "Change Column Color When Breakout Occurs
You may want to see my another/older "Point and Point Chart" script as well. you can find it in my profile/published scripts and in the Public Library. I use same PnF calculation algorithm in both scripts.
Enjoy!

Divergence for Many Indicators v4Hello Traders,
Here is my new year gift for the community, Digergence for Many Indicators v4 . I tried to make it modular and readable as much as I can. Thanks to Pine Team for improving Pine Platform all the time!
How it works?
- On each candle it checks divergences between current and any of last 16 Pivot Points for the indicators.
- it search divergence on choisen indicators => RSI , MACD , MACD Histogram, Stochastic , CCI , Momentum, OBV, VWMACD, CMF and any External Indicator !
- it checks following divergences for 16 pivot points that is in last 100 bars for each Indicator.
--> Regular Positive Digergences
--> Regular Negative Digergences
--> Hidden Positive Digergences
--> Hidden Negative Digergences
- for positive divergences first it checks if closing price is higher than last closing price and indicator value is higher than perious value, then start searching divergence
- for negative divergences first it checks if closing price is lower than last closing price and indicator value is lower than perious value, then start searching divergence
Some Options:
Pivot Period: you set Pivot Period as you wish. you can see Pivot Points using "Show Pivot Points" option
Source for Pivot Points: you can use Close or High/Low as source
Divergence Type: you can choose Divergence type to be shown => "Regular", "Hidden", "Regular/Hidden"
Show Indicator Names: you have different options to show indicator names => "Full", "First Letter", "Don't Show"
Show Divergence Number: option to see number of indicators which has Divergence
Show Only Last Divergence : if you enable this option then it shows only last Positive and Negative Divergences
you can include any External Indicator to see if there is divergence
- enable "Check External Indicator"
- and then choose External indicator name in the list, "External Indicator"
- External indicator name is shown as Extrn
- related external indicator must be added before enabling this option
Coloring, line width and line style options for different type of divergences.
Following Alerts added:
- Positive Regular Divergence Detected
- Negative Regular Divergence Detected
- Positive Hidden Divergence Detected
- Negative Hidden Divergence Detected
Now lets see some examples:
Hidden Divergences:
Regular and Hidden Divergences together:
Showing first letters of indicators:
You can see only the number of indicators which has divergence:
You can see only divergence lines without indicators names and numbers:
option to used different label/line/text colors:
You have option to see only last divergences:
You can change Pivot Period, in following example Pivot Period = 15:
You can use Close or High/Low as Source for Divergence
You can include external indicators and get divergences on it:
Wish you all a happy new year!
Enjoy!
