ZigZag with Fibonacci LevelsHello Traders,
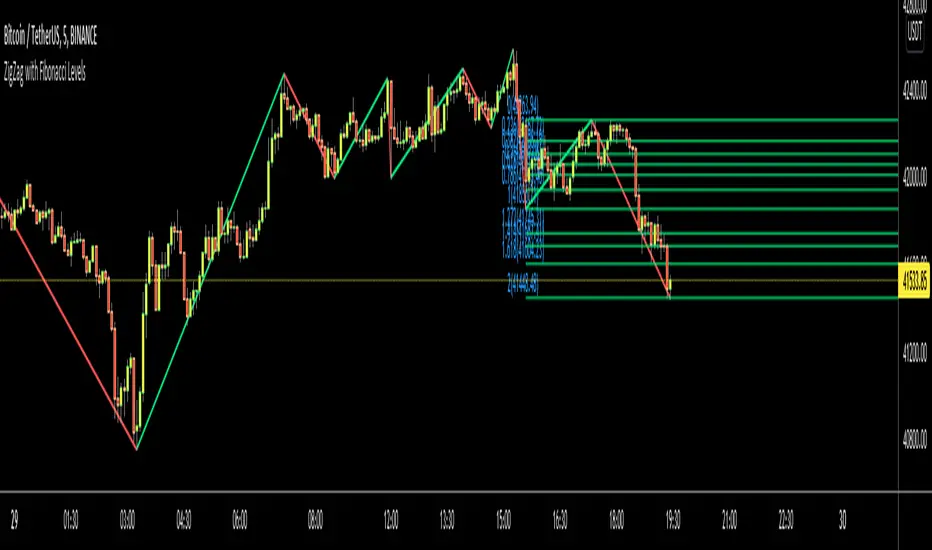
This is " ZigZag with Fibonacci Levels " script. It finds the ZigZag, draw Fibonacci lines and put labels accordingly. I get many requests for this script, so here it is.
You can set ZigZag period as you wish. Bigger numbers (such 20, 30) may give better perspective and result.
It draws Fibonacci levels between 0%-100% and If the price goes higher/lower than 100% level than the script draws Fibonacci Levels accordingly. This means it draws Fibonacci levels until this levels get higher/lower than the price.
As an example:
if you don't want to see ZigZag Lines then you have option to disable it and see only Fibonacci levels:
You have coloring options for Zigzag, Fibonacci lines and texts:
Enjoy!
Lonesometheblue
Machine Learning / Longs [Experimental]Hello Traders/Programmers,
For long time I thought that if it's possible to make a script that has own memory and criterias in Pine. it would learn and find patterns as images according to given criterias. after we have arrays of strings, lines, labels I tried and made this experimental script. The script works only for Long positions.
Now lets look at how it works:
On each candle it creates an image of last 8 candles. before the image is created it finds highest/lowest levels of 8 candles, and creates a string with the lengths 64 (8 * 8). and for each square, it checks if it contains wick, green or red body, green or red body with wicks. see the following picture:
Each square gets the value:
0: nothing in it
1: only wick in it
2: only red body in it
3. only green body in it
4: red body and wick in it
5: green body and wick in it
And then it checks if price went up equal or higher than user-defined profit. if yes then it adds the image to the memory/array. and I call this part as Learning Part.
what I mean by image is:
if there is 1 or more element in the memory, it creates image for current 8 candles and checks the memory if there is a similar images. If the image has similarity higher than user-defined similarty level then if show the label "Matched" and similarity rate and the image in the memory. if it find any with the similarity rate is equal/greater than user-defined level then it stop searching more.
As an example matched image:
and then price increased and you got the profit :)
Options:
Period: if there is possible profit higher than user-defined minimum profit in that period, it checks the images from 2. to X. bars.
Min Profit: you need to set the minimum expected profit accordingly. for example in 1m chart don't enter %10 as min profit :)
Similarity Rate: as told above, you can set minimum similarity rate, higher similarity rate means better results but if you set higher rates, number of images will decrease. set it wisely :)
Max Memory Size: you can set number of images (that gives the profit equal/higher than you set) to be saved that in memory
Change Bar Color: optionally it can change bar colors if current image is found in the memory
Current version of the script doesn't check if the price reach the minimum profit target, so no statistics.
This is completely experimental work and I made it for fun. No one or no script can predict the future. and you should not try to predict the future.
P.S. it starts searching on last bar, it doesn't check historical bars. if you want you should check it in replay mode :)
if you get calculation time out error then hide/unhide the script. ;)
Enjoy!

RSI Multi Time FrameHello Traders,
Recently we got new features in Pine such Arrays of Lines, Labels and Strings. Thanks to the Pine Team! ( here )
So I decided to make new style of Multi Time Frame indicator and I used Array of Lines in this script. here it is, RSI Multi Time Frame script. it shows RSI for current time frame as it is and also it gets RSI for the Higher Time Frame and converts it and shows it as in time frame. as you can see, RSI for HTF moves to the right on each candle until higher time frame was completed.
You have color and line width options for both RSI, also if you want you can limit the number of bars to show higher time frame RSI by the option " Number of Bars for RSI HTF ", following example show RSI HTF for 100 bars.
Most of you know that old style Multi Time Frames indicators was like:
Hope you like this new Multi time frame style ;)
Enjoy!

Technical RankHello Traders,
Technical Rank (TR) was authored by John Murphy . Technical Rank shows how a security is performing relative to its peers. Multiple moving averages, rate of change and the Relative Strength Index (RSI) indicators are used to calculate the Technical Rank. These values are mathematically manipulated with percentage factors and then summed together. there are 3 parts, long term, middle term and short term. for Long term part Moving Average with length 200 (30%) and Rate of Change with the length 125 (30%) are used, for middle term part, Moving Average with length 50 (15%) and Rate of Change with the length 20 (15%) are used and for short term part, PPO (5%) and RSI (5%) used.
Technical Rank is created using the following formula and weightings:
Long-Term Indicators (weighting): Percent above/below the 200-day exponential moving average (EMA) (30% weight) and the 125-day rate-of-change (ROC) (30% weight).
Medium-Term Indicators (weighting): Percent above/below 50-day EMA (15%) and the 20-day rate-of-change (15%).
Short-Term Indicators (weighting): Three-day slope of percentage price oscillator histogram divided by three (5%) and the relative strength index (5%).
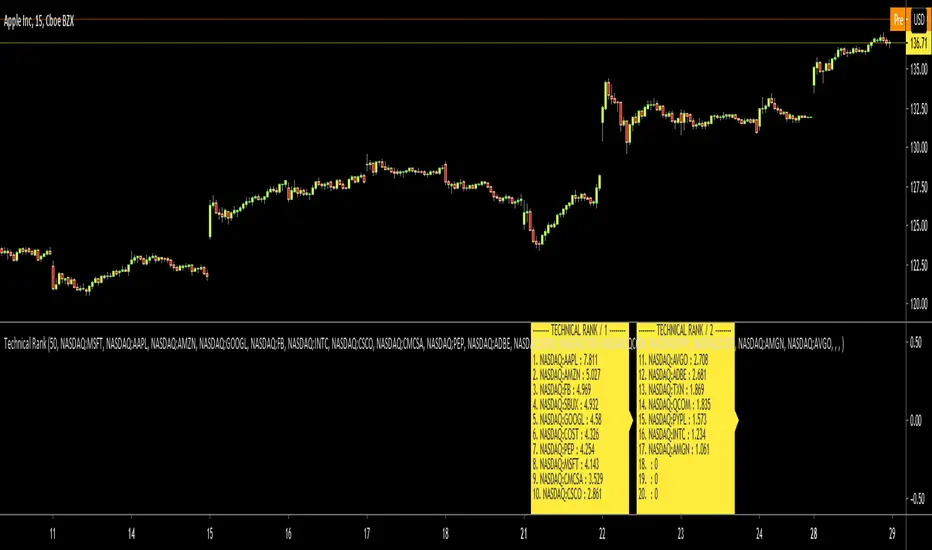
The scripts calculates Technical Rank for 10 different securities and sorts them by Technical Rank value. A ranking of zero indicates the stock is the weakest in the group technically. A rank of 100 indicates the stock ranks highest in terms of technical performance. An increasing Technical Rank means the stock's price performance is showing strength relative to the group of stock being analyzed. A decreasing Technical Rank shows deteriorating relative price performance. Securities in the top 3-4 will have a technical rank of 70 or higher. You should focus on these relatively strong securities for potential long positions on pullbacks. You can also use the technical rank to avoid weak securities (in the bottom 3-4). I recommend you to check Technical Rank for the securities in multiple time frames.
You can choose the symbols as you want but you should choose the symbols with the same session info. for example only Cryptos, only Stocks, only FX pairs etc. (not mix of them).
Enjoy!
Moving Averages as Support Resistance MTFHello Traders!
As most of you know that Moving Averages with the lengths 50, 100, 150 and 200 are very important. We should use these this moving averages to figure out S/R levels, the possible reversals points, trend direction etc. we should check these moving averages on Higher Time Frames as well. for example if you look at the chart with 5mins time frame, you should also check it in 1hour and 4hour time frames to see to big picture and main trend. this is important as trend is your friend and you should not take positions against the trend.
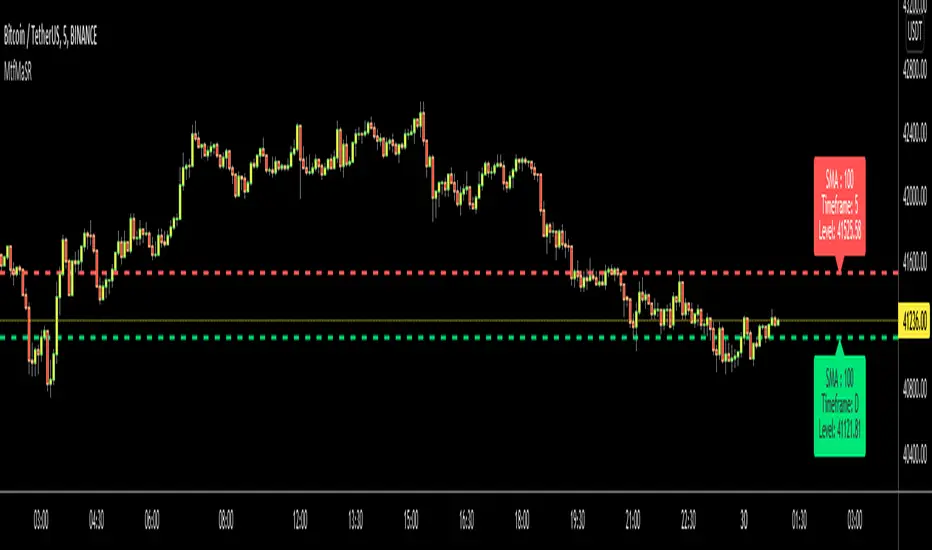
I developed this script to show them clearly and make the chart understandable. 1 resistance line above the price and 1 support line below the price, it shows the moving average type, length, time frame and S/R level.
You have option to show SMA or EMA and to include/exclude current time frame, because you may want to see only MAs from higher time frames. you should set higher time frames accordingly.
if you add all moving averages for current and higher time frame the chart looks very crowded as following example:
The script makes it clear to understand the chart better, here an example:
It can show when S/R was broken and you get alert. here an example:
You have coloring and style options, you can change line style and colors as you wish:
Enjoy!
Double Zig Zag with HHLLHello Traders,
Here Double Zig Zag with HHLL script is with you. it calculates 2 Zig Zag simultaneously and draws them, and also it calculates and puts Higher High, Lower Low, Higher Low, Lower High labels. All these are done dynamically, it means last HH/HL/LL/LH can change. if price continues to go up then HL can turn to LL or if price continues to go down then LH can turn to HH. This script can be used for different purposes such trend analysis, support/resistance levels, breakouts etc.
I tried to make many things optional:
You can set Periods for Zig Zags as you wish
You can set different colors for both Zig Zag Up/Down lines
You have option to show both Zig Zag, one of them or none them
You have option to show both HHLL, one of them or none them
You can set Zig Zag 1 line style as Dashed or Dotted
You can set Line Widths for Zig Zags
Some examples:
Enjoy!

Start the Script on Last Nth Bar [Experimental]Hello Pine Scripters,
Sometimes we need to run some processes in the scripts on last N bar but currently we don't know bar_index value of realtime bar or number of remaining bars before we reached it. So most of us use "start date" as input and run some processes after "start date".
This experimental script finds last Nth bar approximately. As you can see in the script we (should) use GMT, otherwise as I see the result might not be accurate (we don't know timezone used on the chart)
The idea is to find/use similar bar in the past (using timenow as reference) and then calculate aproximate the time of last Nth bar. the results may not be accurate all the time, also we can not know local holidays etc.
At the moment the script works on 1minute or higher time frames (it won't work on less 1min timeframes)
In the future if the Pine Team add something like "bar_index_realtime" then we will not need such things. by the way many thanks to Pine Team, they are doing great job.
You can use this script in your scripts as you want, no need to ask permission. If you can improve it let me know ;)
Enjoy!

RSI Tops and BottomsHello Traders
This script finds Tops when RSI is in overbought area or Bottoms when RSI is in oversold area and checks the divergence between them. it checks divergence at tops/bottoms after RSI exited from OB/OS areas.
You can change overbought / oversold levels.
You can limit the time that RSI is in OB/OS area with the option "Max Number of Bars in OB/OS"
you can set the minimum/maximum distances between Tops/Bottoms with the options "Min Number of Bars between Tops/Bottoms" and "Max Number of Bars between Topss/Bottoms"
and you can set the color and line widths as you wish.
These tops or bottom must be sequential, means there mustn't be another top while checking tops or bottom while checking bottoms between them.
in next example you can see valid and invalid bottoms:
After you got signal then you better use Stop Order, a few pips higher than the high of colored candle for long positions, ( vise versa in short positions ). so you may escape from traps. ("Stop order" is filled when the price reached a pre-specified price. for example the price is now 10.0 and you set Buy Stop Order at 11.0 then if price reaches 11.0 then your buy order get filled. you can put stoploss a few pips lower than the low of colored candle or you can use ATR to decice stoploss level. how you wish)
For example in following screenshot you can see that buy stop order was not filled and you didn't take long position.
Enjoy!

Bitcoin Bullish Percent IndexHello Traders,
This is Bitcoin Bullish Percent Index script. First lets talk about what the Bullish Percent Index and how it is calculated:
"The Bullish Percent Index (BPI) is a breadth indicator based on the number of securities on Point & Figure Buy Signals, Developed by Abe Cohen in the mid-1950s. Because a security is either on a P&F Buy or Sell Signal, there is no ambiguity when it comes to P&F charts. This makes BPI a straightforward indicator with clearly defined signals."
The calculation is straightforward and simple: (Number of securities on P&F Buy signals) / (Total number of securities)
Here you can see what the P&F buy signal is:
In this script I choose 40 cryptos that is correlated ( as I see ) with BTC (including BtcUsdt). in the first part the script creates P&F chart for each security and check if there is Buy or Sell signal and sum the buy signals if there is. in the second part it creates P&F chart by using the P&F buy/sell signals coming from the securities P&F chart. because of complicated calculation the script may need a few seconds to load.
in the first part reversal value is 3 by default but you can set different values as reversal. sometimes I got better results with reversal = 5.
in BPI part reversal = 3 is used. so each box represents 2% (each X or O is a box). And this means it takes at least a 6% move in BPI for a reversal. the Bullish Percent Index favors the bulls when above 50% and the bears when below 50%. The bulls have the edge when over 50% of stocks are on a P&F Buy Signal. BPI is also considered overbought when above 70% and oversold when below 30%. BPI can move between 0 and 100.
Because of 40 securities are used in the script and all different prices, it uses Percentage scaling only. it can calculate the Percentage automatically by using the time frame of the chart or you can set it as you wish.
The Signals coming from BPI:
Bull Alert: BPI is below 30% and then forms a new column of X's (rises)
Bear Alert: BPI is above 70% and then forms a new column of O's that decline below 70%.
Bull Confirmed: BPI is on a P&F buy signal and in a column of X's (rising).
Bear Confirmed: BPI is on a P&F sell signal and in a column of O's (falling).
Bull Correction: BPI is on a P&F buy signal, but currently falling (column of O's).
Bear Correction: BPI is on a P&F sell signal, but currently rising (column of X's).
If you are not familiar with Bullish Percent Index you better search it on the net to get more info, you can find a lot of articles and web sites about BPI.
as I remember I developed the script 6-7 months ago and today I had chance to publish it as it was
Enjoy!

Clock [Example]Hello All,
I published this script as an example. it calculates/show current Hour, Minute and Second by using timenow function, it also show remaining time to close of the candle. You can freely use the source code in your scripts if you need.
"A man who dares to waste one hour of time has not discovered the value of life" - Charles Darwin
Enjoy!

Multi Time Frame CandlesHello Traders,
This script can show (upto) 3 candles of another time frames without changing chart time frame realtime . You can choose the time frame and number of candles in the options. You have option to change body and wick colors as well.
in this example number of candles is 2:
You can set body and wick colors:
In this example, weekly candles are shown on 1h chart:
Enjoy!

Support Resistance - Aging [Example]Hello All,
First all of Thanks to Pine Team for adding Arrays to Pine!
In this script I tried to make example for
1. Finding S/R lines using highest/lowest function
2. Using 1D array as 2D (we keep S/R levels and age)
3. "Age" usage for S/R levels, getting older on each candle and changing colors by their age (maximum age is 127 then it disappears)
You can use "Close"/Open " or " High/Low " as source.
There is an option for the background color, by default it's Black, do not forget to set it accordingly :)
Enjoy!

Cumulative Delta VolumeHello Traders,
This is Cumulative Delta Volume script. Delta refers to the difference between buying and selling volume at each price level. Cumulative Delta builds upon this concept by recording a cumulative tally of these differences in buying vs selling volume. The Cumulative Delta indicator plots as candlesticks or line. One of the main uses of Cumulative Delta is to confirm or deny market trends. you may need to search it for yourself ;)
You have option to see it as Candles or a Line. also there are options to show 2 SMAs and 2 EMAs with different Lengths, you can set the lengths as you wish.
By default it shows CDV as Heikin Ashi Candles, it can also show it as normal candles:
It can show CDV as a line:
Also you may need to check divergence:
Enjoy!

Support Resistance - Dynamic v2Hello Traders!
After the addition of "Arrays" to the Pine, I developed new and improved version of Support Resistance - Dynamic script as version 2. In this script Arrays were used. This can be used as Support Resistance tool, also it will be an example for the people who want to learn Array usage in Pine. Many thanks to Pine Team for adding Arrays!
The script finds the Pivot Points and check them in channels if there can be S/R or not, and draws mid line of the channel as S/R line. you can set number of PPs and channel width in the options. Each channel width is optimized dynamically according to Pivot Points. Also you can choose " High/Low " or " Close/Open " as source for Pivot Points.
There is an option for maximum number of S/R levels. S/R levels are found and sorted dynamically and number of S/R lines with enough strength changes dynamically.
Some other options for coloring and line width. (Solid, Dashed or Dotted)
S/R levels are shown in the Labels and Label colors are changed automatically, if S/R line is below the closing price then it's color is Green (as Support), otherwise its color is Red (as Resistance).
Examples:
Enjoy!

Smoothed CandlesHello Traders,
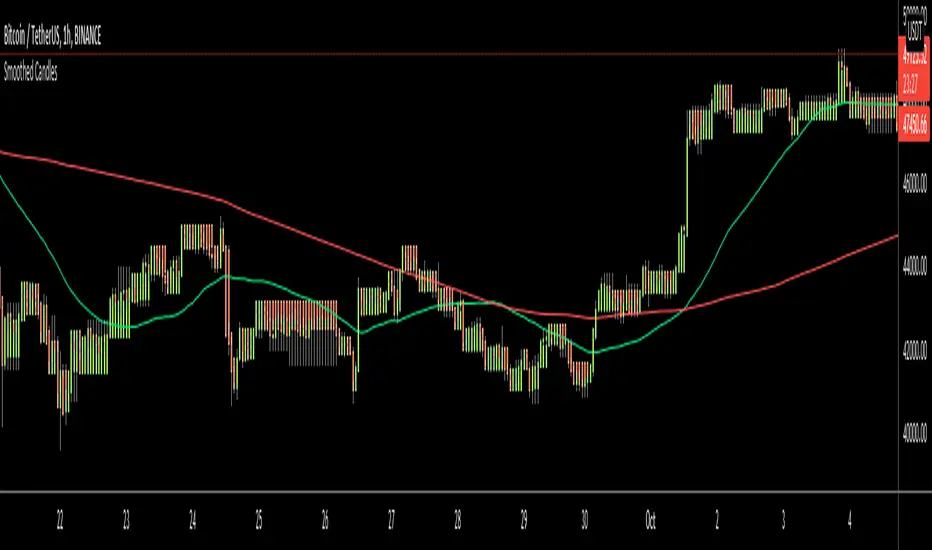
This is " Smoothed Candles " script to get rid of noises and to get a smoothed chart to figure out breakouts and price movements easily.
There are three scaling methods: User Defined, Dynamic (ATR) and Percentage
Optionally you can add 2 Simple Moving Averages and 2 Exponential Moving Averages
Optionally you can hide the Wicks, example:
You can add moving averages:
Easily find breakouts:
Enjoy!
Position SizingHello All,
This script can be used for Position Sizing.
After you entered Capital you have, how much you can Risk per Trade, Profit and Stoploss Levels, it calculates Number of Buys/Sells, Position Size and Reward/Risk ratio. you need to choose one of "Long" or "Short" position you will take.
Number of Buys formula = Capital * RiskPerTrade / Loss
Position Size = NumberOfBuys * EntryPrice
Reward / Risk rate = (TargetPrice - EntryPrice) / (EntryPrice - StoplossPrice)
Enjoy!

Trend Following with Moving AveragesHello Traders,
With the info "Trend is Your Friend ", you should not take position against the trend. This script checks multipte moving averages if they are above/below the closing price and try to find trend. The moving averages with the length 8, 13, 21, 34, 55, 89, 144, 233, 377 used. these are fibonacci numbers, but optionally you can change the lengths of each moving averages. while it's green you better take long positions, while it's red you better take short positions according to other indcators or tools.
Optionally you have "smoothing" option to get rid of whipsaws. it's enabled by default.
You have option to use following moving average types: EMA, SMA, RMA, WMA, VWMA. by default it's EMA
Also the script has "Resolution" option. with this option you can get the trend for other time frames, in following example 1h was set as for higher time frame on 15m chart:
This should not be used as buy/sell signal indicators as it's tries to find trend but not entry points, you should use other indicators (such RSI, Momentum) or other tools to find buy/sell signals.
Enjoy!

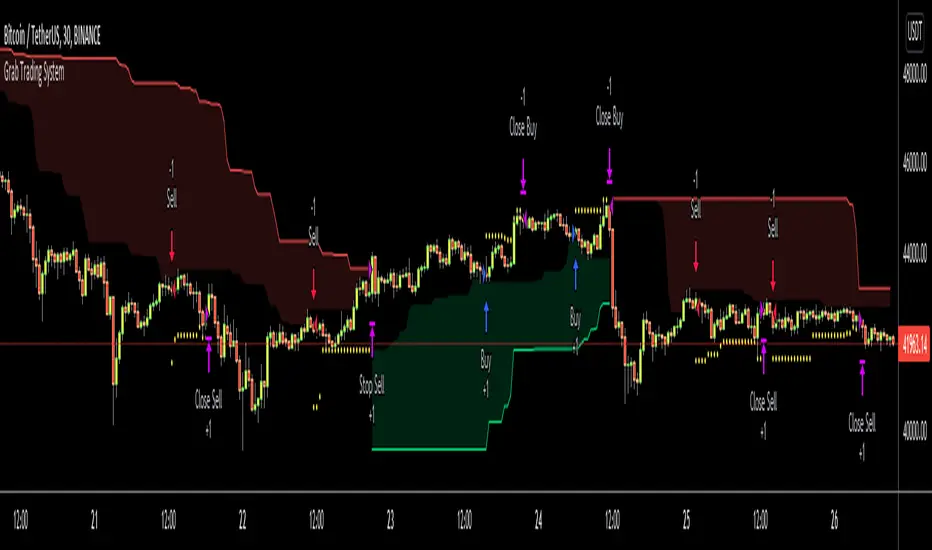
Grab Trading SystemHello All,
This is "Grab Trading System" script defined in the book "Trend Following" by Michael W. Covel. also named as "Two-box system". I made small changes and I guess that it can be improved more.
The definition: Far box defines major trend; system trades only in same direction as major trend, meanwhile fading the signals of near box. Last trade in each trend exits at break of far box - at the same time as the trend reverses. All trades, except the last in the trend, use a limit order, as they are fading the near box. The last trade exits on a stop, as the trend changes.
As you can see there is Longterm Period and Shortterm Period in the indicator options. Longterm period is used for major trend and shortterm period is used to take position according to major trend. in my test I got better performance in small time frames. you need to set longterm/shortterm periods by your trading strategies.
Enjoy!
MACD-ASHello All,
This the script for Moving Average Convergence Divergence – MACD of Thomas Aspray, and called as MACD-AS and you may get earlier signals than MACD.
As MACD and MACD-AS are trend following indicators, they do not function well in sideway markets.
An example how it gets earlier signals than MACD
Good luck!

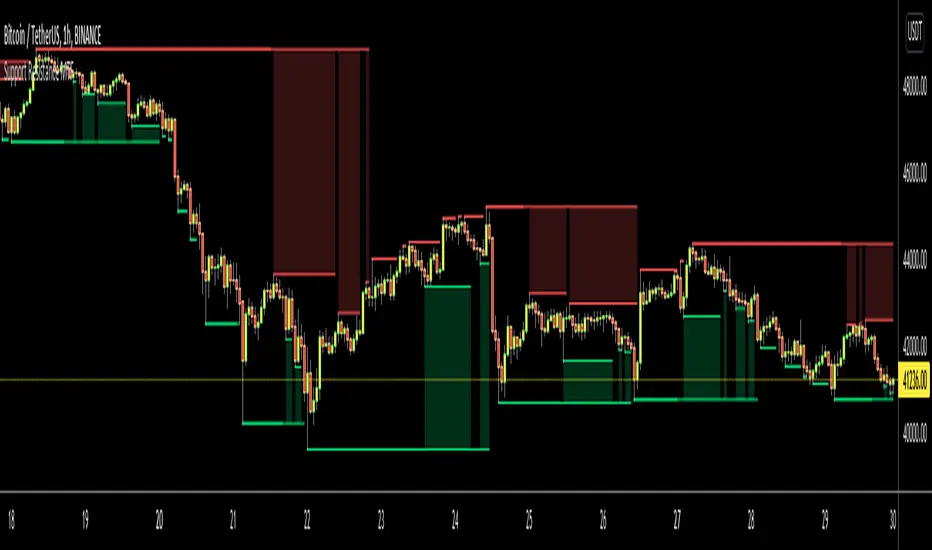
Support Resistance MTFHello Traders,
This is Support Resistance script that uses Multi Time Frame. While getting Close/Open/High/Low values of Higher Time Frames the script does NOT use Security function , instead it calculates them.
while choosing Higher Time Frame, you can use "Auto" option so it uses predefined Higher Time Frames, or you can choose the Higher Time Frame Manually from the list. options for HTF => 15mins, 30mins, 60mins, 120mins, 180mins, 240mins, 720mins, Day, Week, 2 Weeks, Months, 3 Months, 6 Months, 12 Months.
You have option to use High/Low or Close/Open values while calculating support resistance levels.
"Period for Highest/Lowest Bars" option is used as loopback period to check if it's Highest/lowest bars. smaller numbers = more sensitive result.
You have option for transparency and coloring of support/resistance levels/zone => Red, Lime, Blue, White, Black, Olive, Gray
An example for 15 min chart, 4hours selected as HTF
You can set transparency and colors as you wish:
You can choose Close/Open prices while calculating S/R levels instead of High/Low
Enjoy!
Volume Multi Time FrameHi All,
This script shows total volume info of Higher Time Frame. it checks open/close prices of higher time frame and sets the color. it also show a dynamic line on last volume , so you can see when HTF candle started and ended. by looking at the color of volume columns you can see HTF candle is green or red. it's something like weis wave volume that is using HTF candles.
Higher time frame is set automatically, you can set it manually by choosing "User-defined" in the indicator options and choose higher time frame as you want
Here some examples:
Current time freame is 1min and htf is 1hour
Current time freame is 1min and htf is 1day
Enjoy!

Consolidation Zones - LiveHello Traders!
This is the script that finds Consolidation Zones in Realtime.
How it works?
- The script finds highest/lowest bars by using "Loopback Period"
- Then it calculates direction
- By using the direction and highest/lowest bar info it calculates consolidation zones in realtime
- If the length of consolidation area is equal/greater than user-defined min length then this area is shown as consolidation zone
- Then Consolidation Zone extends automatically if there is no breakout
if you increase the Loopback Length then you get bigger consolidation zones:
You have option to "Paint Consolidation Area" or not:
Enjoy!

Candlestick Reversal SystemHello Traders,
In the book "Secrets of a Pivot Boss: Revealing Proven Methods for Profiting in the Market" by Franklin Ochoa, Four different types of reversal systems were introduced and candlestick patterns are used to find reversals. I will not write a lot about the book, you should get/read it for yourself. There are many great ideas in the book, Candlesetick Reversal System, Following Trend, Time Price Opportunity, Advanced Camarilla Concepts and much more.
Reversal systems mentioned in the book are :
- Wick Reversal System
- Exteme Reversal System
- Outside Reversal System
- Doji Reversal System
I tried to add these four reversal systems to the script. If you need detailed info you better read the book ;)
Enjoy!
