EPMA % Impulsive| QuantEdgeBEPMA % Impulsive | QuantEdgeB
🔍 What Is EPMA % Impulsive?
A volatility‐standardized impulse oscillator built on a forward-projected, low-lag moving average baseline. It transforms raw price into a 0–100% “impulse meter” by:
1. Trend Projection: Smoothing price with a double-EMA and fitting a short-term regression line that’s extended forward to anticipate direction.
2. Volatility Normalization: Wrapping that projected level in dynamic standard-deviation bands, then scaling price within those bands to a percentage scale.
3. Impulse Thresholds: Offering fixed, percentile-based, or rolling-volatility triggers to distinguish genuine bursts from noise.
💡 Why It’s Special
• Forward-Looking Base: By projecting the regression line forward, it reduces lag and “chases” trends intelligently.
• Noise-Aware Scaling: Volatility bands adapt in real time—quiet markets tighten bands, explosive markets widen them—ensuring the % reading always reflects true impulse, not random jitter.
• Flexible Thresholds: Static levels for simplicity, percentile ranks for regime-aware signals, or full standard-deviation bands for a purely data-driven approach.
• Dual Signal Styles: “Impulsive” mode for raw crossovers; “Smooth” mode for filtered breakouts that favor trend persistence.
⚙️ Key Components (High-Level)
1. DEMA Regression Engine
o Smooths price with double-EMA, fits a rolling regression, then projects it forward.
2. Volatility Bands
o Computes ±N × SD around the projected line to capture current turbulence.
3. % Scaling & Smoothing
o Maps price into a 0–100% range within those bands, then applies a final EMA to stabilize.
4. Impulse Triggers
o Crosses of the % line vs. your chosen thresholds generate long/short flags.
5. Visualization & Alerts
o Color-coded candles, threshold lines, zone fills, arrow markers, plus alert conditions on crossover/crossunder.
💼 Use Cases & Advantages
• Swing-Entry Precision
Pinpoint true momentum bursts for tighter entries and stops—avoiding false breakouts in choppy environments.
• Trend Confirmation
Validate whether a breakout is a sustained impulse (e.g., > 75th percentile) or just a spike that quickly fades.
• Regime Adaptability
Automatically tune sensitivity in low-volatility consolidations versus high-volatility expansions—no manual adjustments needed.
• Multi-Asset Versatility
Works seamlessly on stocks, futures, FX, crypto, and commodities—because it normalizes entirely to volatility, not price scale.
• Clarity & Confidence
A single, easy-to-interpret % reading plus visual cues make momentum obvious at a glance—empowering quick, data-driven decisions.
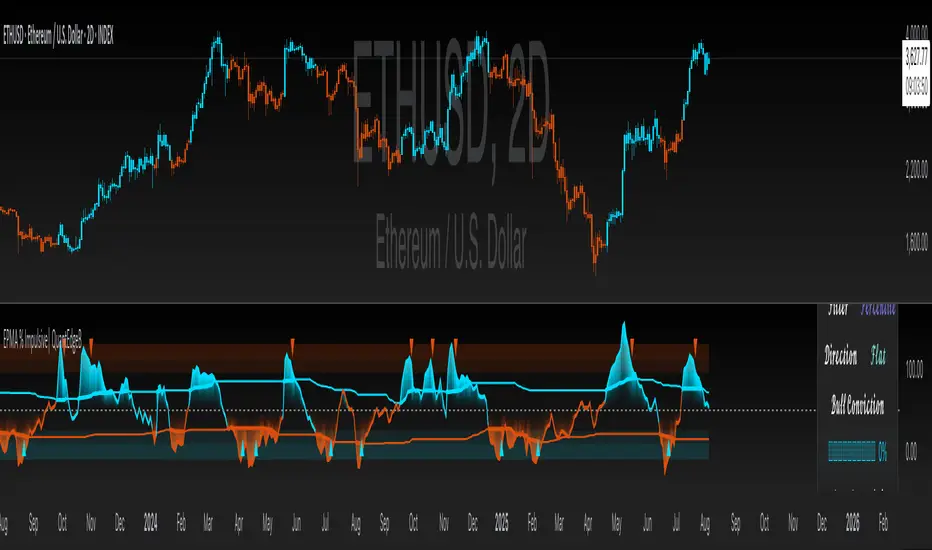
• Couple of charts examples.
BTC 1D
ETH 12H
SOL 8H
DOGE 4H
📌 Disclaimer:
Backtest results are based on past performance and do not guarantee future success. Always incorporate real-time validation and risk management in live trading.
🎨 Default Settings (Example)
• EPMA Lookback: 21 bars, forward-project 50 bars
• Volatility Band: ±2 × SD over 20 bars
• Threshold Type: Percentile 75/25 over 70 bars
• Signal Mode: Impulsive, Bar Color = On
📌 In Summary
EPMA % Impulsive | QuantEdgeB is your forward-projecting, volatility-aware momentum meter—combining regression forecasting with adaptive scaling to surface only the most meaningful impulse moves. Whether you’re timing swing entries or validating breakouts, it turns raw price into a clear, normalized impulse signal that adapts to any market regime.
🔹 Disclaimer: Past performance is not indicative of future results. No trading strategy can guarantee success in financial markets.
🔹 Strategic Advice: Always backtest, optimize, and align parameters with your trading objectives and risk tolerance before live trading.
M-oscillator
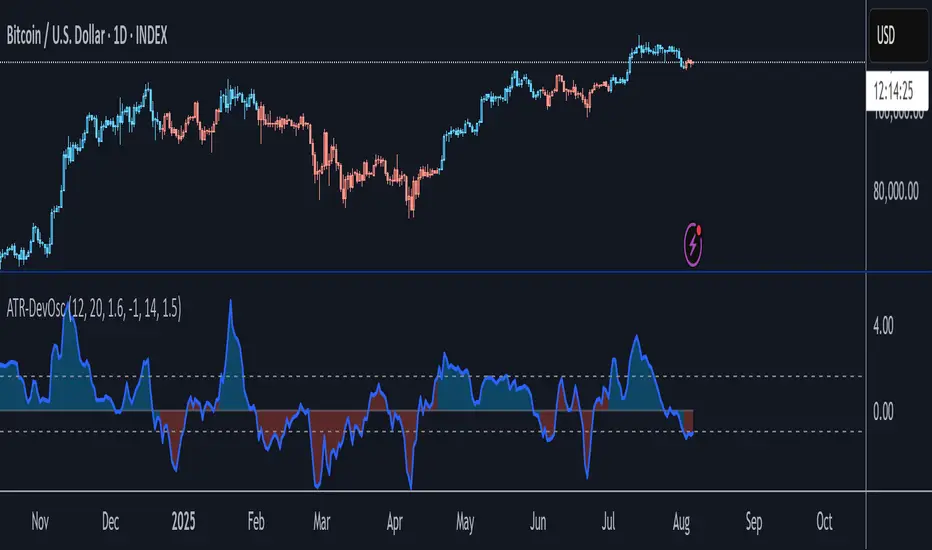
ATR-Scaled Deviation OscillatorATR-DevOsc is a custom momentum-and-volatility adaptive oscillator that scales N-bar price momentum by its rolling deviation and then reacts dynamically to sudden ATR spikes. By shrinking the deviation window when true volatility surges, it amplifies extreme moves—making medium-term trend shifts and deep drawdowns far more likely to breach your predefined thresholds.
Key features include:
• configurable momentum length and separate deviation length for precise control over look-back periods
• ATR Reaction Multiplier to tune how strongly sudden volatility spikes contract the deviation, boosting oscillator amplitude during extreme moves
• independent upper and lower threshold inputs for clear long/short signal definitions
• integrated candle-coloring overlay to immediately visualize trend state on your price chart
• built-in alert conditions for both oscillator-threshold crossovers and ATR-reactive triggers
This indicator is particularly useful for swing traders seeking medium-term entry and exit points in highly volatile markets like BTC. It combines normalized momentum readings with true volatility feedback, so large drawdowns or breakouts generate unmistakable signal events while routine noise stays filtered.
Note: ATR-DevOsc is provided “as is” without formal robustness or optimization testing. Past performance is not indicative of future results; use in live trading only after sufficient back-testing and validation.
DeltaStats (Anchored)DeltaStats (Anchored)
Benchmark price, volatility, and true range against your anchor period—instantly.
Metrics:
• Net Change
– Compares current close to the opening price of the chosen anchor period for % and log returns
– Normalized (PoP) Change = (net move ÷ √span) ÷ weighted average of per-bar absolute moves over the normalization span
• Standard Deviation
– Calculates SD over the anchor period and displays: % of mean, log % of mean
– Normalized (PoP) SD = (current period SD − prior period SD) ÷ weighted average of per-period RMS deviations over the normalization span
• Average True Range
– Calculates ATR over the anchor period and displays: TR/TrueMid % (avg), TR/TrueMid log % (avg)
– Normalized (PoP) ATR = (current period ATR − prior period ATR) ÷ weighted average of per-bar true ranges over the normalization span
Toggle each metric between
1. % of Baseline
2. Log % of Baseline
3. Normalized (PoP—period-over-period)
Underlying calculations:
• Net Change
– % vs baseline = (close ÷ anchorOpen − 1) × 100
– Log % vs baseline = log(close ÷ anchorOpen) × 100
– Normalized (PoP) = (Δ ÷ √span) ÷ weighted average of |Δ one-bar| over norm span
• Standard Deviation
– % of mean = SD(period) ÷ SMA(close, period) × 100
– Log % of mean = log(SD(period) ÷ SMA(close, period) + 1) × 100
– Normalized (PoP) = (SD(period) − SD(prior period)) ÷ weighted average of per-period RMS deviations over norm span
• Average True Range
– % vs TrueMid = SMA(TR ÷ TrueMid, period) × 100
– Log % vs TrueMid = SMA(log(TR ÷ TrueMid + 1), period) × 100
– Normalized (PoP) = (ATR(period) − ATR(prior period)) ÷ weighted average of one-bar TR over norm span

DeltaStats (Rolling)DeltaStats (Rolling)
Benchmark price, volatility, and true range over your rolling window—instantly.
Metrics:
• Net Change
– Compares today’s close to the close span bars ago for % and log returns
– Normalized (PoP) Change = (net move ÷ √span) ÷ simple average of per-bar absolute moves over span × multiplier
• Standard Deviation
– Calculates span-bar SD and displays: % of mean, log % of mean
– Normalized (PoP) SD = (current SD − span bars ago SD) ÷ simple average of RMS deviations over span × multiplier
• Average True Range
– Calculates span-bar ATR and displays: TR/TrueMid % (avg), TR/TrueMid log % (avg)
– Normalized (PoP) ATR = (current ATR − span bars ago ATR) ÷ simple average of one-bar TR over span × multiplier
Toggle each metric between
1. % of Baseline
2. Log % of Baseline
3. Normalized (PoP—period-over-period)
Underlying calculations:
• Net Change
– % vs baseline = (close ÷ close − 1) × 100
– Log % vs baseline = log(close ÷ close ) × 100
– Normalized (PoP) = (Δ ÷ √span) ÷ SMA(|Δ one-bar|, span × mult)
• Standard Deviation
– % of mean = SD(span) ÷ SMA(close, span) × 100
– Log % of mean = log(SD(span) ÷ SMA(close, span) + 1) × 100
– Normalized (PoP) = (SD(span) − SD(span ago)) ÷ SMA(RMS deviations, span × mult)
• Average True Range
– % vs TrueMid = SMA(TR ÷ TrueMid, span) × 100
– Log % vs TrueMid = SMA(log(TR ÷ TrueMid + 1), span) × 100
– Normalized (PoP) = (ATR(span) − ATR(span ago)) ÷ SMA(one-bar TR, span × mult)

Fibonacci-Based Volume Flow (VFI)Fibonacci-based Volume Flow is an advanced next-generation evolution of LazyBear’s original VFI script that calculates and averages up to 21 Fibonacci-based VFI pairings to create a smoothed composite volume flow signal. This unique and powerful approach reduces noise, adapts to volatility, and provides a clearer view of trend strength and market structure across all timeframes. It also includes dynamic fibonacci guide levels, adaptive lookbacks, EMA crossovers, and structure-aware pivot labeling to help traders identify high-quality reversals, confirm directional bias, and detect divergences with greater precision. It's ideal for traders looking to enhance momentum analysis through volume-based confirmation.
🧠 Key Features🧠
🔹 Multi-VFI Fibonacci Fusion🔹
Blends up to 21 VFI signals (5, 13, 21, 34… up to 610) into smartly paired averages (e.g., 13/34, 55/144) — forming a smoothed composite VFI that’s more adaptive, less noisy, and highly responsive across market conditions.
🔸🔸 Dynamic Lookbacks🔸 🔸
Automatically adjusts histogram high/low tracking based on your chart’s timeframe — no more static tuning. Perfect for scalping fast charts or confirming long-term trends.
🟥🟩 Color-Coded Histogram🟥🟩
Visualizes VFI momentum with gradient coloring.
🧩🧩 Signal Crossovers 🧩🧩
Color-coded crossover lines persistently show bullish or bearish dominance.
Includes three powerful crossover systems:
➖5/13 VFI: Fast, early reversal detection
➖8/21 VFI: Swing-trading sweet spot
➖55/144 VFI: Trend confirmation across long cycles
🏷️ 🏷️Pivot Structure Labels🏷️🏷️
Labels oscillator swings with full structural logic:
➖HH, HL, LH, LL, EQ
➖Displays percent change, price at pivot, oscillator reading
➖Smart coloring detects divergence & trend continuation
📈 📈Dynamic Histogram Guides📈📈
Optional zero and ±50% bands anchor histogram levels based on real histogram extremes, not static thresholds — visually frame momentum shifts with context.
📍 📍Persistent High/Low Pivot Lines📍📍
Track the most significant histogram pivots (not price) across time, with smart labels:
➖Volume flow structure zones
➖Label shows price at pivot, oscillator level, and bars since event
➖Ideal for spotting divergence zones, momentum failures, and trend exhaustion.
🔍 🔍Volatility Table (ATR%)🔍🔍
💡Shows real-time volatility compression or expansion
💡Uses multiple ATR periods (e.g., 14 & 55) for short- and medium-term comparison
💡Helps traders understand whether momentum is likely to continue or stall
🔩🔩Volume-weighted VFI baselines🔩🔩
🟢A daily session-based VWAP of the VFI, which resets each day and highlights intraday volume flow context.
🟠A rolling VWA of VFI, which acts like a VWMA over a fixed window (e.g., 55 bars), smoothing short-term fluctuations and supporting trend/momentum confirmation.
These VWAP-style overlays help traders identify strength vs. weakness relative to volume-weighted baselines — useful for divergence spotting, mean reversion setups, or breakout confirmation.
🧰 🧰Under the Hood: How It Works🧰🧰
🔧 Core VFI Logic
Based on LazyBear’s foundational VFI:
➖Uses log returns of price (HLC3)
➖Filters insignificant moves using volatility-weighted thresholds
➖Normalizes volume via adaptive capping (e.g., 2.5× average)
🌀 Composite Blend System
Each VFI instance is smoothed and then fused via user-selectable pairs. This creates a customizable average VFI representing short, mid, and long-term pressure — one value, many time horizons.
📊 EMA Signal Layer
Crosses trigger persistent color shifts in signal lines, making trend strength clear at a glance.
VFI blend feeds into EMA crossovers. You can toggle visibility for:
➖Fast (5/13)
➖Medium (8/21)
➖Slow (55/144)
🧭 Pivot Framework
Structure logic only compares pivots on same-side polarity:
➖Highs compare to highs above zero
➖Lows compare to lows below zero
This avoids nonsensical comparisons and preserves logical sequences (HH → LH → HL).
🧱 Dynamic Labels
All pivots and persistent levels display:
➖Oscillator value
➖Price value
➖Structure tag (e.g., LH, HL)
➖% change from prior pivot
➖Lookback info
➖Bar age
Unlike traditional VFI:
✅ It blends timeframes with Fibonacci precision
✅ Uses dynamic, volatility-aware logic
✅ Embeds visual structure & divergence intelligence
✅ Enhances entry confidence and exit timing
🔧 This isn’t just an indicator — it’s a volume-informed decision engine.
Ideal For:
🔶Trend-followers wanting cleaner volume-based confirmation
🔶Reversal traders spotting structure + divergence
🔶Scalpers or investors needing adaptable signals
🔶Those who loved LazyBear's VFI
📌 Final Note:
As powerful as Fibonacci Blended Volume Flow is, no single indicator should be used in isolation. For best results, combine it with price action analysis, higher-timeframe context, and complementary tools like trendlines, moving averages, or support/resistance levels. Use it as part of a well-rounded trading approach to confirm setups — not to define them alone.

ZenAlgo - ADXThis open-source indicator builds upon the official Average Directional Index (ADX) implementation by TradingView. It preserves the core logic of the original ADX while introducing additional visualization features, configurability, and analytical overlays to assist with directional strength analysis.
Core Calculation
The script computes the ADX, +DI, and -DI based on smoothed directional movement and true range over a user-defined length. The smoothing is performed using Wilder’s method, as in the original implementation.
True Range is calculated from the current high, low, and previous close.
Directional Movement components (+DM, -DM) are derived by comparing the change in highs and lows between consecutive bars.
These values are then smoothed, and the +DI and -DI are expressed as percentages of the smoothed True Range.
The difference between +DI and -DI is normalized to derive DX, which is further smoothed to yield the ADX value.
The indicator includes a selectable signal line (SMA or EMA) applied to the ADX for crossover-based visualization.
Visualization Enhancements
Several plots and conditions have been added to improve interpretability:
Color-coded histograms and lines visualize DI relative to a configurable threshold (default: 25). Colors follow the ZenAlgo color scheme.
Dynamic opacity and gradient coloring are used for both ADX and DI components, allowing users to distinguish weak/moderate/strong directional trends visually.
Mirrored ADX is internally calculated for certain overlays but not directly plotted.
The script also provides small circles and diamonds to highlight:
Crossovers between ADX and its signal line.
DI crossing above or below the 25 threshold.
Rising ADX confirmed by rising DI values, with point size reflecting ADX strength.
Divergence Detection
The indicator includes optional detection of fractal-based divergences on the DI curve:
Regular and hidden bullish and bearish divergences are identified based on relative fractal highs/lows in both price and DI.
Detected divergences are optionally labeled with 'R' (Regular) or 'H' (Hidden), and color-coded accordingly.
Fractal points are defined using 5-bar patterns to ensure consistency and reduce false positives.
ADX/DI Table
When enabled, a floating table displays live values and summaries:
ADX value , trend direction (rising/falling), and qualitative strength.
DI composite , trend direction, and relative strength.
Contextual power dynamics , describing whether bulls or bears are gaining or losing strength.
The background colors of the table reflect current trend strength and direction.
Interpretation Guidelines
ADX indicates the strength of a trend, regardless of its direction. Values below 20 are often considered weak, while those above 40 suggest strong trending conditions.
+DI and -DI represent bullish and bearish directional movements, respectively. Crossovers between them are used to infer trend direction.
When ADX is rising and either +DI or -DI is dominant and increasing, the trend is likely strengthening.
Divergences between DI and price may suggest potential reversals but should be interpreted cautiously and not in isolation.
The threshold line (default 25) provides a basic filter for ignoring low-strength conditions. This can be adjusted depending on the market or timeframe.
Added Value over Existing Indicators
Fully color-graded ADX and DI display for better visual clarity.
Optional signal MA over ADX with crossover markers.
Rich contextual labeling for both divergence and threshold events.
Power dynamics commentary and live table help users contextualize current momentum.
Customizable options for smoothing type, divergence display, table position, and visual offsets.
These additions aim to improve situational awareness without altering the fundamental meaning of ADX/DI values.
Limitations and Disclaimers
As with any ADX-based tool, this indicator does not indicate market direction alone —it measures strength, not trend bias.
Divergence detection relies on fractal patterns and may lag or produce false positives in sideways markets.
Signal MA crossovers and DI threshold breaks are not entry signals , but contextual markers that may assist with timing or filtering other systems.
The table text and labels are for visual assistance and do not replace proper technical analysis or market context.

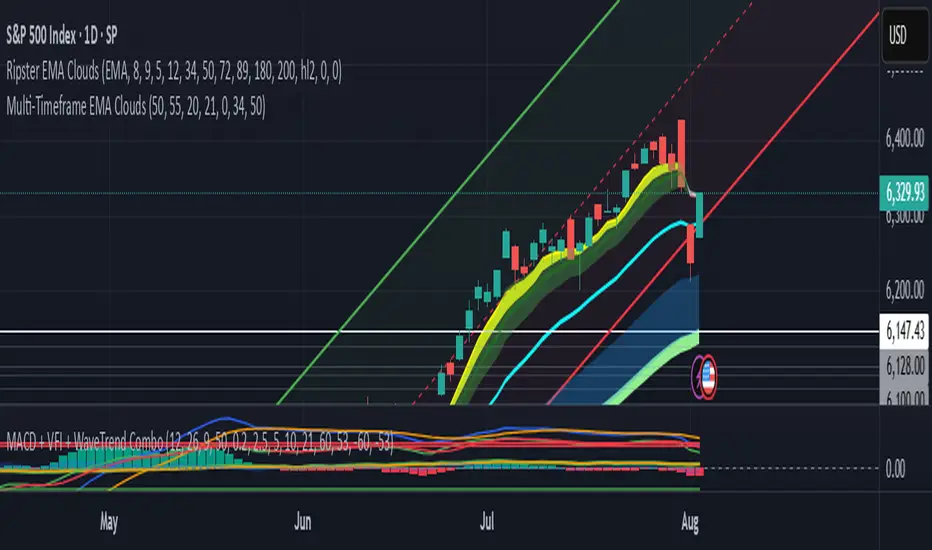
Divergence TridentA Combination of MACD + VFI + WaveTrend
Tradingview hates me and is making me explain this in greater detail so maybe this is enough????
Reversal Radar
**Reversal Radar - Multi-Indicator Confirmation System**
This script combines five proven technical analysis methods into a unified reversal signal, reducing false signals through multi-indicator confirmation.
**INDICATORS USED:**
1. ADX/Directional Movement System
Determines trend direction via +DI and -DI comparison. Signal only during downtrend condition (DI- > DI+). Filters out sideways markets.
2. Custom Linear Regression Momentum
Proprietary momentum calculation based on linear regression. Measures price deviation from Keltner Channel midline. Signal on negative but rising momentum (beginning trend reversal).
3. Williams VIX Fix (WVF)
Identifies panic-selling phases. Calculates relative distance to recent high. Signal when exceeding Bollinger Bands or historical percentiles.
4. RSI Oversold Filter
Default RSI < 35 (adjustable 30-40). Filters only oversold zones for reversal setups.
5. MACD Confirmation
Signal only when MACD below zero line and below signal line. Confirms ongoing weakness before potential reversal.
**FUNCTIONALITY:**
The system generates a BUY signal only when ALL activated filters are simultaneously met. Each indicator can be individually enabled/disabled. Flexible parameter adjustment for different markets/timeframes. Reduces false signals through multi-confirmation.
**APPLICATION:**
Suitable for swing trading on higher timeframes (4H, Daily), reversal strategies in oversold markets, and combination with additional confirmation indicators.
Setup: Activate desired filters, adjust parameters to market/timeframe, check BUY signal as entry opportunity. Additional confirmation through volume/support recommended.
**INNOVATION:**
The Custom Linear Regression Momentum is a proprietary development combining Keltner Channel logic with linear regression for more precise momentum detection than standard oscillators.
**DISCLAIMER:**
This tool serves as technical analysis support. No signal should be traded without additional confirmation and risk management.

Mayfair Reversal Change✅ Mayfair Reversal Change — By EastWave Capital
Description:
The Mayfair Reversal Change indicator is a tool designed to help traders identify potential market turning points using Stochastic Oscillator behavior and filtered price action logic. It acts as a reversal signal filter and is particularly effective when the market is overextended (overbought/oversold) and about to revert from exhaustion zones.
🔍 How It Works:
This script monitors the Stochastic %K and %D crossovers and adds a custom logic layer to filter only high-quality reversal points:
Stochastic Filter Conditions:
Uses smoothed stochastic settings:
%K smoothing = 3
%D smoothing = 3
Only shows signals after %K crosses back below 80 (for Sell) or above 20 (for Buy)
This prevents signals from appearing too early during an active overbought or oversold phase.
Directional Confirmation Logic:
Bullish signal is printed only when %K re-enters below 20 after a confirmed stochastic crossover.
Bearish signal appears only when %K re-enters above 80.
This reduces false signals that occur during continued trending moves.
Toggle Switch:
A user-toggle input is included to enable or disable the reversal filter logic.
This gives flexibility for traders who want to test signals with or without the stochastic condition.
📈 How to Use:
Timeframes: Recommended for 5M, 15M, and 30M
Markets: Compatible with any market — FX, Gold, Indices, Crypto
Entry Approach:
Wait for signal after price has reached a potential extreme area.
Confirm with chart structure, support/resistance, or SMC zone.
Enter on confirmation, placing stop loss beyond the swing high/low.
Combine with trendline breaks or price imbalances (FVG) for extra confluence.
Can be used in combination with the Mayfair FX Scalper script for dual-layer confirmation.
⚠️ Important Notes:
Signals are visual only and should be confirmed with proper strategy.
This indicator does not execute or manage trades automatically.
Designed to assist with reversal setups but should not be used in isolation.
Always manage risk, use SL/TP, and avoid over-leveraging.

Mayfair Fx Scalper✅ Mayfair FX Scalper — By EastWave Capital
The Mayfair FX Scalper is a precision-focused, closed-source indicator designed for short-term intraday trading, particularly scalping on lower timeframes such as 1-minute, 3-minute, and 5-minute charts. This tool is developed by EastWave Capital and is based on a combination of Relative Strength Index (RSI) extremes and specific candlestick structure patterns to detect potential exhaustion and reversal points in the market.
🔍 How It Works:
The algorithm operates by evaluating three core elements:
RSI Extremes:
RSI is calculated using default settings.
Buy signals are considered only when the RSI on the previous candle is below 22 (oversold), and the current candle is bullish, while the previous one was bearish.
Sell signals are considered when the RSI on the previous candle is above 78 (overbought), and the current candle is bearish, while the previous one was bullish.
Candle Confirmation Logic:
The system waits for candle confirmation (e.g., shift in bullish/bearish structure) rather than triggering signals based on RSI alone.
This avoids false triggers in strong trends and filters weak entries.
SL/TP Estimation (Visual):
While not automatically placing orders, the indicator can optionally display lines or small labels showing a Stop Loss at the previous swing high/low (±0.5) and TP levels at 1R, 2R, and 3R based on that stop.
These visual aids help traders plan risk/reward and exits manually.
📈 How to Use:
Timeframes: Best suited for 1M, 3M, and 5M charts
Markets: Works well on Gold (XAU/USD), Forex majors, Indices, and Crypto
Session: Performs best during high volatility sessions (London & NY)
Use Case:
Wait for a signal label to appear after a clear momentum move.
Confirm price action and trend context.
Use provided visual SL/TP labels or apply your manual RR planning.
Combine with structure breaks, FVG zones, or liquidity sweeps for confluence.
⚠️ Important Notes:
This indicator does not repaint.
No automatic trades are executed. Signals are visual.
Not intended for use in isolation; best when combined with proper trade management and confirmation tools.
Past performance does not guarantee future results. Always manage risk appropriately

Time-Decaying Percentile Oscillator [BackQuant]Time-Decaying Percentile Oscillator
1. Big-picture idea
Traditional percentile or stochastic oscillators treat every bar in the look-back window as equally important. That is fine when markets are slow, but if volatility regime changes quickly yesterday’s print should matter more than last month’s. The Time-Decaying Percentile Oscillator attempts to fix that blind spot by assigning an adjustable weight to every past price before it is ranked. The result is a percentile score that “breathes” with market tempo much faster to flag new extremes yet still smooth enough to ignore random noise.
2. What the script actually does
Build a weight curve
• You pick a look-back length (default 28 bars).
• You decide whether weights fall Linearly , Exponentially , by Power-law or Logarithmically .
• A decay factor (lower = faster fade) shapes how quickly the oldest price loses influence.
• The array is normalised so all weights still sum to 1.
Rank prices by weighted mass
• Every close in the window is paired with its weight.
• The pairs are sorted from low to high.
• The cumulative weight is walked until it equals your chosen percentile level (default 50 = median).
• That price becomes the Time-Decayed Percentile .
Find dispersion with robust statistics
• Instead of a fragile standard deviation the script measures weighted Median-Absolute-Deviation about the new percentile.
• You multiply that deviation by the Deviation Multiplier slider (default 1.0) to get a non-parametric volatility band.
Build an adaptive channel
• Upper band = percentile + (multiplier × deviation)
• Lower band = percentile – (multiplier × deviation)
Normalise into a 0-100 oscillator
• The current close is mapped inside that band:
0 = lower band, 50 = centre, 100 = upper band.
• If the channel squeezes, tiny moves still travel the full scale; if volatility explodes, it automatically widens.
Optional smoothing
• A second-stage moving average (EMA, SMA, DEMA, TEMA, etc.) tames the jitter.
• Length 22 EMA by default—change it to tune reaction speed.
Threshold logic
• Upper Threshold 70 and Lower Threshold 30 separate standard overbought/oversold states.
• Extreme bands 85 and 15 paint background heat when aggressive fade or breakout trades might trigger.
Divergence engine
• Looks back twenty bars.
• Flags Bullish divergence when price makes a lower low but oscillator refuses to confirm (value < 40).
• Flags Bearish divergence when price prints a higher high but oscillator stalls (value > 60).
3. Component walk-through
• Source – Any price series. Close by default, switch to typical price or custom OHLC4 for futures spreads.
• Look-back Period – How many bars to rank. Short = faster, long = slower.
• Base Percentile Level – 50 shows relative position around the median; set to 25 / 75 for quartile tracking or 90 / 10 for extreme tails.
• Deviation Multiplier – Higher values widen the dynamic channel, lowering whipsaw but delaying signals.
• Decay Settings
– Type decides the curve shape. Exponential (default 1.16) mimics EMA logic.
– Factor < 1 shrinks influence faster; > 1 spreads influence flatter.
– Toggle Enable Time Decay off to compare with classic equal-weight stochastic.
• Smoothing Block – Choose one of seven MA flavours plus length.
• Thresholds – Overbought / Oversold / Extreme levels. Push them out when working on very mean-reverting assets like FX; pull them in for trend monsters like crypto.
• Display toggles – Show or hide threshold lines, extreme filler zones, bar colouring, divergence labels.
• Colours – Bullish green, bearish red, neutral grey. Every gradient step is automatically blended to generate a heat map across the 0-100 range.
4. How to read the chart
• Oscillator creeping above 70 = market auctioning near the top of its adaptive range.
• Fast poke above 85 with no follow-through = exhaustion fade candidate.
• Slow grind that lives above 70 for many bars = valid bullish trend, not a fade.
• Cross back through 50 shows balance has shifted; treat it like a micro trend change.
• Divergence arrows add extra confidence when you already see two-bar reversal candles at range extremes.
• Background shading (semi-transparent red / green) warns of extreme states and throttles your position size.
5. Practical trading playbook
Mean-reversion scalps
1. Wait for oscillator to reach your desired OB/ OS levels
2. Check the slope of the smoothing MA—if it is flattening the squeeze is mature.
3. Look for a one- or two-bar reversal pattern.
4. Enter against the move; first target = midline 50, second target = opposite threshold.
5. Stop loss just beyond the extreme band.
Trend continuation pullbacks
1. Identify a clean directional trend on the price chart.
2. During the trend, TDP will oscillate between midline and extreme of that side.
3. Buy dips when oscillator hits OS levels, and the same for OB levels & shorting
4. Exit when oscillator re-tags the same-side extreme or prints divergence.
Volatility regime filter
• Use the Enable Time Decay switch as a regime test.
• If equal-weight oscillator and decayed oscillator diverge widely, market is entering a new volatility regime—tighten stops and trade smaller.
Divergence confirmation for other indicators
• Pair TDP divergence arrows with MACD histogram or RSI to filter false positives.
• The weighted nature means TDP often spots divergence a bar or two earlier than standard RSI.
Swing breakout strategy
1. During consolidation, band width compresses and oscillator oscillates around 50.
2. Watch for sudden expansion where oscillator blasts through extreme bands and stays pinned.
3. Enter with momentum in breakout direction; trail stop behind upper or lower band as it re-expands.
6. Customising decay mathematics
Linear – Each older bar loses the same fixed amount of influence. Intuitive and stable; good for slow swing charts.
Exponential – Influence halves every “decay factor” steps. Mirrors EMA thinking and is fastest to react.
Power-law – Mid-history bars keep more authority than exponential but oldest data still fades. Handy for commodities where seasonality matters.
Logarithmic – The gentlest curve; weight drops sharply at first then levels off. Mimics how traders remember dramatic moves for weeks but forget ordinary noise quickly.
Turn decay off to verify the tool’s added value; most users never switch back.
7. Alert catalogue
• TD Overbought / TD Oversold – Cross of regular thresholds.
• TD Extreme OB / OS – Breach of danger zones.
• TD Bullish / Bearish Divergence – High-probability reversal watch.
• TD Midline Cross – Momentum shift that often precedes a window where trend-following systems perform.
8. Visual hygiene tips
• If you already plot price on a dark background pick Bullish Color and Bearish Color default; change to pastel tones for light themes.
• Hide threshold lines after you memorise the zones to declutter scalping layouts.
• Overlay mode set to false so the oscillator lives in its own panel; keep height about 30 % of screen for best resolution.
9. Final notes
Time-Decaying Percentile Oscillator marries robust statistical ranking, adaptive dispersion and decay-aware weighting into a simple oscillator. It respects both recent order-flow shocks and historical context, offers granular control over responsiveness and ships with divergence and alert plumbing out of the box. Bolt it onto your price action framework, trend-following system or volatility mean-reversion playbook and see how much sooner it recognises genuine extremes compared to legacy oscillators.
Backtest thoroughly, experiment with decay curves on each asset class and remember: in trading, timing beats timidity but patience beats impulse. May this tool help you find that edge.

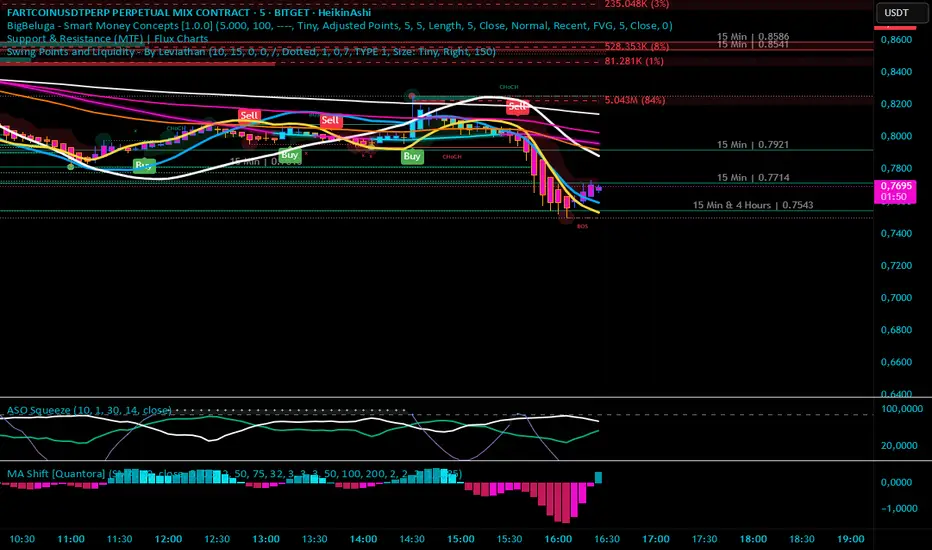
Moving Average Shift [Quantora]Title: Moving Average Shift
Description:
The Moving Average Shift is a dynamic technical analysis tool designed to help traders better visualize trend strength and direction using a combination of customizable moving averages and a volatility-adjusted oscillator.
🔧 Features:
Multi-Type Moving Average Selection
Choose from SMA, EMA, SMMA (RMA), WMA, and VWMA for your main signal line.
ZLSMA Trio
Three Zero-Lag Smoothed Moving Averages (ZLSMA) with adjustable lengths and colors provide a smoother trend-following structure without the delay of traditional MAs.
EMA Ribbon (50/100/200)
Add clarity to long-term trend direction with layered Exponential Moving Averages in key institutional periods.
Volatility-Adjusted Oscillator
A color-changing oscillator calculated from the normalized deviation between price and the selected MA. This helps identify trend shifts and momentum buildups.
Custom MA Line Widths and Styling
Full control over the width and appearance of all MA lines for visual clarity.
Bar & Candle Coloring
Bars and candles dynamically change color based on the relationship between price and the selected MA — helping you quickly assess bullish/bearish conditions.
📈 How It Helps:
Spot early trend shifts through the oscillator.
Confirm trades using the alignment between ZLSMAs and EMAs.
Quickly assess current trend conditions using color-coded price bars.
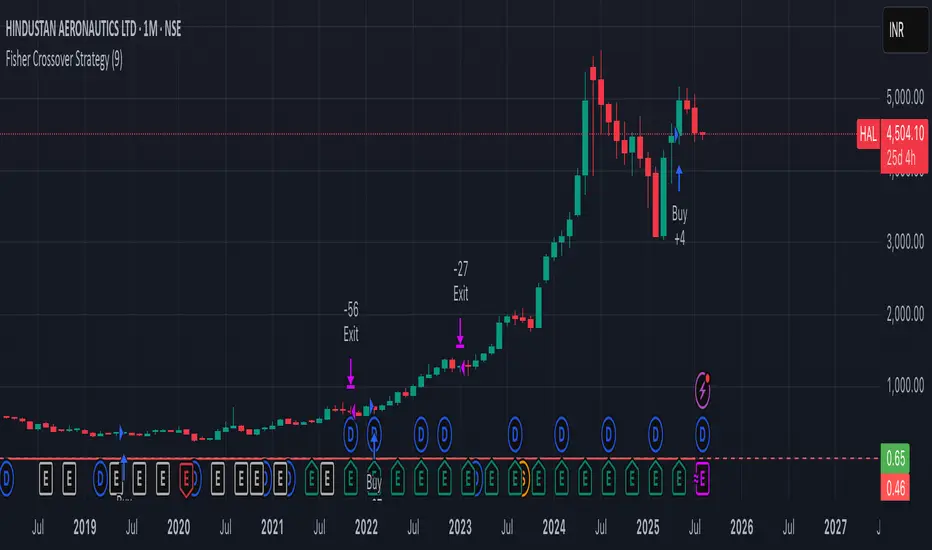
Fisher Crossover StrategyThe Fisher Crossover Strategy is a popular technical trading method that uses the Fisher Transform indicator developed by John Ehlers. This indicator mathematically converts price data into a normal Gaussian distribution, making market turning points sharper and easier to identify. The strategy is based on two lines: the Fisher line, which is the main transformed price value, and the Trigger line, which is a one-period lag of the Fisher line. Traders use the crossover of these lines to determine buy and sell opportunities.
A buy signal is generated when the Fisher line crosses above the Trigger line, indicating that bullish momentum may be starting, while a sell signal occurs when the Fisher line crosses below the Trigger line, suggesting a possible bearish reversal. Signals that occur relative to the zero line are often considered stronger; for example, a buy signal below the zero line may indicate a deeper market reversal. The strategy is simple to follow and can be applied to various markets including stocks, forex, commodities, and cryptocurrencies.
However, like all crossover strategies, it can produce false signals during sideways or ranging markets. To reduce whipsaws, traders often combine the Fisher Crossover Strategy with other tools such as support and resistance levels, volume analysis, or moving averages. Proper risk management with stop-loss and take-profit levels is also essential. Overall, the Fisher Crossover Strategy is valued for its clear entry and exit rules and its ability to highlight potential market reversals earlier than many other indicators.
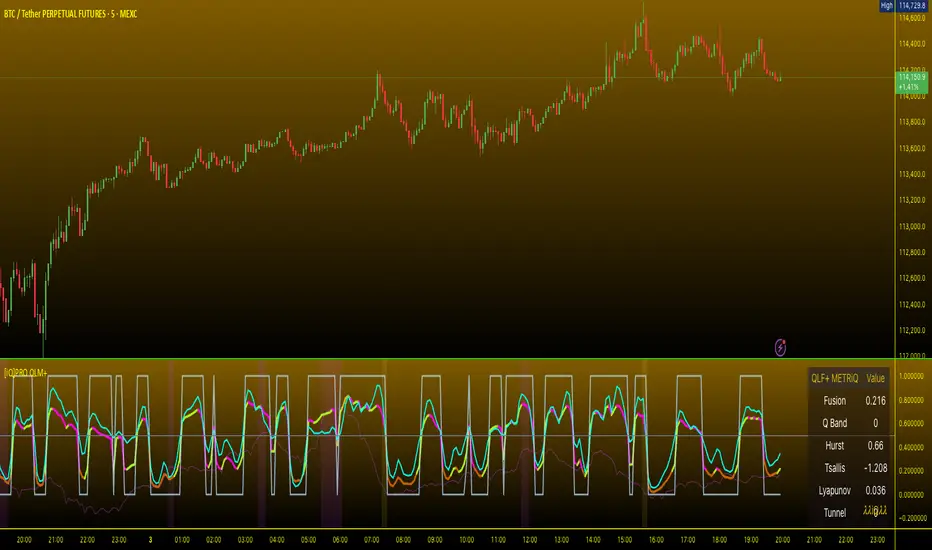
[iQ]PRO Quantum LagMan+ PRO Quantum LagMan+ (QLM+) — A Fusion Oscillator for Regime-Aware Entries
Overview
PRO Quantum LagMan+ is a next‑generation oscillator built for precision timing in dynamic markets. It blends advanced signal processing (multi-mode Laguerre smoothing) with physics-inspired analytics (Tsallis entropy, Hurst exponent, Lyapunov dynamics, and a tunneling probability model) to create a single fusion signal designed to adapt across regimes. The result is an actionable, regime-aware oscillator with adaptive thresholds, quantum energy band context, volatility gating, and optional trend filtering—complete with alerts, signal markers, and an information panel.
What it does
Normalizes momentum: Converts a Laguerre-based oscillator to a stable 0–1 scale for clear, cross-market comparability.
Maps “quantum” states: Assigns the oscillator to discrete energy bands to estimate state transitions and momentum intensity.
Fuses chaos and structure: Blends oscillator intensity, quantum momentum, and measured complexity/entropy into a single fusion line.
Filters by regime: Volatility and trend filters aim to suppress low-quality signals in quiet or unfavorable conditions.
Generates clean signals: Adaptive long/short thresholds with cooldown logic and coherence checks to reduce noise.
Explains itself: An info table displays fusion value, band index, entropy and chaos metrics, tunneling probability, and filter status.
Core components
Laguerre Multi-Mode Engine
Function: and1lag computes an ultimate smoother (ult), optional blended Laguerre filters, and a robust z-scored oscillator.
Control: period, lag, lagmode , RMSP add flexibility across timeframes and instruments.
Quantum Engine
Quantum Energy Levels: Discrete “bands” derived from normalized oscillator statistics.
Quantum Momentum: A 0–1 measure based on the current band position to capture intensity of state.
Coherence: Proximity between the oscillator and its active band (higher coherence = higher confidence).
Tunneling Probability: A barrier-like model that estimates the probability of a transition through local resistance/support structure.
Advanced Physics Layer (optional, heavy CPU)
Tsallis Entropy: A generalized entropy measure; elevated values can correspond to more complex or uncertain dynamics.
Lyapunov Exponent: A proxy for local sensitivity to initial conditions; higher values suggest chaotic/unstable behavior.
Hurst Exponent: A measure of persistence vs. mean reversion (H > 0.5 persistent, H < 0.5 mean-reverting).
These terms are summarized for trader context; the script uses bounded, practical implementations tuned for charting.
Fusion Oscillator
Composition: 50% normalized oscillator + 25% quantum momentum + 25% chaos/entropy blend.
Range: Constrained to for intuitive thresholds and consistent interpretation.
Regime Filters and Signals
Trend Filter: trendEMA with configurable trendLen to align signals with primary direction.
Volatility Filter: ATR-based gating with atrMultMin/atrMultMax bands, focusing on tradable volatility.
Adaptive Thresholds: Dynamic long/short thresholds scale with observed volatility.
Cooldown: signalCooldownBars limits rapid-fire signals to reduce whipsaw.
Alerts: Built-in alertcondition for automated notifications.
Visuals and UI
Main plots:
Fusion (thick, color-changing by state)
Norm Laguerre Osc (baseline momentum)
Quantum Momentum (band-based intensity)
Chaos Resonance (entropy/chaos contribution)
Bands and zones:
Quantum band visualization for context
Entropy zones via background shading (high/low extremes)
Info Table (showInfoTable):
Fusion, Quantum Band index, Hurst, Tsallis, Lyapunov, Tunneling Probability, Coherence, Volatility OK
Signal Markers:
Long: triangle up at bottoms
Short: triangle down at tops
Suggested usage
Entries:
Long bias when Fusion rises from low zones toward midline with high coherence, tunnel probability above threshold, trend filter positive, and volatility OK.
Short bias when Fusion falls from high zones with similar filter alignment and coherence.
Exits:
Consider scaling out near extremes (Fusion > 0.8 or < 0.2), during entropy spikes, or when coherence weakens.
Regime awareness:
Adjust trendLen for your timeframe.
Tighten atrMultMin to avoid low-vol chop.
Use adaptiveThresholds for cross-asset consistency.
Key inputs
Quantum Core: quantumLevels, planckConst, massDensity, tunnelThreshold
Advanced Physics: enableAdvanced, tsallisQ, lyapunovDim, entropyLength
Filters: useTrendFilter, trendLen, useVolFilter, atrLen, atrMultMin, atrMultMax
Signals: adaptiveThresholds, signalCooldownBars, showSignals
Display: showQuantumBands, showComponents, showEntropyZones, showInfoTable
Lag Options: source, period, lag, lagmode, RMSP
One glance clarity: A single Fusion line encapsulates momentum, state, and complexity.
Regime-adaptive: Thresholds and filters tune to volatility and trend.
Signal discipline: Coherence and cooldown aim to reduce false triggers.
Transparent context: The info table tells you why a signal is firing, not just that it is.
Notes and best practices
Multi-timeframe confirmation is recommended for higher-conviction entries.
The Advanced Physics layer can be CPU heavy; disable it for lightweight scanning or enable for precision.
Optimize inputs per asset class and timeframe (crypto vs FX vs equities).
This is an analytical tool, not financial advice. Always validate with risk management.
Alerts
Hybrid QLF Long: triggers on qualified long conditions
Hybrid QLF Short: triggers on qualified short conditions
Attribution and license
Pine Script code is licensed under the Mozilla Public License 2.0.
© MarketMakerIQ
Quick start
Add to chart and enable showInfoTable to understand live readings.
Start with defaults; toggle useTrendFilter and useVolFilter to match your style.
If performance allows, enable Advanced Physics and tune tsallisQ, lyapunovDim, entropyLength.
Set alerts on the included conditions and forward-test across sessions.
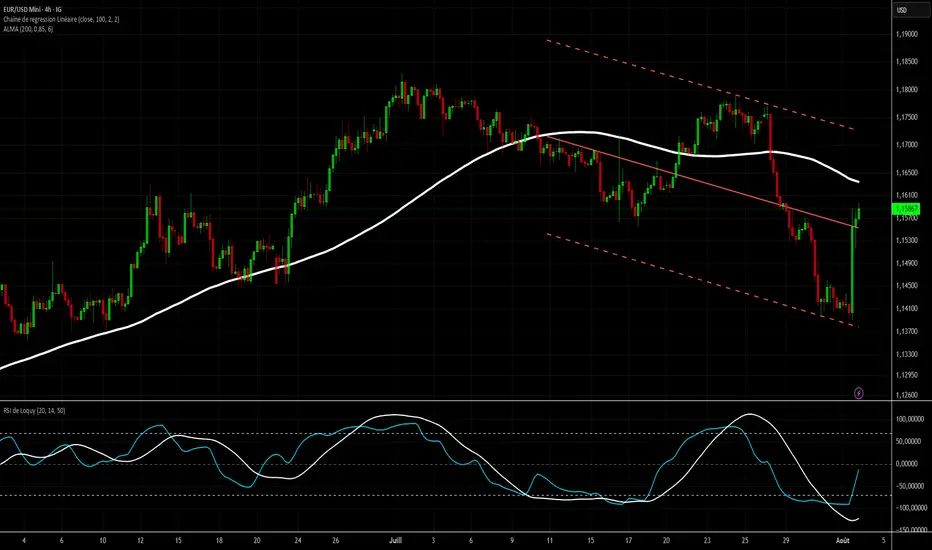
RSI de LoquyIndicator Description: RSI de Loquy
This custom indicator blends the power of the Relative Strength Index (RSI) with the Hull Moving Average (HMA), enhanced by a linear regression to reveal underlying momentum trends.
How It Works:
The RSI is calculated not on price directly, but on the HMA, offering a smoother and more responsive signal.
The RSI is remapped to a -100 to +100 scale for more intuitive reading:
+100 = extreme oversold
-100 = extreme overbought
A linear regression line is plotted over the rescaled RSI to highlight trend direction and strength.
Usage Tips:
Reversed overbought/oversold levels:
Above +70 = potential oversold condition
Below -70 = potential overbought condition
The white regression line helps confirm trend shifts or momentum continuation.
⚙️ Customizable Inputs:
HMA period
RSI length
Regression length