SMC Pro [Stansbooth]
🔮 SMC × Fibonacci Confluence Engine — The Hidden Algorithm of the Markets
Welcome to a level of chart analysis where mathematics , market psychology , and institutional logic merge into one ultra-intelligent system.
This indicator decodes the true structure of price delivery by combining Smart Money Concepts with the timeless precision of Fibonacci ratios , revealing what retail traders can’t see — *the algorithmic heartbeat of the market*.
✨ What Makes This Indicator Different
Instead of drawing random lines or reacting to late signals, this tool **anticipates** market behavior by reading the footprints left behind by institutional algorithms. Every element is placed with purpose — every zone, every shift, every fib level — all forming a seamless narrative that explains *why* price moves the way it does.
🔥 Core Intelligence Features
Advanced BOS/CHOCH Auto-Detection — Spot structure shifts before momentum even forms.
Institutional Liquidity Mapping
— Identify liquidity pools, engineered sweeps, equal highs/lows, and trap zones designed by smart money.
Fibonacci-Aligned Precision Zones
— Auto-generated fib grids synced with SMC levels for pinpoint reversal and continuation setups.
Imbalance Engine
— FVGs, displacement, inefficiencies, and mitigation blocks displayed with crystal clarity.
Premium/Discount Algorithm
— Understand instantly whether price is in a zone of accumulation or distribution.
🚀 Designed for Traders Who Want an Edge
Whether you're scalping fast moves, capturing intraday swings, or holding higher-timeframe plays, this indicator provides a professional lens into the market. It turns complex price action into a structured, predictable system where every move has logic and every entry has confluence.
You don’t just see the chart —
you see the intention behind every push, pull, manipulation, and reversal.
💎 Why It Feels Like a Cheat Code
Because it mirrors the way institutions analyze the market:
— Identify liquidity
— Seek equilibrium
— Deliver price
— Create inefficiency
— Mitigate
— Continue the narrative
Using SMC and Fibonacci together unlocks the “algorithmic geometry” behind price movement, giving you clarity where others see chaos.
⚡ Trade With Confidence, Confluence & Control
This indicator isn’t just a tool.
It’s a complete trading framework — structured, intelligent, and deadly accurate.
Master the markets.
Decode the algorithm.
Trade like smart money .
Marketanalysis

Net Positions (Net Longs & Net Shorts) - Volume AdjustedNet Positions (Net Longs & Net Shorts) - Volume Adjusted
Based on the legendary LeviathanCapital - Net Positions Indicator
Adjusted to use volume calculation for more percise data
Few important caveats:
- EVERY BUYER NEED A SELLER AND EVERY SELLER NEED A BUYER
- This indicator is meant to give you a sense of direction for the market orders ("who is the aggresive side") and should be used as confluence not as true values
In reality, in market movement each candle will contain both buying and selling, contracts closing and opening but due to some limitations that is hard to make properly.
Even with these limitations this indicator can provide a better picture than some other even external tools out there.
The main benefit of using volume delta and open interest instead of just open interest and candle closes G/R that it solves the problem with extreme cases where there might be an absorption of market orders.
Example of the Volume Edge in Action:
Bullish Absorption (The "Trap" for Sellers)
Candle Close + OI: A large Red Candle forms with Rising OI. The interpretation is simply: "New shorts are opening"
Volume Delta + OI: The same Red Candle with Rising OI has a Positive Volume Delta.
The True Story: Aggressive buyers tried to push the price up, but they were completely absorbed by large passive sell orders.
The "Volume Delta" logic:
If OI ↑ → new positions opened
• Delta ↑ → net longs added
• Delta ↓ → net shorts added
If OI ↓ → positions closed
• Delta ↑ → shorts closing
• Delta ↓ → longs closing
The "Price" logic:
If OI ↑ → new positions opened
• Price ↑ → net longs added
• Price ↓ → net shorts added
If OI ↓ → positions closed
• Price ↑ → shorts closing
• Price ↓ → longs closing

Pristine Market Analysis DashboardThe Pristine Market Analysis indicator enables users to perform comprehensive top-down analysis of global risk assets in a fraction of the time! 🏆
Top-down analysis is important because the overall market environment has a significant impact on the success of individual trading setups.
💠 Market Analysis Insights
▪ Identify if money is flowing into equities, or equity alternatives like bonds,gold,and bitcoin
▪ Perform relative strength analysis of US vs International equities
▪ Identify rotation into risk-on or risk-off assets to determine overall market health
▪ Detect leading sectors to enable targeted stock screening, or to trade the ETFs themselves
💠 Market Analysis Metrics to Improve Your Situational Awareness!
▪ %Δ - 1-day percent change
▪ ATR Δ - 1-day percent change/ ATR %
▪ DCR - Daily closing range
▪ 52WR - Measures where a security is trading in relation to it’s 52wk high and 52wk low
▪ MAx - Measures how extended price is from a key moving average of your choosing in ATR% multiple terms
▪ ST ↑↓ (Short- Term Stage) - Measures the short-term trend using key moving averages of your choosing
▪ LT ↑↓ (Long-Term Stage) - Measures the long-term trend using key moving averages of your choosing
The indicator automatically sorts from greatest to least based on the %Δ column 👇
What is ATR?
The average true range (ATR) is a technical analysis indicator introduced by market technician J. Welles Wilder Jr. in his book New Concepts in Technical Trading Systems that measures security volatility by decomposing the entire range of an asset price for a time period.
Why do we use it?
Because converting price moves into ATR terms better contextualizes them relative to the asset's historical volatility!
Example: If the ATR is $2.50, it means the average price range each day is roughly $2.50.
We use an ATR length of 20 days in our calculation, and convert the 20D ATR into a 20D ATR %. The formula for ATR % is as follows:
ATR % = (ATR/Current Price) * 100
Why does MAx matter?
MAx measures the number of ATR % multiples a security is trading away from a key moving average.The default moving average length is 50 days.
MAx can be used to identify mean reversion trades . When a security trends strongly in one direction and moves significantly above or below its moving average, the price often tends to revert back toward the average.
Example, if the ATR % of the security is 5%, and the stock is trading 50% higher than the 50D SMA, the MAx would be 50%/5% = 10. A user might opt to take a countertrend trade when the MAx exceeds a predetermined level.
The MAx can also be useful when trading breakouts above or below the key moving average of your choosing. The lower the MAx, the tighter stop loss one can take if trading against that level.
Identifying an extreme price extension using MAx 👇
Price mean reverted immediately following the high MAx 👇
Why does 52WR matter?
Historical analysis conducted by market legends like William O’Neill and Mark Minervini indicates that stocks trading at or near 52wk highs tend to outperform over time, and vice versa for stocks trading close to 52wk lows. Avoiding stocks trading with a low 52WR metric can help traders avoid buying stocks in downtrends. Likewise, focusing on stocks trading with a high 52WR provides a technical edge.
💠 Stage Analysis Guide
Short-term and long-term stage analysis data is provided in the two rightmost columns of each table. The columns are labeled ST ⇅ and LT ⇅.
Why is Stage Analysis important? Popularized by Stan Weinstein, stage analysis is a trend following system that classifies assets into four stages based on price-trend analysis.
The problem? The interpretation of stage analysis is highly subjective. Based on the methodology provided in Stan Weinstein’s books, five different traders could look at the same chart, and come to different conclusions as to which stage the security is in!
We solved for this by creating our own methodology for classifying stocks into stages using moving averages. This indicator automates that analysis, and produces short-term and long-term trend signals based on user-defined key moving averages. You won’t find this in any textbook or course, because it’s completely unique to the Pristine trading methodology.
Our indicator calculates a short-term trend signal using two moving averages; a fast moving average, and a slow moving average. We default to the 10D EMA as the fast moving average & the 20D SMA as the slow moving average. A trend signal is generated based on where price is currently trading with respect to the fast moving average and the slow moving average. We use the signal to guide shorter-term swing trades.
In general, we want to take long trades in stocks with strengthening trends, and short trades in stocks with weakening trends. The user is free to change the moving averages based on their own short-term timeframe. Every trader is unique!
The same process is applied to calculate the long-term trend signal. We default to the 50D SMA as our fast moving average, and the 200D SMA as the slow moving average for the LT ⇅ signal calculation, but users can change these to fit their own unique trading style.
What is Stage 1?
Stage 1 identifies stocks that transitioned from downtrends, into bottoming bases.
Stage 1A - Bottom Signal: Marks the first day a security shows initial signs of recovery after a downtrend, with early indications of strength emerging.👇
Stage 1B - Bottoming Process: Identifies the ongoing phase where the security continues to stabilize and strengthen, confirming the base-building process after the initial signal.👇
Stage 1R - Failed Uptrend: Detects when a security that had entered an early uptrend loses momentum and slips back into a bottoming phase, signaling a failed breakout.👇
What is Stage 2?
Stage 2 identifies stocks that transitioned from bottoming bases to uptrends.
Stage 2A - Breakout: Marks the first day a security decisively breaks out, signaling the start of a new uptrend.👇
Stage 2B - Uptrend: Identifies when the security continues to trade in an established uptrend following the initial breakout, with momentum building but not yet showing full strength.👇
Stage 2C - Strong Uptrend: Detects when the uptrend strengthens further, with the security displaying clear signs of accelerating strength and buying pressure.👇
Stage 2R - Failed Breakdown: Detects when a security that had recently entered a corrective phase reverses course and reclaims its upward trajectory, moving back into an uptrend.👇
What is Stage 3?
Stage 3 identifies stocks that transitioned from uptrends to topping bases.
Stage 3A - Top Signal: Marks the first day a security shows initial signs of weakness after an uptrend, indicating the start of a potential topping phase.👇
Stage 3B - Topping Process: Identifies the period following the initial signal when the security continues to show signs of distribution and potential trend exhaustion.👇
Stage 3R - Failed Breakdown: Detects when a security that had entered a deeper corrective phase reverses upward, recovering enough strength to re-enter the topping phase.👇
What is Stage 4?
Stage 4 identifies stocks that transitioned from topping bases to downtrends.
Stage 4A - Breakdown: Marks the first day a security decisively breaks below key support levels, signaling the start of a new downward trend.👇
Stage 4B - Downtrend: Identifies when the security continues to trend lower following the initial breakdown, with sustained bearish momentum, though not yet fully entrenched.👇
Stage 4C - Strong Downtrend: Detects when the downtrend intensifies, with the security displaying clear signs of accelerating weakness and selling pressure.👇
Stage 4R - Failed Bottom: Detects when a security that had begun to show early signs of bottoming reverses course and resumes its decline, falling back into a downtrend.👇
Stage N/A - Recent IPO: Applies to stocks that recently IPO’ed and don’t have enough data to calculate all necessary moving averages.
💠 Historical Analysis
Users can leverage the Replay feature in TradingView to perform historical analysis and see how the overall configuration of global risk assets looked at key turning points in the market!
To perform historical analysis:
1) Show the chart if previously hidden (see Tips and Tricks).
2) Click the Replay button on the toolbar at the top of the chart.
3) Use the slider on the chart to select the bar to begin the analysis.
💠 Comprehensive Tooltips
Hover over header labels to get detailed information about the data and relevant calculations.
For stage analysis (Short Term and Long Term), the tooltips provide a complete key of all the relevant stages.
💠 Settings and Preferences
▪ Customize this script by setting preferred colors and thresholds.
▪ There are two tables that can be customized, one on each side of the chart. For each table you can configure the location and show/hide each table. You can also specify colors for header and row data, including your preferred text size.
▪ You can customize the moving averages that are used in stage analysis. Specify your preferred fast and slow moving averages for both short-term and long-term analysis.
▪ For the ATR extension, the default moving average is 50D SMA. You can choose the length and type (SMA or EMA) to align with your trading preferences.
💠 Tips and Tricks
▪ Hide/Show Chart:
To provide a clean backdrop for the tables, it can be helpful to hide the chart. Hover your mouse over the symbol information in the upper right. Select the "..." option and choose "Hide" option. Choose the option "Show" to see the chart details if hidden.
▪ Futures Outside Regular Trading Hours (RTH):
In order for the data in the “%Δ” column of the the “Equity Alternatives” table to populate correctly when outside of regular trading hours, you must have your chart displaying a futures contract. Examples: ES, NQ, RTY, GC.

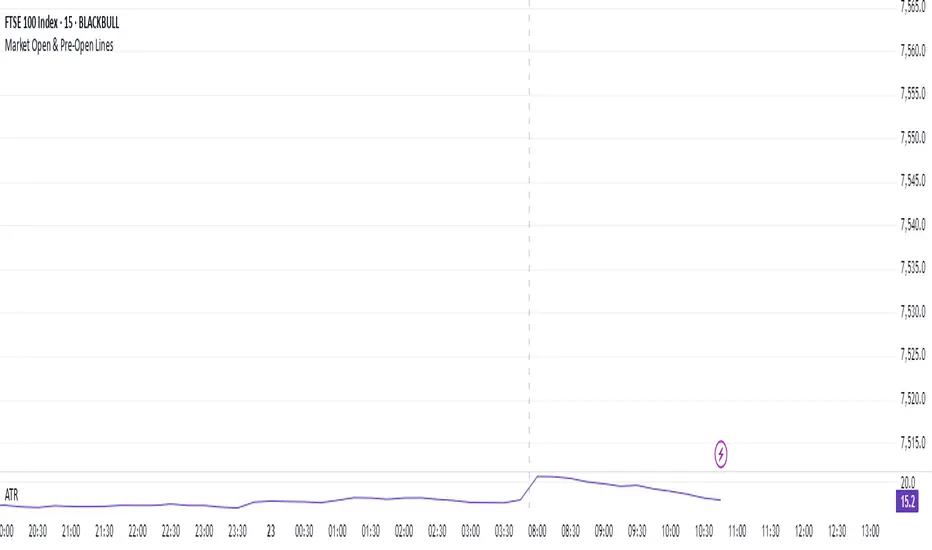
Market Open & Pre-Open Linesversion 1.0 2025-04-23
Stated vertical line for market open and pre-market open. Market option include US, EU, UK, JP and AU. This line do auto-defined during daylight saving time. This help for those trade during market open and benefit for those doing backtest on it.
Market Session Boxes with Volume Delta [algo_aakash]This script highlights four key forex trading sessions — Tokyo, London, New York, and Sydney — by drawing color-coded boxes directly on the chart. For each session, it shows:
High and low of the session
Total volume traded
Volume delta (bullish vs bearish pressure)
Optional extension of session highs/lows into future candles
Cleanly labeled time range and stats
Users can:
Select which sessions to display
Customize session times (in UTC+0)
Choose colors per session
Toggle session labels and extension lines
Use Case: Designed to help intraday and short-term traders visualize market rhythm, liquidity zones, and session-based volatility. The volume delta metric adds an extra layer of sentiment analysis.
This tool works best on intraday timeframes like 15m, 30m, or 1H.
Disclaimer:
This indicator is for educational and visual analysis purposes. It does not constitute trading advice or guarantee results. Always conduct your own analysis before making trading decisions.

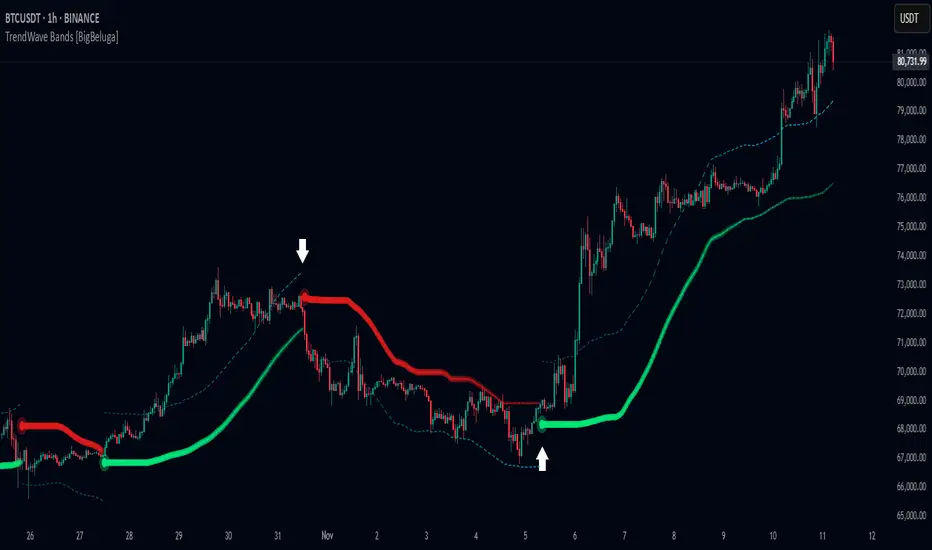
TrendWave Bands [BigBeluga]This is a trend-following indicator that dynamically adapts to market trends using upper and lower bands. It visually highlights trend strength and duration through color intensity while providing additional wave bands for deeper trend analysis.
🔵Key Features:
Adaptive Trend Bands:
➣ Displays a lower band in uptrends and an upper band in downtrends to indicate trend direction.
➣ The bands act as dynamic support and resistance levels, helping traders identify potential entry and exit points.
Wave Bands for Additional Analysis:
➣ A dashed wave band appears opposite the main trend band for deeper trend confirmation.
➣ In an uptrend, the upper dashed wave band helps analyze momentum, while in a downtrend, the lower dashed wave band serves the same purpose.
Gradient Color Intensity:
➣ The trend bands have a color gradient that fades as the trend continues, helping traders visualize trend duration.
➣ The wave bands have an inverse gradient effect—starting with low intensity at the trend's beginning and increasing in intensity as the trend progresses.
Trend Change Signals:
➣ Circular markers appear at trend reversals, providing clear entry and exit points.
➣ These signals mark transitions between bullish and bearish phases based on price action.
🔵Usage:
Trend Following: Use the lower band for confirmation in uptrends and the upper band in downtrends to stay on the right side of the market.
Trend Duration Analysis: Gradient wavebands give an idea of the duration of the current trend — new trends will have high-intensity colored wavebands and as time goes on, trends will fade.
Trend Reversal Detection: Circular markers highlight trend shifts, making it easier to spot entry and exit opportunities.
Volatility Awareness: Volatility-based bands help traders adjust their strategies based on market volatility, ensuring better risk management.
TrendWave Bands is a powerful tool for traders seeking to follow market trends with enhanced visual clarity. By combining trend bands, wave bands, and gradient-based color scaling, it provides a detailed view of market dynamics and trend evolution.
Volume Profile & Smart Money Explorer🔍 Volume Profile & Smart Money Explorer: Decode Institutional Footprints
Master the art of institutional trading with this sophisticated volume analysis tool. Track smart money movements, identify peak liquidity windows, and align your trades with major market participants.
🌟 Key Features:
📊 Triple-Layer Volume Analysis
• Total Volume Patterns
• Directional Volume Split (Up/Down)
• Institutional Flow Detection
• Real-time Smart Money Tracking
• Historical Pattern Recognition
⚡ Smart Money Detection
• Institutional Trade Identification
• Large Block Order Tracking
• Smart Money Concentration Periods
• Whale Activity Alerts
• Volume Threshold Analysis
📈 Advanced Profiling
• Hourly Volume Distribution
• Directional Bias Analysis
• Liquidity Heat Maps
• Volume Pattern Recognition
• Custom Threshold Settings
🎯 Strategic Applications:
Institutional Trading:
• Track Big Player Movements
• Identify Accumulation/Distribution
• Follow Smart Money Flow
• Detect Institutional Trading Windows
• Monitor Block Orders
Risk Management:
• Identify High Liquidity Windows
• Avoid Thin Market Periods
• Optimize Position Sizing
• Track Market Participation
• Monitor Volume Quality
Market Analysis:
• Volume Pattern Recognition
• Smart Money Flow Analysis
• Liquidity Window Identification
• Institutional Activity Cycles
• Market Depth Analysis
💡 Perfect For:
• Professional Traders
• Volume Profile Traders
• Institutional Traders
• Risk Managers
• Algorithmic Traders
• Smart Money Followers
• Day Traders
• Swing Traders
📊 Key Metrics:
• Normalized Volume Profiles
• Institutional Thresholds
• Directional Volume Split
• Smart Money Concentration
• Historical Patterns
• Real-time Analysis
⚡ Trading Edge:
• Trade with Institution Flow
• Identify Optimal Entry Points
• Recognize Distribution Patterns
• Follow Smart Money Positioning
• Avoid Thin Markets
• Capitalize on Peak Liquidity
🎓 Educational Value:
• Understand Market Structure
• Learn Volume Analysis
• Master Institutional Patterns
• Develop Market Intuition
• Track Smart Money Flow
🛠️ Customization:
• Adjustable Time Windows
• Flexible Volume Thresholds
• Multiple Timeframe Analysis
• Custom Alert Settings
• Visual Preference Options
Whether you're tracking institutional flows in crypto markets or following smart money in traditional markets, the Volume Profile & Smart Money Explorer provides the deep insights needed to trade alongside the biggest players.
Transform your trading from retail guesswork to institutional precision. Know exactly when and where smart money moves, and position yourself ahead of major market shifts.
#VolumeProfile #SmartMoney #InstitutionalTrading #MarketAnalysis #TradingView #VolumeAnalysis #CryptoTrading #ForexTrading #TechnicalAnalysis #Trading #PriceAction #MarketStructure #OrderFlow #Liquidity #RiskManagement #TradingStrategy #DayTrading #SwingTrading #AlgoTrading #QuantitativeTrading

Relative Volume Index [PhenLabs]Relative Volume Index (RVI)
Version: PineScript™ v6
Description
The Relative Volume Index (RVI) is a sophisticated volume analysis indicator that compares real-time trading volume against historical averages for specific time periods. By analyzing volume patterns and statistical deviations, it helps traders identify unusual market activity and potential trading opportunities. The indicator uses dynamic color visualization and statistical overlays to provide clear, actionable volume analysis.
Components
• Volume Comparison: Real-time volume relative to historical averages
• Statistical Bands: Upper and lower deviation bands showing volume volatility
• Moving Average Line: Smoothed trend of relative volume
• Color Gradient Display: Visual representation of volume strength
• Statistics Dashboard: Real-time metrics and calculations
Usage Guidelines
Volume Strength Analysis:
• Values > 1.0 indicate above-average volume
• Values < 1.0 indicate below-average volume
• Watch for readings above the threshold (default 6.5x) for exceptional volume
Trading Signals:
• Strong volume confirms price moves
• Divergences between price and volume suggest potential reversals
• Use extreme readings as potential reversal signals
Optimal Settings:
• Start with default 15-bar lookback for general analysis
• Adjust threshold (6.5x) based on market volatility
• Use with multiple timeframes for confirmation
Best Practices:
• Combine with price action and other indicators
• Monitor deviation bands for volatility expansion
• Use the statistics panel for precise readings
• Pay attention to color gradients for quick assessment
Limitations
• Requires quality volume data for accurate calculations
• May produce false signals during pre/post market hours
• Historical comparisons may be skewed during unusual market conditions
• Best suited for liquid markets with consistent volume patterns
Note: For optimal results, use in conjunction with price action analysis and other technical indicators. The indicator performs best during regular market hours on liquid instruments.

XAUMOvisionXAUMOvision: T he XAU/USD Composite Correlation Indicator with Weighted Spillover & Dynamic Lines
XAUMOvision is a custom-built trading indicator designed to track the intricate relationship between XAU/USD (Gold) and key economic factors: DXY (US Dollar Index), US Treasury Yields, S&P 500, and Crude Oil. By blending correlation metrics with weighted spillover effects, XAUMOvision offers actionable insights to refine your Gold trading strategy.
Core Features of XAUMOvision
1. Correlation (CC)
Definition: Measures how closely two assets move together over a given period.
Calculation: Pearson Correlation is used to assess Gold's relationship with:
DXY: Negative correlation—when DXY rises, Gold typically falls.
US Treasury Yields: Negative correlation—higher yields reduce Gold’s appeal.
S&P 500: Opposite movement, as Gold acts as a safe-haven.
Crude Oil: Positive correlation—both often rise during inflationary pressures.
2. Weighted Spillover
What It Does: Quantifies how movements in each asset (DXY, Yields, etc.) influence Gold.
Weighting: User-defined values (e.g., DXY weight = 0.4) scale each factor’s impact.
Result: A total spillover score reveals bullish or bearish sentiment for XAU/USD.
3. Composite Bias Line
Purpose: Consolidates spillover impacts into a single sentiment indicator.
Readings:
Strong Bullish: Composite Bias > 0.5.
Neutral: Close to 0.
Strong Bearish: Composite Bias < -0.5.
Output: A directional bias to guide your trading decisions.
4. Traffic Signal Line
Visual Cues:
Green: Strong Bullish Signal.
Red: Strong Bearish Signal.
Gray: Neutral—avoid trading.
Utility: A quick, color-coded overview of market conditions.
Using XAUMOvision Effectively
When to Use
During high volatility or major news events (e.g., CPI, interest rate decisions).
To understand macroeconomic forces driving Gold’s price action.
Recommended Timeframes
4-Hour: Ideal for swing traders seeking medium-term setups.
Daily: Perfect for macro trend analysis.
Weekly: Suitable for long-term investors aligning with broader trends.
---------------------------------------------------------------------------------
Practical Example
Monday, January 13, 2025 (Neutral Market)
Market Behavior: Gold stagnated (-0.96%), with low volume (681.13K).
Indicator Insights:
Composite Spillover: -0.92 (mild bearish pressure).
Traffic Signal Line: Gray—stay out of the market.
Bias Line: Weak Bearish (-1), signaling no strong trend.
Result: XAUMOvision kept traders from entering a choppy, low-volume market.
Wednesday, January 15, 2025 (CPI-Driven Rally)
CPI Release: Core CPI softer than expected (0.2% vs. 0.3%), weakening the DXY and Yields. Gold surged.
Indicator Insights:
Composite Spillover: +0.57 (strong bullish sentiment).
Traffic Signal Line: Green—clear buy signal.
Bias Line: Strong Bullish (+2), confirming the trend.
Result: Traders aligned with institutional flows and profited from the CPI-driven rally.
--------------------------------------------------------------------------------
Why XAUMOvision Stands Out
Avoids Bad Trades: Neutral signals and low-volume days keep you sidelined during indecisive markets.
Pinpoints Big Moves: Green signals during high-impact events help you capitalize on major trends.
Volume Validation: Confirms institutional activity to distinguish real trends from fakeouts.
Conclusion: Trade Like a Pro
XAUMOvision blends macroeconomic analysis with real-time technical indicators, ensuring you stay ahead of market moves. Whether navigating neutral markets or CPI-driven surges, this tool provides clarity and confidence in your trading decisions. For swing traders and macro enthusiasts, XAUMOvision is the ultimate weapon in Gold trading.

ADR (Log Scale) with MTF LabelsHere's a detailed presentation of the Average Daily Range (ADR) indicator, with a focus on its advantages compared to the classic ADR, its unique features, utility, and interpretation:
Advantages Compared to Classic ADR
1. Logarithmic Scale: Unlike the classic ADR, which uses a linear scale, this version uses a logarithmic scale for calculations. This approach provides a more accurate representation of relative price movements, especially for assets with large price ranges.
2. Multi-Timeframe Analysis: This enhanced ADR indicator allows traders to view daily, weekly, and monthly ADRs simultaneously. This multi-timeframe capability helps traders understand volatility trends over different periods, offering a more comprehensive market analysis.
3. Optional Smoothing: The inclusion of an optional smoothing feature (using Exponential Moving Average, EMA) helps reduce noise in the data. This makes the indicator more reliable by filtering out short-term fluctuations and highlighting the underlying volatility trend.
4. Information Display Labels: The indicator includes labels that display precise ADR values for each timeframe directly on the chart. This feature provides immediate, clear insights without requiring additional calculations or references.
Utility of the Indicator
1. Volatility Analysis: The ADR indicator is essential for assessing market volatility. By showing the average daily price range, it helps traders gauge how much an asset typically moves within a day, week, or month.
2. Risk Management: ADR levels can be used to set stop-loss points, improving risk management strategies. Knowing the average range helps traders avoid setting stops too close to the current price, which might otherwise be triggered by normal market fluctuations.
3. Setting Realistic Targets: By understanding the average daily range, traders can set more realistic profit targets. This helps in avoiding over-ambitious goals that are unlikely to be reached within the typical market movement.
4. Identifying Entry and Exit Points: The ADR can signal potential entry and exit points. For example, if the price approaches the upper or lower ADR boundary, it might indicate an overbought or oversold condition, respectively.
Interpretation and Examples
1. Increasing Volatility: If the ADR is increasing, it indicates rising market volatility. Traders might adjust their strategies accordingly, such as widening their stop-losses to accommodate larger price swings.
2. Range Breakout: If the price significantly exceeds the daily ADR, it may signal a strong trend or exceptional market movement. Traders can use this information to stay in the trade longer or to anticipate a potential reversal.
3. Mean Reversion: Prices often revert to the ADR mean. A trader might consider mean reversion trades when the price approaches the extremes of the ADR range, expecting it to move back towards the average.
4. Multi-Timeframe Comparison: If the daily ADR is higher than the weekly ADR, it may indicate unusually high short-term volatility. This can be a signal for traders to be cautious or to capitalize on the increased movement.
While the ADR indicator provides valuable insights into market volatility and can significantly enhance trading strategies, it is essential to remember that no indicator is foolproof. Market conditions can change rapidly, and past performance is not always indicative of future results. Traders should use the ADR indicator in conjunction with other tools and follow sound risk management practices to protect their capital.

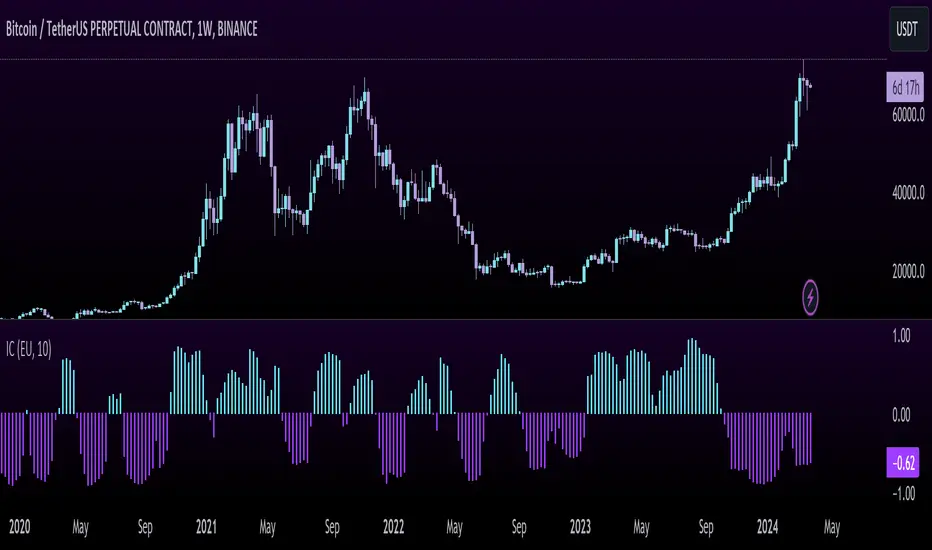
Inflation CorrelationHeyo fellas,
In today’s dynamic economic landscape, understanding the relationship of market prices to other economical factors like inflation rate is crucial. The Inflation Correlation Indicator is designed to provide traders with a clear visualization of this relationship. By correlating average inflation rates from selected countries with market closing prices, this indicator offers a unique perspective on potential market movements influenced by inflationary trends.
Features:
Country Selection: Choose from the European Union (EU), Germany (DE), or the United States (US) to tailor the correlation analysis to your specific market interest.
Correlation Length Customization: Adjust the correlation length to refine the sensitivity of the indicator to recent inflation data.
Visual Clarity: The correlation histogram changes color based on the direction of the correlation, providing an intuitive understanding of the inflation correlation.
Whether you’re a fundamental analyst seeking to incorporate macroeconomic indicators into your strategy or a trader looking for an edge in inflation-sensitive markets, the Inflation Correlation Indicator is an indispensable tool in your TradingView arsenal.
Thanks for checking this out!
Best regards,
simwai
Market Performance TableThe Market Performance Table displays the performance of multiple tickers (up to 5) in a table format. The tickers can be customized by selecting them through the indicator settings.
The indicator calculates various metrics for each ticker, including the 1-day change percentage, whether the price is above the 50, 20, and 10-day simple moving averages (SMA), as well as the relative strength compared to the 10/20 SMA and 20/50 SMA crossovers. It also calculates the price deviation from the 50-day SMA.
The table is displayed on the chart and can be positioned in different locations.
Credits for the idea to @Alex_PrimeTrading ;)

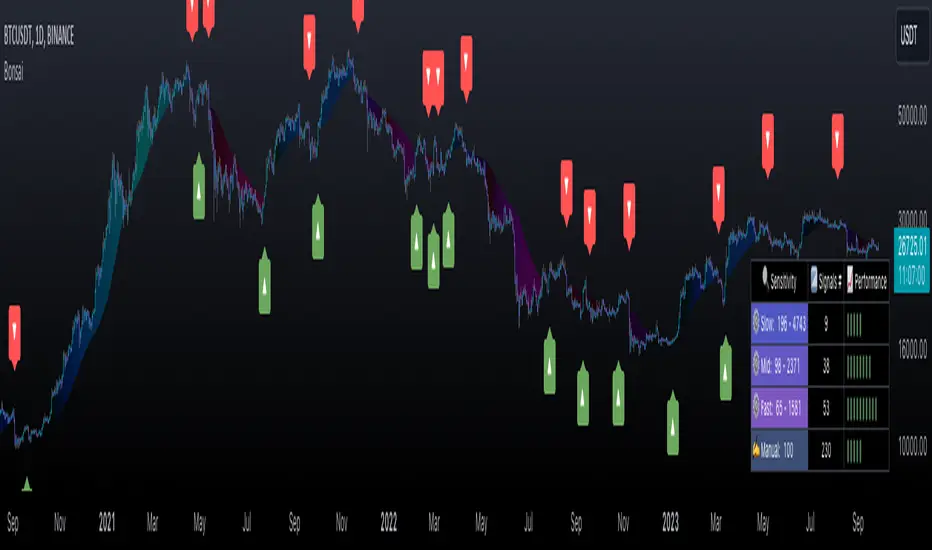
BonsaiBonsai is a tailored tech analysis tool for all traders. It uses dynamic thresholds, sensitivity modes, and averaging to identify market trends. Its scoring system, visual cues, and alerts offer an intuitive trading journey.
═════════════════════════════════════════════════════════════════════════
🌳 Bonsai 🌳 Trend Analysis Indicator
📘 Overview
Bonsai is designed to aid traders in recognizing market trends, utilizing sensitivity as its pivotal component.
📌 Script Logic
• Threshold-Based Trends: Bonsai sets dynamic thresholds based on market deviations from previous highs or lows to identify trend reversals.
• Signal Generation: After ascertaining the trend direction, Bonsai provides buy/sell signals from trend crossovers and crossunders.
• Returns & Scoring: Each signal's potential returns are calculated, considering asset-specific trading fees. A scoring system (1-10) is introduced for traders to evaluate potential profitability quickly.
• Auto-Threshold: Threshold adjustments are made depending on the selected sensitivity mode, optimizing adaptability.
• Visual Indicators: Bonsai visualizes potential market highs and lows through trend lines. Colors differentiate between bullish and bearish market sentiments.
• Trend Line Enhancement with ALMA : Bonsai integrates the Arnaud Legoux Moving Average (ALMA), aiming to refine trend line representation. ALMA may reduce noise, providing a smoother trend line, which might be useful during volatile market conditions. This can potentially lead to improved trend forecasts with fewer fakeouts.
🎯 Purpose
• For Experienced Traders: Bonsai complements professional analysis with its data-driven insights, catering to diverse trading strategies.
• For Newcomers: Serving as an entry to technical analysis, Bonsai's intuitive design and streamlined settings are beginner-friendly.
🛠 Key Elements
• Dynamic Thresholds: Bonsai’s thresholds are dynamic, adapting to market conditions and user-selected sensitivity mode.
• Scoring System: Bonsai’s unique scoring system is grounded on potential returns, streamlining complex market data interpretation.
Performance Table Breakdown
🔧 Classic Elements & Value Added
• Refined Moving Averages: Bonsai incorporates standard moving averages like the EMA, SMA and ALMA to smooth and refine trend lines.
• Enhanced Visual Representation: Bonsai strives to provide clarity beyond just displaying market directions. Its visuals are crafted to help traders understand and potentially act promptly. The deliberate use of color dynamics, trend indications, and integration of moving averages come together to create a representation that aims to stand out in its clarity and simplicity.
📊 Features
• Dynamic Sensitivity Modes : Settings include:
• (Auto) Slow, Mid, Fast : These modes allow Bonsai to auto-adjust its sensitivity in line with market changes.
• 'Slow': Aims to capture larger market moves with fewer signals.
• 'Mid': A balanced mode with a moderate signal frequency.
• 'Fast': Caters to rapid market changes, providing more signals.
• Manual : For traders who prefer setting their sensitivity.
• Visualization: Green indicates bullish trends, and Red indicates bearish ones. Trend colors are customizable in gradient intensity and opacity.
• Performance Insights : A table displaying the effectiveness of all modes, guiding your strategy choices.
• Dashboard Themes : Users can switch between light and dark themes.
• Alert System : Real-time buy/sell signal notifications.
• Compatibility : Output can be integrated as a source for other indicators.
Indicator Settings Menu
🎛 How To Use Bonsai
1. Select your sensitivity mode.
2. Use color cues to analyze market directions.
3. Check the performance insights for strategy adjustment.
4. Set alerts to stay updated.
📜 Feedback & Improvement
We value your feedback. As the trading world evolves, Bonsai will adapt, meeting traders' dynamic needs.
❗️ Disclaimer
Bonsai serves as an analytical tool and isn’t a standalone trading strategy. Its performance table is for reference, and accuracy isn’t guaranteed. Always research thoroughly and be mindful of trading risks. Bonsai facilitates analysis but doesn’t promise particular outcomes.
The Weinstein MethodWhat is "The Weinstein Method" indicator?
Presentation of the indicator
The Weinstein Method indicator was developed by us to help traders use the Stan Weinstein Method more effectively. This method usually requires a lot of time and analysis to determine the different phases of an asset, but the indicator takes care of that in no time. By simply choosing the market and the timeframe, traders can get the different trends of the asset, the famous four phases of Stan Weinstein.
The basic principles of the indicator
The Weinstein Method indicator is based on the principles of the Stan Weinstein Method. According to this method, assets go through four phases: the accumulation phase, the rise phase, the distribution phase and the fall phase. Traders use these phases to determine when to buy, sell or stay out of the market.
How the indicator works
The indicator will take into account several elements to trigger the phases: the RSI, the volumes, the EMA, the Relative Strength of the asset (the choice of the market in the menu of the indicator is determining for this calculation) and the Supports/Resistances.
Depending on the Timeframe (several configurations: 1 hour, 4 hours, daily, weekly and monthly) and the market (Dow Jones - Stock, S&P 500 - Stock, Nasdaq - Stock, DAX - Stock, CAC 40 - Stock and Cryptos) selected, the variables mentioned above change to adapt to the asset and the timeframe.
Each phase has criteria that must be met in order to be triggered (those described by Stan Weinstein in his book "Secrets for Profiting in Bull and Bear Markets"):
- Phase 1: We have determined as criteria: low volume, RSI in the low zone, minimal price variation over the last X candles and the EMA without direction.
- Phase 2: We calculate the relative strength of the asset compared to its benchmark, above-average volumes, the break of a major resistance, the direction of the EMA and the level of the RSI.
- Phase 3: We look to see if the asset breaks its uptrend (break of a trend following EMA), if it fails to make a new high, if the RSI is in the high zone and if the volumes are strong.
- Phase 4: For this phase to be triggered, the asset must break a major support, be below the EMA (once again these variables are adapted according to the timeframe and the market selected in the menu) and the EMA must be bearish.
How to use
The signals of the indicator
On the chart, the indicator allows you to visualize the different phases of an asset's movement. Each point on the chart corresponds to a particular phase, which is labeled below the point with the name of the phase. The different phases that can be identified with the help of the indicator are the following:
- S1: Accumulation
- S2: Rising
- S3: Distribution
- S4: Decline
By observing the successive points, it’s possible to identify the market trend and to consider trading positions accordingly.
The different strategies for using the indicator
The market phase indicator can be used for both short term and long-term trading strategies. However, it should be noted that this method is generally used for the medium and long term.
In terms of trading strategies, investors can use the indicator to identify periods of trend reversal and take positions against the current trend. For example, if the indicator shows a distribution phase, this may indicate a downward trend reversal and a trader could take a sell position when the downward phase begins.
On the other hand, traders can also use the indicator to confirm the current trend and take positions in the direction of the trend. If the indicator shows an upward phase, this may indicate a continuing upward trend and a trader could take a buy position.
Disclaimer
Please note that The Weinstein Method indicator is a tool designed to assist traders in their decision-making process. While it is based on sound principles and can be helpful in identifying market trends, it is important to remember that there is no magic indicator that can guarantee success in trading.
It is the responsibility of the user to carefully consider all available information, including the signals generated by The Weinstein Method indicator, and to make their own informed decisions about when to buy, sell or stay out of the market. It is important to remember that trading carries risks, and no strategy or tool can eliminate those risks entirely.
We want to emphasize that we do not provide investment advice, and any decisions made using The Weinstein Method indicator are the sole responsibility of the user. We cannot be held liable for any losses that may occur as a result of trading using this indicator.

Market Swiss KnifeSimple script, helpful to analyse the current conditions of the market and make your own decisions. It's not a signal indicator
* Shows an EMA to help you identify the trend
* Uses the ATR to plot two lines below (current low + ATR) and above (current high - ATR) the current candle. Useful to see whether the market is overextended or find possible targets
* Plots a vertical line showing NY, Tokyo and London session opens
* Includes a position size calculator to calculate your desired lot size (works in forex and gold)
3GBH BTC DOM vs MCBitcoin Market Cap vs Dominance
- data normalized with RSI
Included in this indicator:
- RSI of BTC Market Cap
- RSI of BTC Dominance
- EMA of BTC Market Cap
- EMA of BTC Domiance
-----
Dominance influences the market. Is money flowing into Bitcoin?
-----
EMA's to help with Technical Analysis.
-----
User-friendly.
You can change all the inputs, they are labelled for ease-of-use.
You can toggle On/Off any or all of the options.

{Gunzo} Bulls Power vs. Bears PowerBulls Power vs. Bears Power is a unique tool that displays on each candle the balance between the bears (sellers) and the bulls (buyers).
OVERWIEW :
This indicator is mainly based on the popular indicator “Elder ray” made by Dr. Alexander Elder in 1989. This indicator has been developed in order to determine the strength of the competing groups of buyers and sellers in the markets.
CALCULATION :
To measure the competing power of bulls and bears, the indicator compares the current high (maximum power of the bulls) and current low (maximum power of the bears) to the average price using a exponential moving average.
Bull Power = Current High – EMA 13 (closing)
Bear Power = Current Low – EMA 13 (closing)
This Elder ray indicator can also tell us more information about market conditions :
If the current high and current low are above the EMA 13, the bulls are totally in control on the market
If the current high and current low are under the EMA 13, the bears are totally in control of the market
If the EMA 13 is in between of the current high and current low, there is strong fight about controlling the market, there is possible reversal in this configuration
SETTINGS :
Fast MA Period : Fast moving average period (only used for buy sell signal)
Slow MA Period : Slow moving average period (only used for buy sell signal)
Display candle labels : Show/hide candle labels on the chart
Display only bear labels above X : Exclude all top candle labels on the chart below the value specified.
Display only bull labels above X : Exclude all bottom candle labels on the chart below the value specified.
Display opposite values : Show all candle labels on top (bearish) and bottom (bullish) or only show the candle labels for the winning force on the candle.
Display box for last candle : Show/hide the dominance boxes (red and blue) after last candle showing the last bear and bull power.
Display box after X candles : How many candles in the future the dominance boxes should be displayed.
Display slow / fast crossover (o) : Display crossover signals (circles) between fast line and slow line.
Display bear / bull fighting (x) : Display fighting signals (crosses) between bull and bears.
VISUALIZATIONS :
This indicator has 3 possible complementary visualizations:
Candle labels : The labels on top are the percentage of the bears on the candle, while the labels on the bottom are the percentage of the bulls on the candle. When the bulls are winning the labels are blue, when the bears are winning the labels are red, silver otherwise.
Box after last candle : The blue and red boxes after the last candle are the percentage of bears and bulls on the last candle of the chart. That boxes can be disabled in the settings if you feel it is redundant with the labels.
Signals : The signals are displayed at the bottom of the main area of trading. The orange “x” represents an area where bulls and bears are fighting hard. The blue “o” represents a buy signal (fast line crosses over the slow line) and the red “o” represents a sell sinal (fast line crosses under the slow line).
USAGE :
The most important rule in the usage of this indicator is :
“The higher the current bull power is (or bear power), the higher the chances are the next candle will also be bullish (or bearish).”
When the prices is increasing, it is very interesting to follow the bull power to verify that it is either stable or increasing. If the bull power keeps decreasing candle after candle, there is chances that in the next candles there will be a reversal.
When there is orange crosses in the signal area (bottom of the screen), it means that there is a big fight between bulls and bears and that the current price of the asset is probably stable. During these fighting areas, reversals are more likely to happen.
When there is a blue circle in the signal area (or red signal), it can be considered as a buy signal (or sell signal). These signals are determined by the crossover of the fast and slow lines of the total power of the bulls plus the bears.
LIMITATIONS :
As Pine script only allows to display about 50 drawings on the chart, the labels on the candles can not be printed on all the historical candles. The option “Display opposites” could be useful to hide unnecessary labels and then be able to display more older labels.
As the Elder ray indicator uses an average price (EMA 13 of closing price), the indicator may be lagging in some situations, but most of the time it will help to filter the bad signals contrary to the indicators that are too reactive.

Aggro AltCoinTrader RSIRSI Aggregator for Altcoin swings and Scalping. Detects macro market trends.
10 tickers (customizable). All 10 must be filled.
Example: Defi cycle, fill samples with 5 strong DEFI coins and 5 others you are interested in particular.
Buy red label and ride trend.
Sell signals are places for possible ladder selling.
Yellow buy dots, ladder buys.
Best results in 1 hour time frame

Trending/RangingThis script is a useful tool to use to identify the current market. It includes three other indicators:
1. ATR (combined with a SMA of the ATR)
2. ADX
3. RSI
It allows you to filter for when the market is trending vs. when the market is ranging by using any of the three indicators. You can also combine them to find extremely good trends to trade, or if you're a channel trader, identify when you wouldn't want to trade. This indicator also includes a time frame setting to allow you to ZOOM OUT and explore the long term trend of the security you are trading. I highly recommend using this indicator as a filter for when you enter a trade or not depending on the system you like to trade.

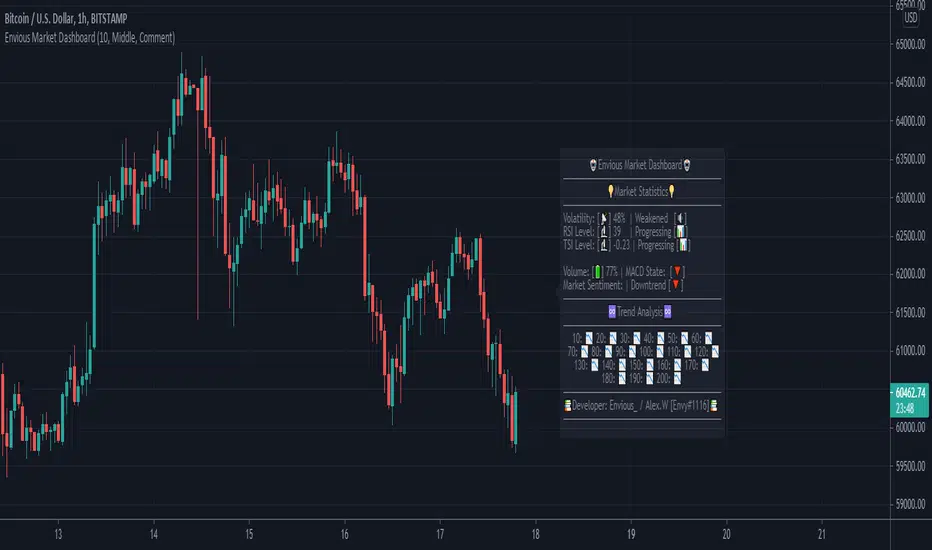
Envious Market DashboardHey traders, this is a market dashboard that can be useful to have on top of your charts. It provides information of the trends discovered, the volatility, the current MACD Trend, the current trend, RSI level, RSI Overbought / Oversold state, TSI level, TSI Overbought / Oversold state, the volume percentage, and more. You can customise the dashboard location, the colour of the dashboard, the background of the dashboard and its background colour. Hope this is useful to you traders :).
[astropark] Progressive VWAPDearDear Followers,
today another awesome Analysis Tool, that you can use in your trading journey: Progressive VWAP !
If you love vwap, you will love this indicator, as it calculates some special "progressive" / "evolving" vwap levels:
daily vwap named dvwap
2D vwap named 2dvwap
3D vwap named 3dvwap
weekly vwap named wvwap
2W vwap named 2wvwap
Monthly vwap named mvwap
Quarterly vwap named qvwap
Yearly vwap named yvwap
You can:
choose which progressive vwap to show and which to hide
change each line color / thickness / display style (solid or dashed)
choose to show or hide labels and change their size
Why such indicator should be helpful? How can I use it to do profit?
In multiple ways:
when a lower timeframe crosses an higher timeframe progressive vwap, you know sentiment is getting bullish and viceversa if the cross is downwards
price tends to bounce on such progressive vwaps: the higher the timeframe, the more probably the bounce is as well as the magnitude of the breakout of the level
This indicator works on every timeframe, market and pair.
As I always say, all tools are great if you use them correctly: this is not the "Holy Grail", so always use proper money and risk management strategies.
This is a premium indicator , so send me a private message in order to get access to this script.

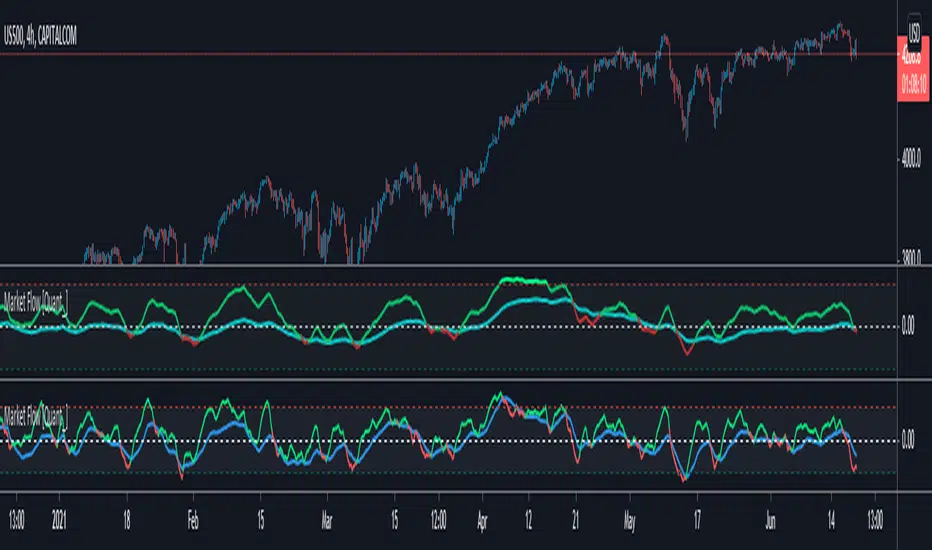
Market Flow IndicatorHOW IS THIS INDICATOR DIFFERENT ?
This is a forked and even simpler version of the premium indicator Trend Volume RSI Analysis . Please, read its description on my profile page so that you can understand what changes have been made here and why.
Although in Trend Volume RSI Analysis you have only one parameter to configure (length), you need to choose between 3 options for the analysis - Trend, Volume, or RSI. You also have an option to highlight the buy and sell zones. For me, this is a lot of switching. Alternatively, if I want to see the whole picture, I have to apply the indicator twice or even three times, which limits the space on my screen for the candlestick chart. However, a lot of work has gone into creating that indicator and it works great. If it isn't broken, why fix it, right?
So, I forked Trend Volume RSI Analysis and modified some of the formulas, as well as effectively combined the Trend and the RSI parts into one simpler indicator. No more switching. Also, the Buy and Sell colors change based on crossovers. No more zones either.
WHAT DOES THIS INDICATOR DO ?
Market Flow Indicator shows two things - price direction (blue line) and momentum (green line). In the first screenshot below the indicator is applied to the 1h chart of SPX500 to show direction and on the second screenshot I use a 1h chart of BTC/USD in which you notice divergence, formed as a result of exhausted momentum. The indicator works equally well with cryptocurrencies, indices, commodities, and currency pairs.
The line colored in green and red is a modified RSI and the blue line is called Momentum (those are their names for now, but please check the updates below if anything has changed). Their colors are configurable in the settings panel.
In order to standardize the numbers without any modifications to the formulas, the RSI numbers are brought down by 50. In other words, the equivalent of an RSI overbought extreme (100) is 50 in the Market Flow Indicator, and the equivalent of an oversold extreme (0) is -50 in this indicator. Default lines here are set at 25 and -25, which are the equivalent of 75 and 25 respectively.
That's pretty much it. The idea behind Market Flow Indicator was to be super simple and to be used with minimum configuration if any at all. Once you get a grasp of it, it shouldn't take you more than a few seconds to know if you should stay flat or look for a long/short position.
HOW MUCH DOES IT COST ?
Although this may look like a simple indicator, I have spent a great deal of time testing and optimizing it to achieve this level of simplicity and practicality. Also, I will continue to update Market Flow Indicator as well as introduce user-requested features if they will improve its overall performance. For these reasons, this is a paid indicator, but I do give a free trial so that you can test it out for yourself. If you want to gain access, please use the provided information below or just message me. Thank you for your time.
Disclaimer: The purpose of all indicators is to indicate potential setups, which may lead to profitable results. No indicator is perfect and certainly, no indicator has a 100% success rate. They are subject to flaws, wrongful interpretation, bugs, etc. This indicator makes no exception. It must be used with a sound money management plan that puts the main emphasis on protecting your capital. Please, do not rely solely on any single indicator to make trading decisions instead of you. Indicators are storytellers, not fortune tellers. They help you see the bigger picture, not the future.
GMS: Market Performance IndicatorThis is just an easy way to visualize what the market's performance is (in price or percent) in any given session for any chosen time frame. The magnitude of price moves are not the same today as they were 50 years ago, which is why I included the percent selection to better compare historical movements. Time frame selections are Daily, Weekly, Monthly, Quarterly, and Yearly. I added in a little background highlight to show the start of a new session as well.
The source code is open so feel free to poke around!
Hope this helps,
Andre
