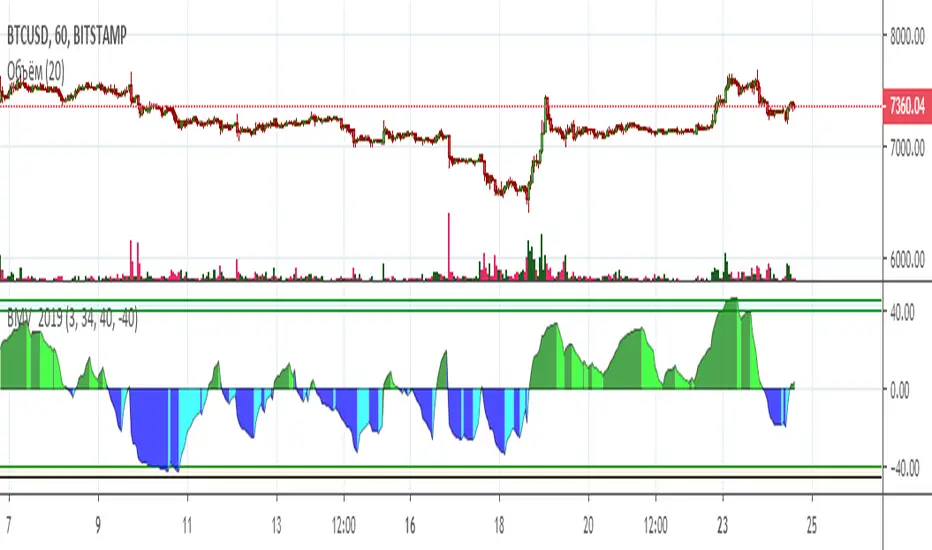
Bitok Magic Volume 2019 BMV[wozdux]Magic volume indicator (Bitok Magic Volume) BMV
Purchase volumes and sales volumes are separated
The percentage of purchases over total sales is calculated.
If the price rises and the volume increases, then green, the price falls and the volume falls, then light green. If the price falls and the volume increases, then blue, if the price increases and the volume falls, then light blue.
Thus, the dominant movement in trading volumes is tracked.
The indicator settings:
T1-period of initial volume averaging. The default is 3 bars. The volume moving average is calculated for 3 bars. If the moving average increases, then it means an increase in market volatility. And then the chart is colored either dark green or dark blue.If the moving average falls, the chart color is light green or light blue.
T2-the period of calculation of excess of purchases over sales. The chart is above zero if purchases dominate sales. And Vice versa, the graph is below zero, if sales dominate.
By default, the indicator uses net trading volume. If you study the graph of bitcoin to the dollar, the volume is the volume in bitcoins.
The BTC<<-->>USD button switches the indicator calculation from bitcoin volume to dollar volume.
Level max-upper level
Level min - lower level.
How to use it.
Trading volume is an important indicator of crowd sentiment. If volume rises on purchases and falls on sales, it is indicative of the mood of the crowd to buy more than sell. The indicator chart in this case is located above zero and the color is dark green on the ascents and light green on the descents.
If volume rises on sales and falls on purchases, then the mood of the crowd is to sell more. The indicator is then located below zero and the color on the falls is dark blue, and on the rises is light blue.
-----русское описание------
Магический индикатор объема (Bitok Magic Volume)
Разделяются объемы покупок и объемы продаж
Вычисляется процент покупок над суммарным объемом продаж.
Если цена поднимается и объем увеличивается, тогда зеленый, цена падает и объем падает , тогда светло зеленый. Если цена падает и объем увеличивается, тогда синий, если цена увеличивается И объем падает, то светло синий.
Таким образом, отслеживается доминирующее движение по объемам торгов.
Настройки индикатора:
T1-период первоначального усреднения объема. По умолчанию 3 бара. За 3 бара вычисляется скользящее среднее объема. Если скользящее среднее увеличивается, то это означает рост волатильности рынка. И тогда график окрашивается либо темно-зеленым либо темно-синим цветом.Если скользящее среднее падает, то цвет графика светло-зеленый или светло-голубой.
T2- Период вычисления превышения покупок над продажами. График выше нуля, если покупки доминируют над продажами. И наоборот, график ниже нуля, если продажи доминируют.
По умолчанию индикатор использует чистый объем торгов. Если исследуется график биткоина к доллару, то объем это объем в биткоинах.
Кнопка BTC<<-->>USD переключает вычисление индикатора с объема в биткоинах в объем в долларах.
Level max - верхний уровень
Level min - нижний уровень.
Как пользоваться.
Объем торгов - важный показатель настроения толпы. Если объем растет на покупках и падает на продажах, то это свидетельствует о настроении толпы больше покупать, чем продавать. Диаграмма индикатора в этом случае располагается выше нуля И цвет темно-зеленый на подъемах и светло-зеленый на спусках.
Если объем растет на продажах и падает на покупках, то настроение толпы больше продавать. Индикатор тогда располагается ниже нуля И цвет на падениях темно-синий, а на подъемах светло-голубой.
Marketanalysis
Apex Transformation Band EliteApex Transformation Band Elite Version
Gauge the mean range of price on an annual/yearly basis of the market.
Determine if price is in an uptrend (above the zone), neutral (inside the zone) or downtrend (below the zone).
Works on 'all' time frames.
Works for 'all' asset classes.
Customize settings for better interpretation of trend
Buy Signals (green cross)
Sell Signals (red cross)
Alert Conditions for Buy/Sell Signals
Alert Conditions for Trend change: Uptrend/Neutral/Downtrend

Apex Transformation Band ProApex Transformation Band Professional Version
Gauge the mean range of price on an annual/yearly basis of the market.
Determine if price is in an uptrend (above the zone), neutral (inside the zone) or downtrend (below the zone).
Works on 'Daily,Weekly,Monthly' time frames.
Works for all asset classes.
Feel free to ask any questions.

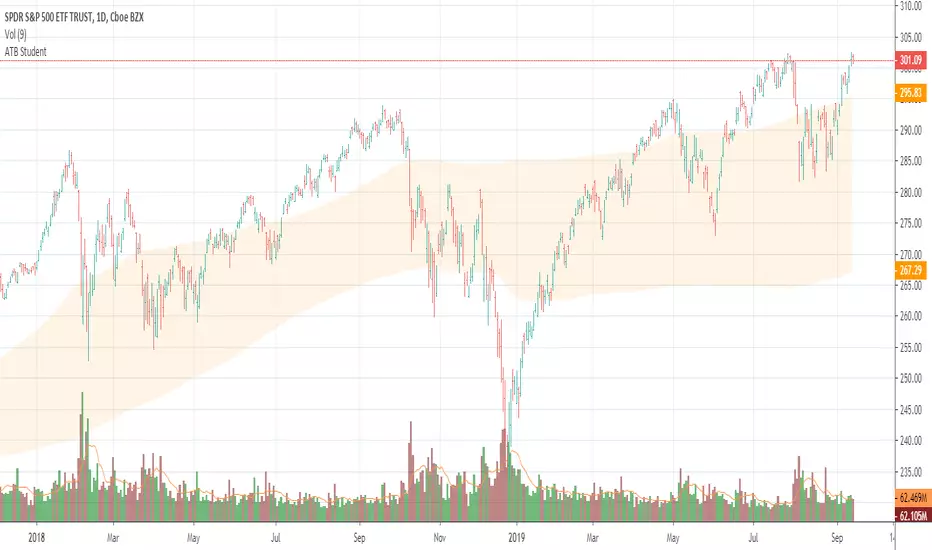
Apex Transformation Band StudentApex Transformation Band Student Version
Gauge the mean range of price on an annual/yearly basis of the market.
Determine if price is in an uptrend (above the zone), neutral (inside the zone) or downtrend (below the zone).
Works on 'Daily' time frame only.
Works only for SPY , QQQ , DIA , IWM , GLD , SLV , TLT and BTCUSD
Keep it simple.
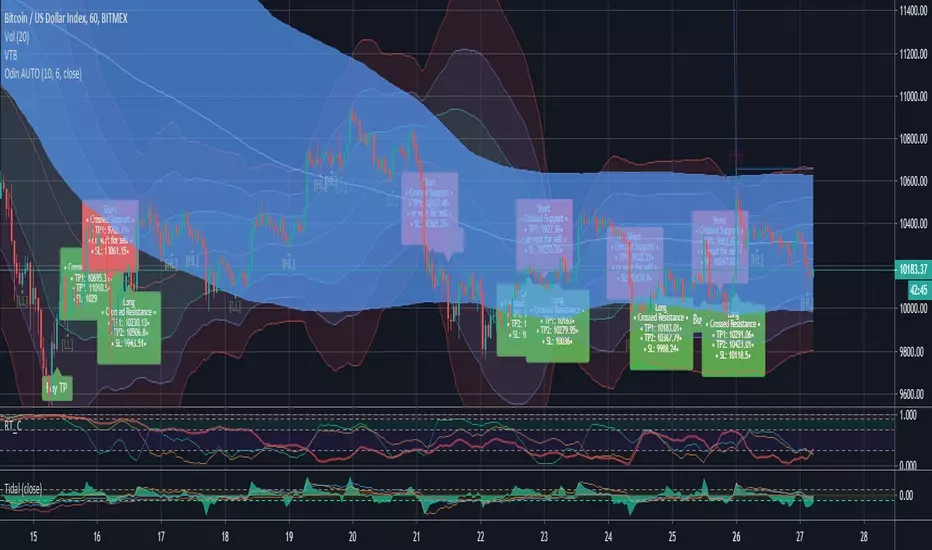
Riptide - Odin AutomatedHey guys,
Its finally here! Automated Odin will allow you to trade the Odin indicator automatically! To learn more about setup and results.
Average True Range ShiftThis indicator builds on the idea of the Average True Range (ATR) as a way of measuring volatility. It uses two different ATRs to show a shift in market volatility.
It is mainly composed of two moving averages of ATR. One fast moving, which looks back at the previous 5 periods. One slow moving, which looks back at the previous 21 periods. Both ATRs have been normalized (show percentage instead of an absolute amount). The third component of this indicator is the histogram that is created by subtracting the slow moving average, from the fast moving average.
By having two ATRs of different lengths, traders can see how short term volatility compares to long term volatility, and how it is shifting over time. When the fast-moving crosses above the slow-moving, it will show a positive value on the histogram, meaning that short term volatility is increasing and higher than normal. When it crosses below, it will show a negative value on the histogram, meaning that short term volatility is decreasing, and lower than normal.
There are a variety of ways to utilize this indicator, and it will work in most markets. I find it is best to analyze macro market conditions on daily charts and above, rather than micro intraday moves.

Gopalakrishnan Range IndexThis indicator was originally developed by Jayanthi Gopalakrishnan (Stocks & Commodities, V.19:1 (January, 2001): "Gopalakrishnan Range Index").
Like and follow for more open source indicators!
Happy Trading!
