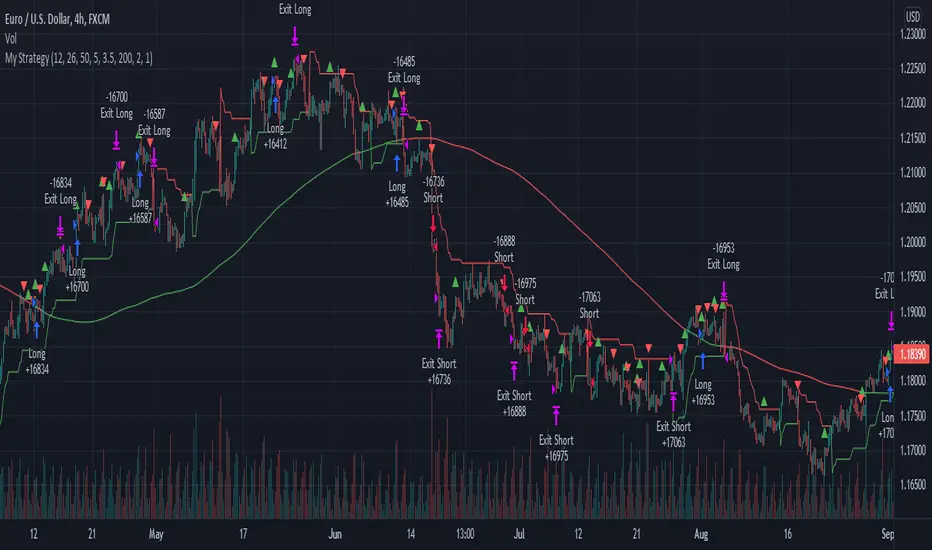
Joint Conditions Strategy Suite + TradingConnector alerts bot"Please give us combined alerts with the possibility of having several conditions in place to trigger the alert." - was the top voted request from users under one of the recent blogposts by TradingView.
Ask and you shall receive ;)
TradingView is a great platform, with unmatched set of functionalities, yet this particular combo of features indeed seems not to be in place. Fortunately, TradingView is also very open platform, thanks to PineScript coding language, which enables developing combos like the requried one and plenty of other magic.
I have already published numerous "educational" scripts, showing how to code indicators and alerts with PineScript, but... this is not one of them. This one is for real. READY FOR USE on real markets, also by the non-coding traders. Just take my script, set parameters with dropdowns, backtest the strategy, fire the alerts and execute them.
HOW TO USE IT
In "Settings" popup I tried to mimic the CreateAlert popup dropdowns for selecting logic. Let's say you want to enter Long position at Stochastic KxD crossover. In first line of Long Entry conditions set "StochK" + "Crossing Up" + "StochD". Last field doesn't matter because in 3rd dropdown something else than "value" was selected. In second line you could set "maB" + "Greater Than" + "maC" to filter out those entries which are in direction of the uptrend. And yeah, add ADX>25 to make sure the market is actually moving: "ADX" + "Greater Than" + "value" + "25". All condition lines must be TRUE (or skipped) for the entry to be triggered. Toghether with an alert.
The same for Short entries. Combinations are limitless.
INDICATORS AND MTF (MULTI-TIMEFRAME)
In those dropdowns you can select candle values like open/close/high/low/ohlc4, but also some most popular indicators, which I have pre-built into this script: RSI, various Moving Averages, ADX-DMI, Stochastic and Bollinger Bands for start. You can configure parameters of those indicators also in "Settings" popup, in "Indicator Definitions" section. What's important, you can use any of these indicators from higher timeframe, setting MTF multiplier. So if you applied this indicator to 1h chart, but want to use rsi(close,14) from 4h chart, set MTF to 4. If you want to use current timeframe indicators, keep MTF at 1, which is a default setting here.
Note for coders: to keep focus of this script on joining conditions, entire logic for those indicators has been moved to external library, also open source. I encourage you to dig into the code and see how it's done. I love the addition of libraries concept in PineScript.
CUSTOM INDICATOR
Following the "openness" spirit of my master - which is TradingView itself - my work is also open, in 2 ways:
1. This script is open source. So you can grab it, modify or add any functionalities you want. I cannot and don't want to stop you from doing that. I'm asking for only one favor - please mention this source script in your credits.
2. You can import the plot (series) from any other indicator on TradingView. In Settings popup of my script, scroll down to "Indicator Definitions" section, and select the series of your choice in the first dropdown. Now it is ready to use in conditions dropdowns on top of the Settings popup.
Let me give you an example of that last scenario. Take another script of mine, "Pivot Points on SR lines DEMO". You can find it in "Indicators & Strategies" library or here: (). Attach it to your chart. Now come back to THIS script, open Settings popup and in "Custom Indicator aka Imported Source" select "Pivot Points on SR lines: ...". The way it works - it detects if a pivot point happened on Support/Resistance line from the past and returns 1 for PivotLow and -1 for Pivot High. Now in first Long Entry condition set: "custom indicator" + "Greater Than" + "value" + "0" and long entries will be marked on every pivot low noticed on Support/Resistance line.
ALERTS
Last but not least - the alerts. This script produces alerts on the entries calculated by strategy logic, as marked on the chart by the backtester. Moreover, syntax of those alerts is already prepared and fully compatible with TradingConnector - alerts executing tool (bot), if you want to auto-execute those trades. Apart from installing the tool, you need to set
up the alerts in TradingView, here is how:
open CreateAlert popup
in first dropdown select "Joint Conditions Strategy Template"
in second dropdown select "alert() function calls only"
And that's all. You only need to set one alert for the whole script, not one for Longs and one for Shorts as it was in the past. Also, you don't need to setup closing alerts, because stop-loss/take-profit/trailing-stop information is embedded in the entry alert so your broker receives it as early as possible. Alerts sent will look like this: "long sl=40 tp=80", which is exactly what TradingConnector expects.
Phew, that's all folks. If you think I should add something to this template (maybe other indicators?) please let me know in comments or via DM. Happy trading!
P.S. Pyramiding is not supported in this script.
Disclaimer : I'm not saying above combination of conditions will make you money. Actually none of this can be considered financial advice. It is only a software tool. Use it wisely, be aware of the risk and do your own research!
Medie mobili

Multi MA Trend Following Strategy TemplateTrend following is one of the better known technical trading strategies. But, which trend should you follow? Today I am sharing with the community a trend following template script that includes a selection of over 20 different trends / regressions. Some of these are in the Pine library, and some have been custom coded and contributed over time by the beloved Pine Coder community.
How it works:
This template will plot any of the 20+ trends that you can select in the settings. The strategy component will buy if the trend line is moving up, and will sell if it moves down. If the line is green that indicates that the trend is higher than the prior bar. If the line is red that indicates that the trend is lower than the prior bar. This script is different from many moving average scripts in that it follows the trend itself and doesn't look for a cross of multiple trends.
How to use it:
When wanting to trend follow an instrument, you can use this template to help identify what approach you might want to take and/or which indicator you might want to use. You can also modify the strategy as you see fit and make use of the 20+ incorporated indicators. Incorporate your trade and risk management strategy, or use it as an indicator.
Disclaimer: Open source scripts I publish in the community are largely meant to spark ideas that can be used as building blocks for part of a more robust trade management strategy. Even though this example script might beat buy and hold over the back-test time-frame, I wouldn't advise using it as a stand-alone strategy without significant additions/modifications to the strategy and risk management functions.

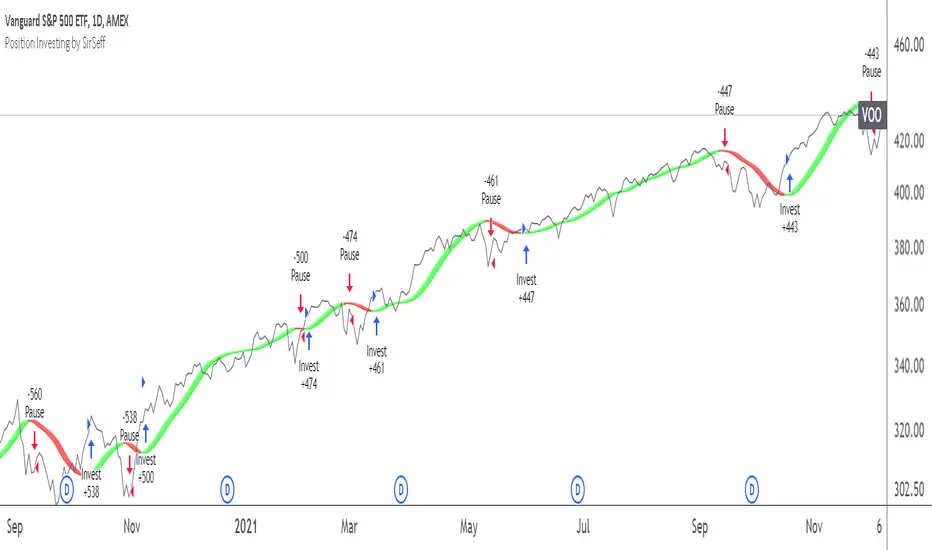
Position Investing by SirSeffThis is for my group.
The ideas is to dollar cost average whenever the band is green and pause investing when the band is red.
This gives you two things:
1. You'll minimize averaging down. Ibig sabihin maiiwasan mo bumili tapos kinabukasan down agad.
2. you'll maximize averaging up or scaling up. Ibig sabihin, most likely nakaka bili ka na green days and green kinabukasan.
Join the FB group fb.com/groups/usstocksforfilipinos
With Net profit of 87.72 % at hindi pa kasama compounding effect niyan whenever you top up on green bands.
Percent Profitable is 2.07 ibig sabihin ma dodoble mo ang account mo when you religiously follow this.
Max Loss Drawdown is 7.43 %, ibig sabihin maminimize mo ang losses down to 7.43%
MA MTF Cross StrategyStrategy Introduction
This multi-timeframe strategy generates buy and sell entries based on two Moving Averages’ cross with an option to turn on trend direction confirmation through 3rd Moving Average selection. While all three moving averages can be selected from the following list:
SMA
EMA
DEMA
TEMA
LRC
WMA
MF
VAMA
TMA
HMA
JMA
Kijun v2
EDSMA
McGinley
Only long trades are enabled currently
Default Settings
I've set the default selection to the perfect options for 1D timeframe. You can modify all MAs selections and their lengths according to your selected timeframes.
Following default settings are used:
Heiken Ashi Candles are selected by default as source
1st Moving Average selection is set to LRC (Linear Regression Curve)
Length of 1st Moving Average is set to 50
2nd Moving Average is set to EDSMA (Ehlers Deviation-Scaled Moving Average)
Length of 2nd Moving Average is set to 30
3rd Moving Average is set to HMA (Hull Moving Average)
Length of 3rd Moving Average is set to 200
Uptrend direction confirmation through 3rd Moving Average is set to false by default
Start date is set to start from 2013
Backtesting can also be done selecting %age of equity
Suggestions for Usage
Mostly winning trades by set defaults have no prominent drawdown so losing trades can be abolished with Stoploss. Would soon add Stoploss and Takeprofit options in next version. Also, if you want an alerts version of it then just comment below and would publish it later. I’ve found this strategy useful on 1D timeframe with described default settings but multiple Mas selections can be explored further.

MZ SRSI Strategy V1.0Strategy Introduction
This strategy starts from selection of 1st Moving Average from one of following:
SMA
EMA
DEMA
TEMA
LRC
WMA
MF
VAMA
TMA
HMA
JMA
Kijun v2
EDSMA
McGinley
Then it calculates the RSI of selected 1st Moving Average
In the end it calculates Moving Average of previously calculated RSI and for this purpose 2nd Moving Average is also selected from above list.
Cross of RSI and its Moving Average generates Strategy Alerts
Only long trades are enabled currently
Default Settings
I've set the default selection to the perfect options for 1D and 4h timeframes. You can modify both MAs selection and their length according to your selected timeframe.
Following default settings are used:
Heiken Ashi Candles are selected by default as source
1st Moving Average selection is set to LRC (Linear Regression Curve)
Length of 1st Moving Average is set to 50
RSI length is set to 2 because it is supposed to be fast
2nd Moving Average of RSI is set to TMA (Triangular Moving Average)
Length of 1st Moving Average is set to 5
Start date is set to 2011
Backtesting can also be done selecting %age of equity
Suggestions for Usage
Mostly winning trades have no prominent drawdown so losing trades can be abolished with Stoploss. Would soon add Stoploss, MTF and Takeprofit options in next version. Also if you want an alerts version of it then just comment below and would publish it later. I’ve found this strategy useful on 1D and 4h timeframes with described default settings.

Hull MA TimeFrame CrossOverHello traders,
Although this strategy is configured on BTCUSDT , with a changing of settings, it can be used on any trading instrument.
Here it is seen, on the 2 hour chart. With Trading Fees included in result (adjust to suit your exchange fees).
The candle crossover is set to Daily timeframe.
That means that the Candle crossover is going to see if todays price is higher than yesterdays price.
If user sets this to 4 hour timeframe, the candle crossover would be when price is higher than the the price 4 hours ago...
The rest is simple, a moving average to detect direction, and an ATR StopLoss (if activated).
There is StopLoss and Take Profit settings which work by percentage.
The periods of the moving average and the ATR can be adjusted, as can the TP % and SL %.
The price is taken from the CLOSE or the OPEN or OHLC4 etc... which can be changed in the settings. OPEN is recommended to avoid repainting.
The moving average also has selectable types (ALMA,SMA,EMA,WMA,HMA)
So if the Price is above the Moving average, and the moving average is above the alternate timeframe value, then a buy is activated
if the Price is below the Moving average, and the moving average is below the alternate timeframe value, then a sell is activated
if OPEN is selected as Price source, then the alternate timeframe value would be the OPEN of the alternate timeframes candle.
the values are all plotted on chart so user can see what is happening when what crosses over what, and then what changes when settings are adjusted.
Have FuN!
if this strategy brings you the epik win......
.... dont forget about me
seaside420 ❤️

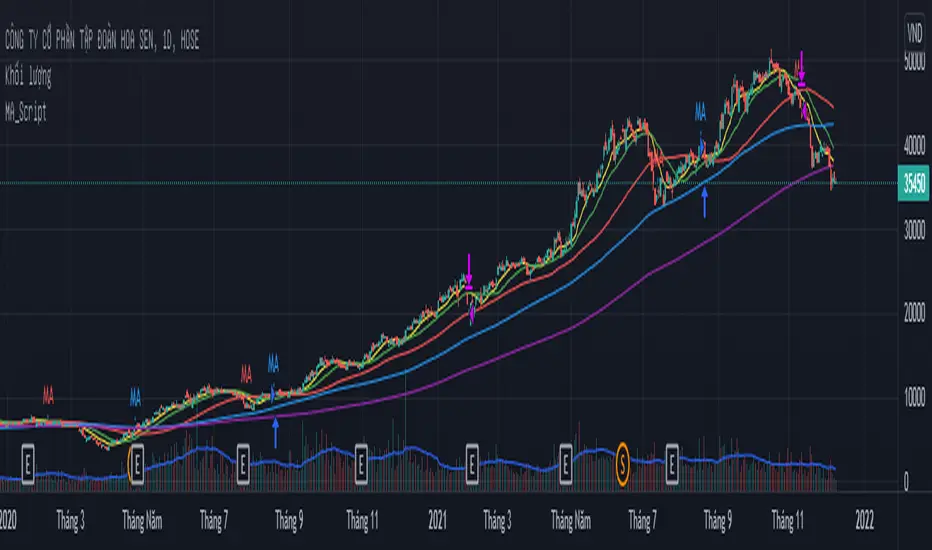
MA_Script- Entry Point : base on MA20, MA50, MA100, MA200.
- Exit Point : base on stop loss, MA and trailing stop.
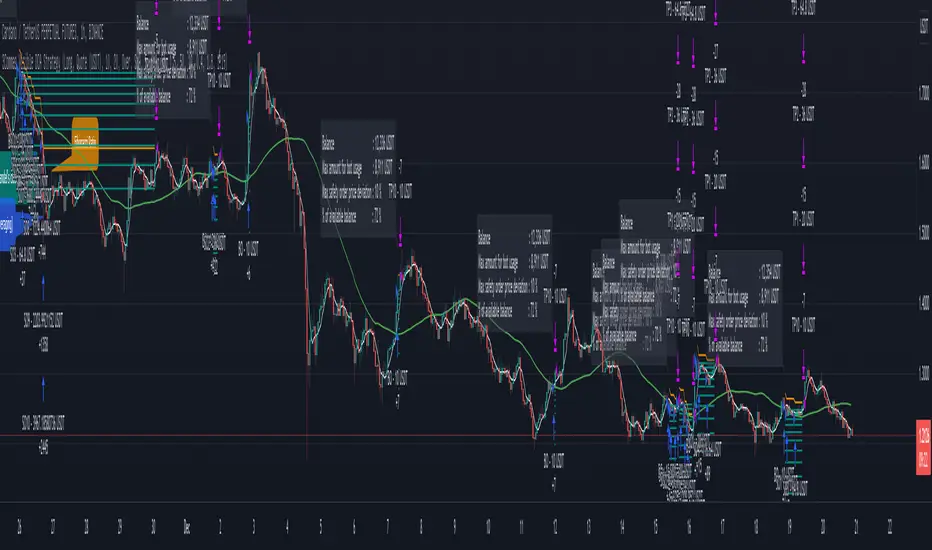
3Commas Visible DCA StrategyThis strategy consists of the following elements and can all be set by the user.
1. Entry by moving average cross.
1) Selection of moving average line.
- SMA(Simple Moving Average)
- EMA(Exponential Moving Average)
- HMA(Hull Moving Average)
2) Selection of Cross over / Cross under
2. Add Entry by DCA(Dollar Cost Averaging)
- A DCA strategy is the practice of investing into a currency at preset intervals to reduce the entry price of a position over time and mitigate volatility risk.
For example,
Base Order = 10 Dollar at Price 100%
Safety Order1 = 20 Dollar at Price 90%
Safety Order2 = 40 Dollar at Price 80%
Average Price => Price 80~90%
thereby getting a better average price for your position and greatly reducing risks from the consequences of volatility.
3. Target Price and Stop Loss.
1) Target Price : Realize profits at % set from the average unit price.
2) Stop Loss : Stop Loss % set from the last safety order.
You can easily find out what's related by changing the setting value after setting the strategy.
This strategy has the following Good characteristics.
1. It informs you of the assets required according to DCA settings.
If you are short of assets, a warning sign will appear.
2. Amount of assets invested in each long entry and long entry close.
3. Visibility of the lowest purchase price line and DCA purchase location according to DCA setting.
easily check the values set in the backtest.
I hope it will help you. Thank you.
Instrument-Z (3Commas Bot)Instrument-Z is what I am currently using as my 3Commas Bot.
It allows you to customize signals from 3 indicators; Crossing MA's, Stochastic RSI, and WaveTrend.
Better yet, it allows you to setup these signals separately depending on whether the Trend MA is going up or down.
So there are 2 sets of inputs for everything, Uptrend inputs and Downtrend inputs.
I have realized that we can't expect a strategy to work the same way in an uptrend vs downtrend, so the inputs should be separated too.
In my testing, separating increased the net profit by 60% on average.
You can select whether you are trading Long or Short.
You can choose your stop loss and take profit levels as well as trade expiration.
You can choose if you only want to trade with the trend (making the opposing signals irrelevant).
The trend is based on the Trend MA.
This script is specifically for cryptocurrencies.
I've noticed that MA crosses on other asset classes are unreliable because the fluctuations are not strong enough to push the MA's across each other in a meaningful way.
If you want to use this as a 3Commas Bot, then you will have to copy the code of the strategy and paste it into your own personal script.
Then you have to change the alert messages at the bottom of the script.
Make sure to change your alert message from this;
{"message_type": "bot", "bot_id": 0000000, "email_token": "0b000a0a-0aa0-00aa-0aa0-000a00000a0a", "delay_seconds": 0}
To this;
{ \"message_type\": \"bot\", \"bot_id\": 0000000, \"email_token\": \"0a000a0a-0aa0-00aa-0aa0-000a00000a0a\", \"delay_seconds\": 0 }
With after each new line and \ before each quotation.
In the Alert setup, select "alert() function calls only".
This indicator is like a middle ground of complexity between the Juicy Trend indicator and the Instrument-A indicator.
And because it does not feature my neural network project, I have made it open script.
Enjoy!

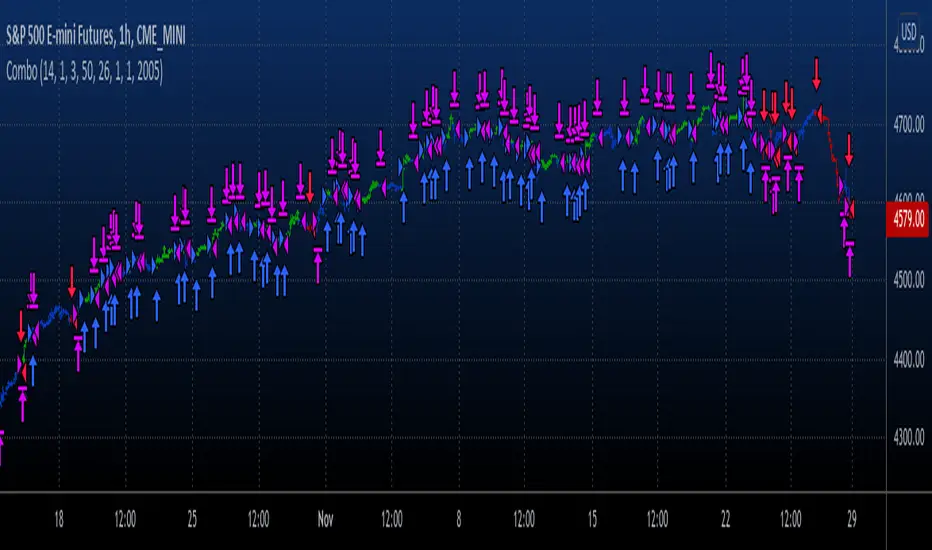
Combo Backtest 123 Reversal & TEMA1This is combo strategies for get a cumulative signal.
First strategy
This System was created from the Book "How I Tripled My Money In The
Futures Market" by Ulf Jensen, Page 183. This is reverse type of strategies.
The strategy buys at market, if close price is higher than the previous close
during 2 days and the meaning of 9-days Stochastic Slow Oscillator is lower than 50.
The strategy sells at market, if close price is lower than the previous close price
during 2 days and the meaning of 9-days Stochastic Fast Oscillator is higher than 50.
Second strategy
This study plots the TEMA1 indicator. TEMA1 ia s triple MA (Moving Average),
and is calculated as 3*MA - (3*MA(MA)) + (MA(MA(MA)))
WARNING:
- For purpose educate only
- This script to change bars colors.
RSI + MA StrategyHello, everyone!
We have just released an innovative strategy for TradingView. It allows you to facilitate the trading process when you have to use both indicators.
This strategy is:
User-friendly
Configurable
Equipped with the combination of Relative Strength Index (RSI) and Moving Average (MA) indicators
Designed with all required functions to manage positions
Features
The RSI+MA strategy can:
Identify entry points for Long and Short positions.
Depict RSI and MA values concerning each other.
Reduce visual congestion and import usability thanks to using a combo of 2 indicators.
Allow using pivot trading. The RSI+MA strategy will enter a Long position according to the Short position conditions. And vice versa.
Note! If you want to open a Long position, the RSI line should cross MA from top to bottom. If you want to open a Short position, RSI has to cross MA from bottom to top.
Parameters
We have equipped our strategy with more than 14 additional parameters. So, you can configure the EA according to your needs!
Inputs :
Use Reverse Trade — allows swapping Long and Short positions opening conditions.
Resolution — allows you to view an indicator with data on a higher or lower timeframe on the current chart.
RSI Length
RSI Source: Open, High, Low, Close, HL2, HLC3, OHLC4
Show MA — allows you to enable or disable MA displaying.
MA Length
MA Offset
Style:
RSI — RSI indicator line color and style settings.
MA — MA indicator line color and style configuration.
Upper Band — allows customizing line style, color, and RSI upper bound value.
Lower Band — allows you to customize line style, color, and RSI lower bound value.
Background — background color setting within the RSI upper and lower borders.
Precision — number of decimals for RSI values.
Note! Try RSI+MA on your demo account first before going live.

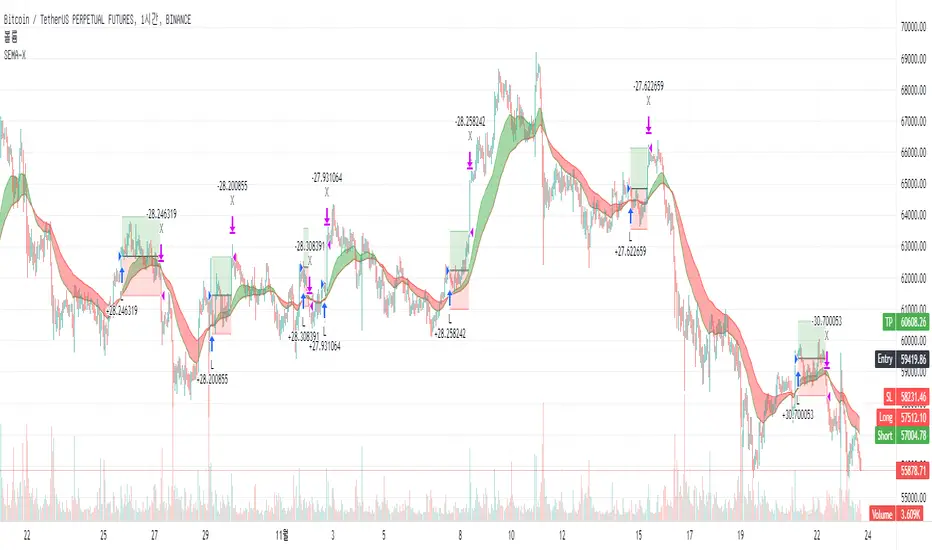
SEMA-XSEMA-X (sema cross)
It's a simple EMA cross strategy
Rules of strategy
1. 2 EMA crossing
2. Long (Golden Cross), Short (Dead Cross)
3. Target profit, stop loss setting
You can also get big trend gains if you set a long target price.
* * *
SEMA-X (세마크로스)
간단한 EMA 교차 전략 입니다.
전략의 규칙
1. 2개의 EMA 교차
2. 매수(골든 크로스), 매도(데드 크로스)
3. 목표가, 손절가 설정
목표가를 길게 설정하면 큰 추세 이익도 얻을 수 있습니다.
Simple EMA Crossing Strategy TradeMathSimple EMA Crossing strategy, based on crossover Fast exponential moving average = EMA21 and Slow exponential moving average = EMA55.
Default stop loss is 3%, but you can change it.
Default take profit is 9%, it based on stop loss.
Risk to Reward ratio is 1 to 3.
Strategy was tested on BTCUSDT 1H timeframe and works fine with these parameters.

RSI StrategySimple way how to use RSI and MA indicators for trading.
What we use:
• RSI
• SMA calculated by RSI (title: SMA_RSI)
• Delta of RSI and SMA_RSI (title: delta)
• SMA calculated by delta of RSI and SMA & RSI (title: SMA_RSI2)
Logic:
Upon the fact that we use the difference between two indicators that have similar values ( RSI and SMA_RSI), we get number around zero. Next, result is smoothed by calculated the SMA . This is the blue/purple line that appears on the chart - SMA_RSI2.
The trade open when SMA_RSI2 cross over the threshold. The trade close when SMA_RSI2 cross under the threshold below.
Also, the usual EMA 200 is used as a filter, which you can switch on or switch off.

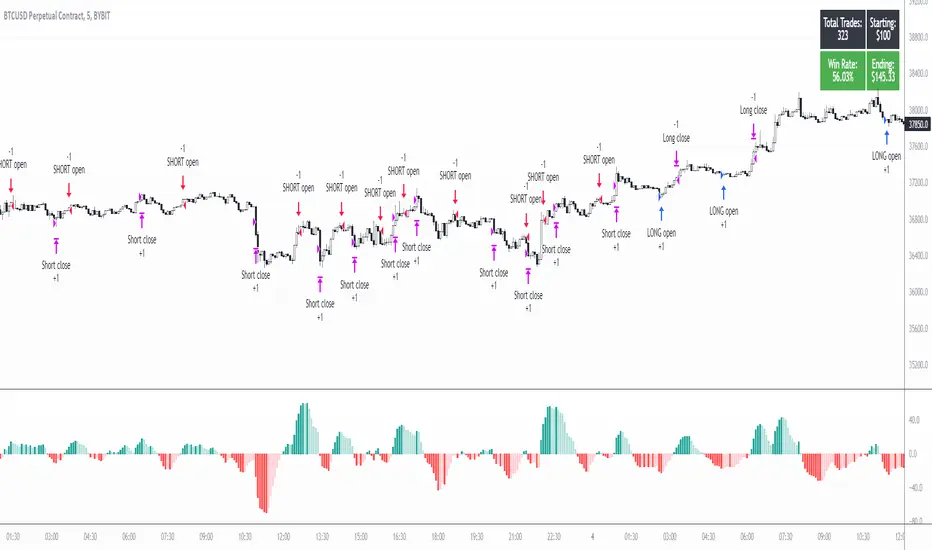
5min MACD scalp by JoelThis strategy is inspired by a youtuber called Joel on Crypto. He trades this using Ema, MACD indicators and his own experience. For more information, check out his Best Crypto Scalping Strategy for the 5 Min Time Frame video. I have tried to automate this a little.
Long or Short trades are determined with a crossing of the fast Ema over the slow Ema for Long and the opposite for Short. Trades should only happen close to the crossovers. Then for Long we use the MACD indicator with a 1min TF (I had better results using the 5min) where we look for high peaks in negative values for Long and vice versa for Shorts. These should be significantly higher than other peaks (or if you will lower peaks for a Long).
Hence, the key is to detect high peaks on the histogram, which I try to achieve by checking if the last 2 values were higher than X bars back. If you want to make it even more specific, then you can turn on the additional checkbox which compares the current value to the average value of X bars back, and if it is greater than, say, 50% the value of the average (= 1.5x the average), then it's ok for the trade.
I also noticed that the strategy often bought at the top or bottom, so I added a check that compares whether the last evaluated bar is the first rising bar (for Long) or falling bar (for Short). This can be turned on or off.
Target profit 0,5% and stop loss 0,4% are based on his recommendation. The strategy is set to take only 1 trade at a time , and you can have a back tester table on.
I'm still a pine script beginner, so the strategy is certainly not perfect and could be improved. If you have any tips on how to improve it further, please let me know. I will try to update it when I have time.
I would also like to thank Joel on Crypto for sharing the strategy and @ZenAndTheArtOfTrading for his great library and code (thanks to him we have a back tester table in here), but especially his educational videos on youtube, which taught me a lot about pine script.
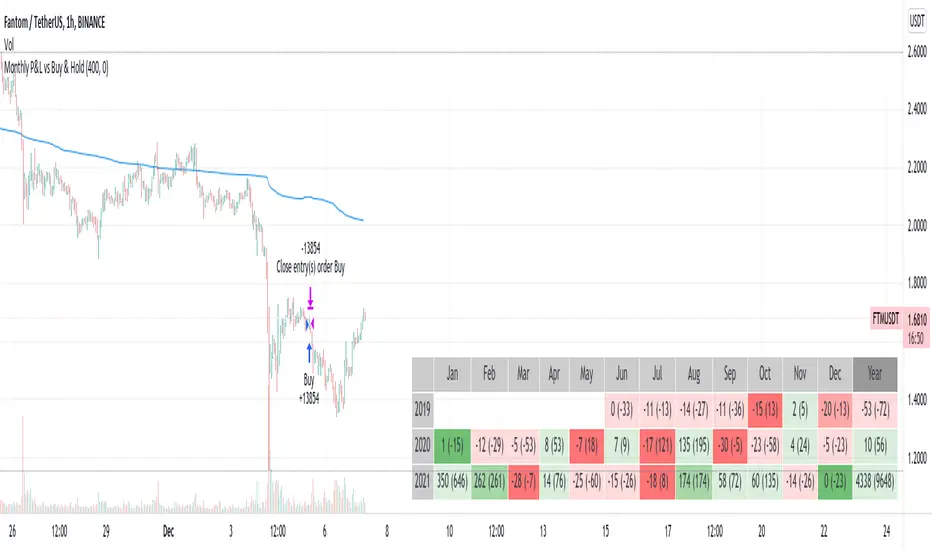
Monthly Returns in Strategies with Market BenchmarkThis is a modified version of this excellent script Monthly Returns in PineScript Strategues by QuantNomad
I liked and used the script but wanted to see how strategy performed vs market on each month/year. So I am sharing back.
The modification consists in adding Market or Buy & Hold performance between parenthesis inside each cell to better see how strategy performed vs market.
Also, 3 red levels and 3 green levels have been used :
For green :
1/ Light when strategy pnl > 0 but < market
2/ medium when strategy pnl > 0 and > market
3/ Dark when strategy pnl > 0 and market < 0 or pnl > market x 2
Same logic in the opposite direction for red.
The strategy provided here is just a showcase of how to use the table in pine script.
Disclaimer
Please remember that past performance may not be indicative of future results.
Due to various factors, including changing market conditions, the strategy may no longer perform as well as in historical backtesting.
This post and the script don’t provide any financial advice.
DC Breakout Strategy | This is simplicity at its finest.As the title already describes: this is a Donchian breakout strategy. This strategy, as of now, only goes long. It goes long when the price close makes a new high and the 8 day moving average is above the 32 day moving average. The strategy exits the trade if the price breaks the atr trailing stop of * 3 or the 8 day moving average crosses below the 32 day moving average.
This is simplicity at its finest.

Swing Multi Moving Averages Crypto and Stocks StrategySimple and efficient multi moving average strategy combined with risk management and time condition.
Indicators/ Tools used
Multi selection moving average type like SMA , EMA , SMMA , VWMA , VIDYA , FRAMA , T3 and much more
Limit 1 entry max per week, entry on monday exit on sunday or risk management tp/sl.
Rules for entry:
LONG:Close of the candle cross above the moving average while the previous close was below. All of this is happening during monday session.
SHORT:Close of the candle cross below the moving average while the previous close was above. All of this is happening during monday session.
Rules for exit:
We exit either on sunday or if we reach tp/sl levels.
Observations:
I recommend use the strategy 2 types, one for long and another for short, using different parameters since long and short movements behave differently.
For example for long we can use a shorter moving average longth and a higher tp/sl while for short we can use a bigger moving average length and a smaller tp/sl
If you have any questions let me know !

Swing VWAP Crypto and Stocks StrategyThis is a strategy designed for swing trading on markets such as crypto and stocks.
Its components are:
VWAP
Time Management
Risk management
Rules for entry:
We entry only on Monday, if our close of the candle crossed above VWAP
Rules for exit
We exit always on Sunday or if we either hit the TP/SL levels.
If you have any questions let me know

Simple EMA20 Strategy + StochasticThis is a Trend Following Strategy.
The intent of this strategy is to catchthe price as it trends higher than the 20-period EMA and sell immediately after the price closes below it.
I have implemented calculations from Stochastic to make sure the price is coming from an oversold area.
There is also a check to see if the 20-period EMA is trending higher than before.

Low-High-Trend StrategyWhen asked what the key to successful investing was, Warren Buffet famously said “buy low, sell high.” Was he onto something? Today I am sharing with the community a simple “buy low, sell high” strategy with an optional trend filter and take-profit target. I’ve found that this strategy works well in a variety of markets but has a higher tendency to out-perform buy & hold in markets that are ranging sideways.
How it works:
The strategy tracks the highest and lowest price over the last X number of bars (you select the look-back period). The highest price line is plotted in green and the lowest price line is potted in red. If the price crosses over the lowest price in the last X number of bars, then a buy signal is generated. Exit options include a take-profit % or selling when the price crosses over the highest price in the last X amount of bars. I.e. “Buy low, sell high.” An EMA is also plotted as a blue trend line, and there is an option to only trade if the price is above the EMA trend line.
Disclaimer: Open source scripts I publish in the community are largely meant to spark ideas that can be used as building blocks for part of a more robust trade management strategy. Even though this example script beats buy and hold over the back-test time-frame, I wouldn't advise using it as a stand-alone strategy without significant additions/modifications to the strategy and risk management functions. In this example the script is being used as a medium-term strategy with just 10% leverage over account equity, a $25k start balance, and back-testing 10+ years. Modifiable slippage and commissions are included in the model.
Green line = Highest price in the look-back period
Red line = Lowest price in the look-back period
Blue line = EMA Trend