ATR SL/TP Precision Zones (Dots)ATR SL/TP Precision Zones (Dots) is a volatility-based tool designed to help traders set accurate Stop Loss and Take Profit levels based on real market volatility — not fixed pips or emotion.
This indicator uses ATR (Average True Range) multiplied by 1.2 to calculate dynamic distance bands.
Instead of drawing a ribbon or channel, it places simple dots above and below each candle:
Upper Dot (Green) → Suggested Take Profit / Price Stretch Zone
Lower Dot (Red) → Suggested Stop Loss Cushion / Support Expansion Zone
Because ATR measures market volatility, these dots expand during high volatility and tighten during slow markets, helping traders avoid stop-loss hunts and premature exits.
Why This Works
Most traders lose because:
They set SL too close → stopped out by noise
They set TP too far → price never reaches it
This tool calibrates those distances automatically based on real price movement behavior.
ATR = volatility
Volatility = market breathing room
This indicator ensures your trade has room to breathe, increasing win consistency.
Best Use Cases
Scalping
Swing trading
Trend continuation entries
Reversal confirmations with support/resistance
Works on Crypto / Forex / Stocks / Futures
Medie mobili

STWP Unified EMA Band (HLC Fusion – Crossover Enhanced Edition)🧠 STWP Unified EMA Band (HLC Fusion – Crossover Enhanced Edition)
Author: simpletradewithpatience (STWP)
Markets: Equities, Indices & Futures
Best Timeframes: 5-min to 1-hour (Daily TF optional for broader trend observation)
Built With: Pine Script v5
A structured, educational EMA fusion framework designed to help traders visually study trend transitions, slope behavior, and volume-based momentum shifts.
📌 Overview
The STWP Unified EMA Band merges High–Low–Close fusion logic with crossover detection and volume context to offer a clear visual understanding of trend behavior.
It is designed for traders who want to observe trend transitions, analyze momentum health, and study how volume supports or contradicts directional bias.
Internally, it uses an optimized EMA 9–21 fusion structure to identify directional shifts with precision and stability — a balance developed through the STWP methodology for consistent, unbiased trend evaluation.
This enhanced edition introduces a Crossover Engine for smoother transitions, adaptive band coloring, and a real-time educational dashboard that provides instant feedback on trend and volume strength.
📸 Chart Previews (Educational Examples)
1️⃣ Bullish Momentum Phase
🔗
📈 A bullish crossover where the fast EMA overtakes the slow EMA.
Observe the slope steepening and the dashboard confirming trend expansion.
2️⃣ Bearish Momentum Phase
🔗
📉 Displays a bearish crossover with slope weakening and band compression.
The dashboard highlights a transition to bearish bias with corresponding volume context.
⚠️ Snapshots are for educational reference only — not trading signals or recommendations.
📌 Key Features
✅ Dual EMA Band using High–Low–Close fusion logic
✅ Dynamic bullish/bearish band coloring
✅ Mid-band slope indicator with momentum feedback
✅ Volume strength classification (Strong / Moderate / Weak)
✅ Contextual crossover labels with real-time commentary
✅ Auto-removable exit labels for clean visualization
✅ Built-in educational STWP Dashboard (trend, slope, and volume insights)
✅ User-customizable color palette and toggles
✅ Compatible across intraday and swing setups
📊 STWP Dashboard Summary
A compact real-time data panel offering:
📈 Trend Status: Bullish / Bearish / Neutral
📊 Volume Condition: Strong / Moderate / Low
📉 Slope Direction: Rising / Falling / Flat
🕓 Last Signal Info: Timestamp, price, and strength context
The dashboard helps users learn how volume, slope, and structure interact dynamically during different market phases.
💡 Educational Use Cases
This tool is ideal for traders who want to:
Study momentum evolution through moving averages
Understand EMA slope and compression behavior
Observe how volume validates or contradicts trend strength
Build structured, observation-based learning habits
Develop discipline in recognizing trend exhaustion zones
It is meant as a visual study framework, not as a trading signal generator.
⚙️ Customization Options
Toggle crossover triangles and labels
Optional exit markers (auto-hide after signal)
Show or hide trend background shading
Customizable color settings for each phase
Enable or disable dashboard view
📆 Best Practice for Use
1️⃣ Apply to liquid assets or major indices for reliable band behavior.
2️⃣ Use primarily on 5-min to 1-hour charts to study intraday transitions clearly.
3️⃣ Optionally view on the Daily TF to understand higher-structure slope alignment and long-term trend health.
4️⃣ Observe how slope, band color, and volume interact during trend acceleration and contraction.
5️⃣ Treat dashboard readings as educational context, not trading triggers.
6️⃣ Combine with price structure, volume profile, or demand–supply zones for deeper observation.
⚠️ Important Notes
✅ Designed purely for learning and educational exploration
✅ No trading automation or signal generation included
✅ Does not provide entries, exits, or investment advice
✅ Built to promote structured observation and discipline in analysis
❌ Avoid using on higher timeframes for rapid setups — bands adjust slower there
📐 Glossary
EMA – Exponential Moving Average
HLC – High, Low, Close
Slope – Directional gradient of the mid-band
Volume Ratio – Current volume ÷ 20-bar average
Crossover – Fast EMA crossing Slow EMA
STWP – Simple Trade With Patience
💬 Philosophy Behind the Tool
Developed under the STWP methodology — Simple Trade With Patience — this indicator encourages traders to focus on learning the rhythm of the market, not chasing trades.
Every color, label, and slope change is designed to help users see what price action is communicating rather than predict outcomes.
⚠️ Disclaimer
This indicator is created solely for educational and informational purposes.
It does not constitute financial advice, a trading signal, or an investment recommendation.
Trading involves significant risk and may not be suitable for all participants.
Always consult a SEBI-registered financial advisor or licensed professional before making trading or investment decisions.
The author is not liable for financial loss resulting from the use or interpretation of this script.
By using this tool, you acknowledge and accept these terms.
🤝 Final Note
Built with precision and patience by simpletradewithpatience (STWP) — for traders who value structured learning and objective analysis.
Observe deeply. Learn continuously. Trade with discipline.
📈 Trade Less. Learn More. Let Patience Work for You.
🔒 Script Protection Note
This script is published under Protected visibility to maintain data integrity and prevent unauthorized modification.
The logic remains fully usable for all users while keeping the internal code structure secure — ensuring a safe, stable, and educational experience for everyone.

Nifty Futures Momentum ScalperNifty Futures Momentum Scalper
Backtesting
VPA , RSI, momentum trades with EMA crossover

ONLY LONG – 4H Breakout → 1H EMA(12/21) [Signals]🔹 ONLY LONG – 4H Breakout → 1H EMA(12/21)
Author: SystemsOverFeelings
Type: Signal-only indicator (non-repainting)
Timeframe: Designed for the 1H chart
Markets: BTCUSDT perpetual& major pairs
📖 Concept
A high-timeframe confirmation model for trend-continuation longs.
It detects:
A 4-Hour breakout candle closing above recent range highs,
With very-high volume confirmation, and
Then waits for a 1-Hour pullback into the EMA(12/21) band or a Break of Structure (BOS) to re-enter.
No repainting — all 4H logic uses request.security(..., lookahead_off) for confirmed data.
🧩 Signal Logic
✅ 4H Trigger: Breakout candle with volume > SMA(20) × user multiplier.
✅ Armed Regime: Green background = system ready for 1H entries.
🟢 LONG Signal: 1H candle consolidates inside or touches the EMA band, or shows BOS confirmation.
❌ EXIT Signal: 4H EMA(12) crosses below EMA(21).
All signals are visually marked and alert-ready.
⚙️ Adjustable Parameters
4H volume multiplier
Range lookback days
Pullback strictness (inside/touch)
1H BOS pivot length & mode
Expiry time for invalidated setups
🔔 Alerts
Built-in alerts for:
4H breakout trigger
1H long entry signal
4H band exit
Use them directly via “Create Alert → Condition → This Script → Choose Signal.”
💡 Notes
Works best on BTC/ETH 1H chart.
Non-repainting, multi-timeframe logic.
Use for directional bias or entry timing — not financial advice.

9 EMA and 20 MA with Fill9 EMA and 20 MA with Fill
puts a fill green or red weather whichway the trend is going

Quantura - Average Intraday Candle VolumeIntroduction
“Quantura – Average Intraday Candle Volume” is a quantitative visualization tool that calculates and displays the average traded volume for each intraday time position based on a user-defined historical lookback period. It allows traders to analyze recurring intraday volume patterns, identify high-activity sessions, and detect liquidity shifts throughout the trading day.
Originality & Value
This indicator goes beyond standard volume averages by normalizing and aligning volume data according to the time of day. Instead of simply smoothing recent bars, it builds an intraday volume profile based on historical daily averages, enabling users to understand when during the day volume typically peaks or drops.
Its originality and usefulness come from:
Converting standard volume data into time-aligned intraday averages.
Visualization of historical intraday liquidity behavior, not just total daily volume.
Dynamic scaling using normalization and transparency to emphasize active and quiet periods.
Optional day-separator lines for precise intraday structure recognition.
Gradient-based coloring for better visual interpretation of volume intensity.
Functionality & Core Logic
The indicator divides each day into discrete intraday time positions (based on chart timeframe).
For each position, it stores and updates historical volume values across the selected number of days.
It calculates an average volume per time position by aggregating all stored values and dividing them by the number of valid days.
The result is plotted as a continuous histogram showing typical intraday volume distribution.
The bar colors and transparency dynamically reflect the relative intensity of volume at each point in the day.
Parameters & Customization
Number of Days for Averaging: Defines how many past days are included in the volume average calculation (default: 365).
UTC Offset: Allows synchronization of intraday cycles with local or exchange time zones.
Base Color: Sets the main color for plotted volume columns.
Color Mode: Choose between “Gradient” (transparency dynamically adjusts by intensity) or “Normal” (fixed opacity).
Day Line: Toggles dashed vertical lines marking the start of each trading day.
Visualization & Display
Volume is plotted as a series of histogram bars, each representing the average volume for a specific intraday time position.
A gradient color mode enhances readability by fading lower-intensity areas and highlighting high-volume regions.
Optional day-separator lines visually segment historical sessions for easy reference.
Works seamlessly across all chart timeframes that divide the 24-hour day into regular bar intervals.
Use Cases
Identify when trading activity typically peaks (e.g., session opens, news windows, or overlapping markets).
Compare current intraday volume to historical averages for early anomaly detection.
Enhance algorithmic or discretionary strategies that depend on volume-timing alignment.
Combine with volatility or price structure indicators to confirm market activity zones.
Evaluate session consistency across different time zones using the UTC offset parameter.
Limitations & Recommendations
The indicator requires intraday data (below 1D resolution) to function properly.
Volume behavior may vary across brokers and assets; adjust averaging period accordingly.
Does not predict price movement — it provides volume-based context for analysis.
Works best when combined with structure or momentum-based indicators.
Markets & Timeframes
Compatible with all intraday markets — including crypto, Forex, equities, and futures — and all intraday timeframes (from 1 minute to 4 hours). It is particularly valuable for analyzing assets with continuous 24-hour trading activity.
Author & Access
Developed 100% by Quantura. Published as a Open-source script indicator. Access is free.
Important
This description complies with TradingView’s Script Publishing and House Rules. It provides a clear explanation of the indicator’s originality, logic, and purpose, without any unrealistic performance or predictive claims.

9 & 20 EMA Cross Alert 9 and 20 EMA will be put on chart. Bull and bear signal will appear when EMAs cross. Alert is available when EMAs cross.

Cloud and Table - Ostinato TradingMain indicator of Ostinato Trading, the moving averages cloud and table. You can superpose various moving averages, bollinger bands and their color fill. Additionaly the table is used to plot the distance from the price to moving averages, the ATR value, the stop loss ... You can also plot a bulls eyes of SL and TP in points to visualise it on the chart.

Close Below MAClose Below MA (SMA or EMA)
This indicator helps traders quickly identify when a candle closes below a moving average — a classic signal of potential bearish momentum or a shift in trend.
You can choose between Simple Moving Average (SMA) or Exponential Moving Average (EMA) from a convenient dropdown menu, and customize the MA length to fit your strategy.
When a candle closes below the selected MA, a small black arrow appears above the bar, and an alert can be triggered for instant notifications.
Features:
Choose between SMA or EMA.
Adjustable MA length.
Visual signal (arrow) when the close is below the selected MA.
Built-in alert support
Usage Ideas:
Spot early signs of a bearish reversal.
Use alerts for automated trade monitoring.

XAUUSD Best Strategy - Buy/Sell SignalsThe best strategy to trade XAUUSD (gold) often depends on your trading style and market conditions, but several high-probability approaches are recommended by top traders and industry experts for both scalping and swing trading.
Trend-Following Using EMAs
Use a combination of 9-period and 21-period Exponential Moving Averages (EMA) on the 5-minute or 15-minute chart.
Enter long when the 9 EMA crosses above the 21 EMA, especially when overall trend aligns with higher timeframes (such as H1 or H4).
Confirm entries with an RSI value above 50 for buys (or below 50 for sells).
Set stop loss just below the latest swing low for long positions.
Ideal for fast-moving, trending sessions (London and New York overlap).


KD-NewAutoTrade for Future Trading - Heikin Ashi candles The KD-NewAutoTrade strategy is a dynamic trend-following indicator designed for scalping and swing trading across crypto, forex, and index futures. It combines the precision of EMA crossovers, RSI momentum, and ADX trend strength to deliver clear Buy/Sell signals with high reliability.
🔹 Core Logic
EMA Fast & Slow Crossover – Identifies short-term and long-term trend shifts.
RSI Confirmation – Filters out false signals by requiring RSI to cross custom Buy/Sell thresholds.
ADX Filter – Ensures trades only trigger when market trend strength exceeds your chosen ADX minimum.
🔹 Key Features
Visual Buy/Sell triangles directly on the chart.
Customizable inputs for EMA, RSI, and ADX lengths.
Works efficiently on all timeframes and all markets (Crypto, Indices, Stocks, Commodities).
Optional background highlights for active trade zones.
Alert conditions for both BUY and SELL setups – ready to use in automated strategies or alert bots.
🔹 Recommended Usage
Use Heikin Ashi candles
Works best on 1M - 5M timeframes.
Combine with volume or higher-timeframe trend confirmation for stronger signals.


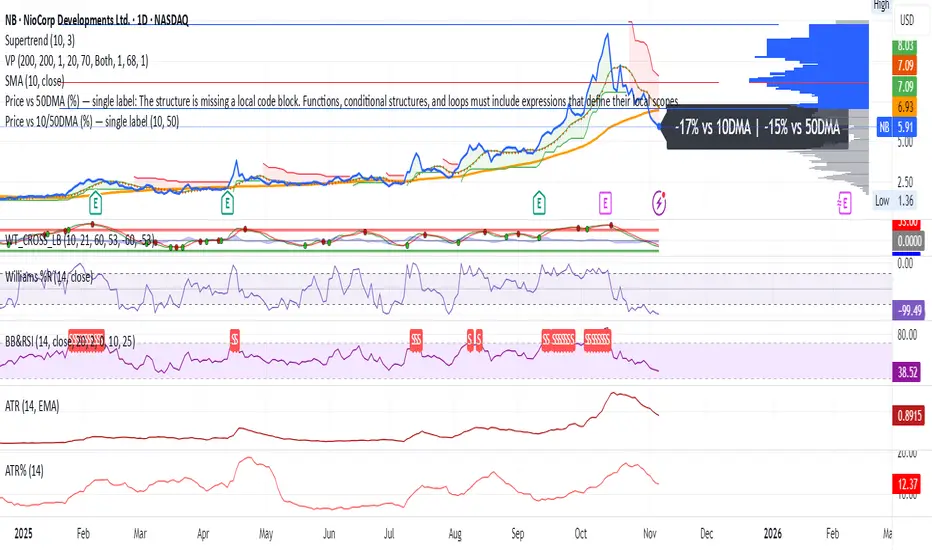
Price vs 10/50DMA (%) — single labelThis TradingView script shows how far the current price is from its 10-day and 50-day moving averages (DMAs), expressed as percentages, and displays both values as a single label near the latest candle — for example, “+3% vs 10DMA | +8% vs 50DMA.” You can switch between simple and exponential moving averages using the “Use EMA” checkbox, and adjust the period lengths in the input panel. To use it, simply copy the code into TradingView’s Pine Editor, click Add to chart, and you’ll see one live label updating each bar along with the plotted 10- and 50-day average lines.

Henry's MA & RSProviding 10 21 50 200 MA and RS rating based on S&P 500, basically for US stocks. Enjoy!

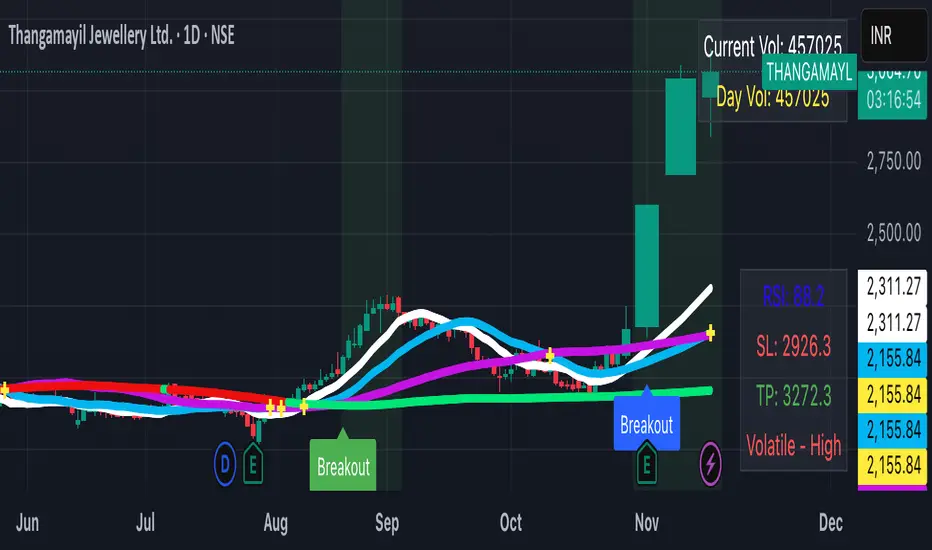
Blavk Terminal By Blavk Core Capitals- Open📘 Blavk Terminal
Multi-Indicator Trend & Momentum Detection System
Overview:
The Blavk Terminal indicator helps traders identify breakout and breakdown zones, market trend direction, and volatility conditions. It combines multiple well-known analytical concepts to generate reliable visual and alert-based trading signals.
🔍 Core Concepts
Trend Analysis: Uses layered moving averages (short to long-term) to identify price direction and trend strength.
Momentum Detection: Applies RSI-based logic to highlight potential breakout (bullish) and breakdown (bearish) areas.
Volatility Filter: Integrates ATR-based dynamic ranges to show stop-loss, target, and volatility status, helping traders manage positions more efficiently.
Volume Tracking: Displays both current candle volume and daily cumulative volume to assess participation strength.
⚙️ How to Use
On 15-minute charts, it can assist with swing trading and short-term momentum entries.
On daily, it helps with position or long-term holdings by confirming broader trend direction.
Traders can monitor green breakout/breakdown labels, confirm trend bias using moving averages, and use the displayed ATR levels for risk management.
💡 Conceptual Summary
Blavk Terminal integrates trend-following (moving averages), momentum confirmation (RSI), and volatility control (ATR) into a single tool.
This combination helps identify high-probability opportunities and supports decision-making across both short-term swing trades and long-term positional holds.
⚠️ Disclaimer
This indicator is for educational and analytical purposes only. It does not provide financial advice or guaranteed outcomes. Always backtest and apply risk management before live trading.
@blavkcorecapitals
coinbot_ICT_Unicorn(AUTOTRADE)1. 🎯 핵심 기능: 자동매매 신호 전송 (Webhook)
이 스크립트는 매매 신호가 발생할 때마다, 사용자가 '자동매매 설정(Autotrade Settings)'에 입력한 값들을 조합하여 구체적인 JSON 메시지를 생성하고 alert() 함수를 통해 웹훅으로 전송합니다.
입력 설정: user_id, exchange(거래소), leverage(레버리지), capital_percent(투입 시드 %), sl_percent(손절 %), 그리고 3단계 분할 익절(tp1_price_percent, tp1_qty_percent 등) 설정을 입력받습니다.
신호 종류:
ENTRY (진입): 매수(buy) 또는 매도(sell) 신호가 발생하면, 위 모든 설정값을 포함한 진입 명령을 보냅니다.
CLOSE (손절): 전략의 내부 로직에 의해 손절가에 도달하면(slAlertTick), 포지션을 종료하라는 신호를 보냅니다.
TAKE_PROFIT (익절): 목표가에 도달하면(tpAlertTick), 설정된 물량만큼 익절하라는 신호를 보냅니다.
2. 📈 작동 원리: "ICT 유니콘" 매매 전략
이 스크립트의 진입 로직은 ICT(Inner Circle Trader) 개념 중 하나인 **'유니콘 모델'**을 따릅니다.
구성 요소 식별:
Breaker Block (BB): '브레이커 블록'을 식별합니다. 이는 특정 고점/저점을 만든 후 그 방향으로 가지 못하고 반대 방향으로 돌파(Break)된 오더 블록(Order Block)입니다.
Fair Value Gap (FVG): '공정 가치 갭' (가격 불균형 영역)을 식별합니다.
핵심 진입 신호 (Unicorn): 이 전략의 핵심 진입 조건은 **Breaker Block(BB)과 Fair Value Gap(FVG)이 중첩(Overlap)**되는, 소위 '유니콘'이라 불리는 강력한 지지/저항 영역이 발생하는 것입니다.
Long (매수) 진입:
가격이 하락하며 **'하락형 브레이커 블록(Bearish Breaker Block)'**을 만듭니다.
이후 가격이 상승 돌파하며 이 브레이커 블록 영역과 중첩되는 **'상승형 FVG(Bullish FVG)'**를 생성합니다.
이 중첩 영역(FVG-BB Overlap)이 바로 매수 진입의 근거가 됩니다. (코드가 dbgRequireRetracement 설정에 따라 FVG로의 되돌림을 기다리거나 즉시 진입 신호를 보냅니다.)
Short (매도) 진입:
가격이 상승하며 **'상승형 브레이커 블록(Bullish Breaker Block)'**을 만듭니다.
이후 가격이 하락 돌파하며 이 브레이커 블록 영역과 중첩되는 **'하락형 FVG(Bearish FVG)'**를 생성합니다.
이 중첩 영역이 매도 진입의 근거가 됩니다.
3. 📊 부가 기능
시각화: 차트 상에 FVG 영역과 Breaker Block 영역을 박스로 그려주어(설정에 따라 표시/숨김 가능) 매매 근거를 시각적으로 확인할 수 있게 합니다.
백테스팅 대시보드: 차트 우측 상단(기본값)에 이 전략의 누적 성과(총 진입 횟수, 승/패, 승률, 총수익률)를 보여주는 대시보드를 표시합니다.
요약
이 스크립트는 **"Breaker Block과 FVG의 중첩(유니콘 모델)"**을 유일한 진입 조건으로 사용하는 매우 구체적인 ICT 전략입니다. 이 조건이 충족되면, 사용자가 미리 설정한 상세한 리스크 관리 값들을 담아 자동매매 봇으로 즉시 실행 가능한 주문 신호를 전송하는 '올인원(All-in-One)' 전략 스크립트입니다.
요청하신 대로, 해당 지표 요약본을 영어로 번역하여 제공합니다.
This script is an automated trading (Autotrade) strategy signal generator based on the ICT "Unicorn" trading model.
As the "AUTOTRADE" in its name implies, the core purpose of this indicator is to detect specific conditions on the chart and send JSON-formatted order signals (webhooks) to an external automated trading bot.
Here are the core mechanics and features of this script:
1. 🎯 Core Feature: Automated Signal Transmission (Webhook)
Whenever a trade signal occurs, this script generates a specific JSON message by combining the values entered by the user in the "Autotrade Settings" and sends it via webhook using the alert() function.
Input Settings: It takes inputs for user_id, exchange, leverage, capital_percent (equity %), sl_percent (stop loss %), and settings for 3-stage split take-profits (e.g., tp1_price_percent, tp1_qty_percent).
Signal Types:
ENTRY: When a "buy" or "sell" signal occurs, it sends an entry command including all the settings above.
CLOSE (Stop-Loss): If the price hits the stop loss according to the strategy's internal logic (slAlertTick), it sends a signal to close the position.
TAKE_PROFIT: When a profit target is reached (tpAlertTick), it sends a signal to take profit on the specified quantity.
2. 📈 How It Works: The "ICT Unicorn" Strategy
The script's entry logic follows the "Unicorn Model," one of the concepts from ICT (Inner Circle Trader).
Identifying Components:
Breaker Block (BB): It identifies a "Breaker Block." This is an Order Block that, after creating a specific high/low, fails to continue in that direction and is instead broken through in the opposite direction.
Fair Value Gap (FVG): It identifies a "Fair Value Gap" (a price imbalance area).
Core Entry Signal (The Unicorn): The core entry condition for this strategy is the overlap of a Breaker Block (BB) and a Fair Value Gap (FVG), which creates a powerful support/resistance zone known as the "Unicorn."
Long Entry:
Price moves down, creating a "Bearish Breaker Block."
Subsequently, price breaks upward, creating a "Bullish FVG" that overlaps with this Breaker Block area.
This overlapping area (FVG-BB Overlap) becomes the basis for the long entry. (Depending on the dbgRequireRetracement setting, the code either waits for a retracement to the FVG or sends an immediate entry signal.)
Short Entry:
Price moves up, creating a "Bullish Breaker Block."
Subsequently, price breaks downward, creating a "Bearish FVG" that overlaps with this Breaker Block area.
This overlapping area becomes the basis for the short entry.
3. 📊 Additional Features
Visualization: It draws the FVG and Breaker Block zones as boxes on the chart (can be toggled in settings), allowing for visual confirmation of the trade setup.
Backtesting Dashboard: It displays a dashboard in the top-right corner (by default) showing the strategy's cumulative performance (total entries, wins/losses, win rate, total profit).
Summary
This script is a highly specific ICT strategy that uses the "overlap of a Breaker Block and an FVG (the Unicorn Model)" as its sole entry condition. When this condition is met, it transmits an immediately executable order signal to an automated trading bot, complete with all the detailed risk management values preset by the user. It is an "all-in-one" strategy script.

CoinBot_Volumatic VIDYA Strategy이 스크립트는 **"모멘텀에 적응하는 VIDYA와 ATR 밴드를 이용한 돌파 추세 추종 전략"**입니다.
트렌드가 시작되는 지점(밴드 돌파)에서 진입 신호를 발생시키고, 이 신호를 JSON 메시지로 만들어 자동 매매 봇으로 전송하는 올인원(All-in-One) 전략 스크립트입니다. 사용자는 리스크 관리 설정(SL/TP)과 웹훅 정보만 입력하면 됩니다.
This script is "a breakout trend-following strategy using momentum-adaptive VIDYA and ATR bands."
It generates entry signals at the point where a trend begins (a band breakout), converts these signals into a JSON message, and sends them to an automated trading bot. It is an all-in-one strategy script. The user only needs to input their risk management settings (SL/TP) and webhook information.

TFX AVERAGESThis indicator created by TFX features the EMA's of 5, 10, 20, 50, 200. These indicators will show the averages of candles.

dO / wO / mO + MA 50/200 + PrevDay H/L Description
This indicator plots key reference levels used by professional traders:
Daily Open (dO)
Weekly Open (wO)
Monthly Open (mO)
Previous Day High (pdH) and Previous Day Low (pdL)
Moving Averages: 50 & 200 SMA
Each level is drawn as a clean dotted white line with a fixed label directly on the price chart.
All levels can be individually toggled on or off via checkboxes in the settings panel.
The pdH/pdL lines start exactly from the candles that created them, providing clear structure for breakout, retracement, and liquidity analysis.
The 50/200 SMA are included for long-term trend context.
This tool is designed for traders who rely on multi-timeframe structure and precision levels for both intraday and swing strategies.
Features
Toggle visibility for dO, wO, mO, pdH, and pdL
Accurate placement of previous day levels
Lightweight and responsive
Clean minimal visual design
Supports any symbol and timeframe
Usage Notes
Perfect for confluence-based trading:
Combine pdH/pdL with session opens to identify key liquidity zones
Use SMA 50/200 for directional bias
Works on crypto, forex, indices, and equities

Is it Time for a Pullback? Check Bars Since MA TestAn old market adage declares that “prices never move in a straight line.” Dips occur even in bullish markets. But how can traders know when prices may be due for a pullback?
Today’s script tries to answer that question by asking how many bars have passed since a stock, index or other symbol has tested a given moving average. Long periods of time without touching a line such as the 50-day simple moving average, for example, could prompt traders to be more patient.
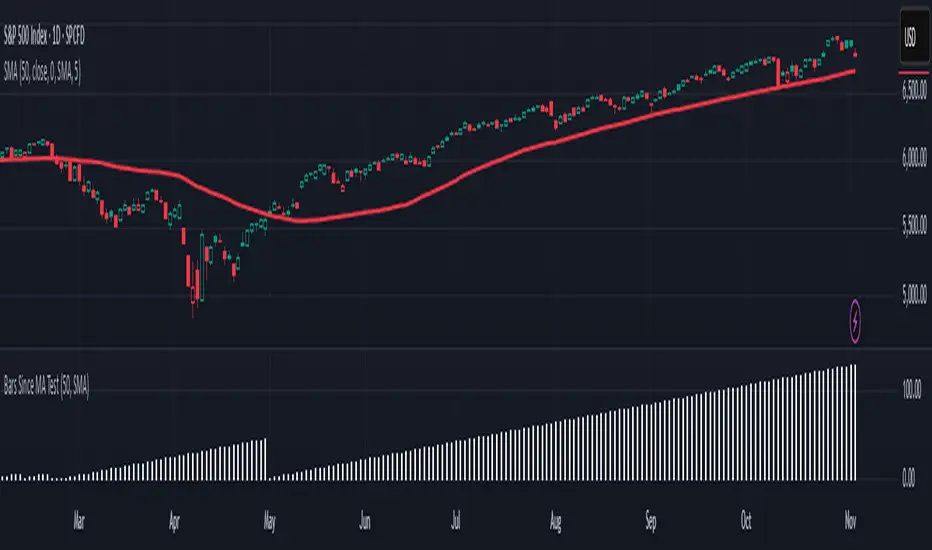
Bars Since MA Test counts how many bars have passed since prices touched or crossed the MA in question. The resulting value is plotted in a simple histogram. Users can set the MA length and type. By default, it uses the 50-day simple moving average (SMA).
The chart above applies Bars Since MA Test to the S&P 500. It shows that the index has gone 129 bars without testing its 50-day SMA. That’s the longest since a 146-bar stretch between July 2006 and February 2007.
Other longer runs include January-August 1995 (156 bars), November 1960-June 1961 (144 bars) and April-November 1958 (158 bars).
Given the small number of comparable readings, could traders suspect the current advance is getting long in the tooth?
TradeStation has, for decades, advanced the trading industry, providing access to stocks, options and futures. If you're born to trade, we could be for you. See our Overview for more.
Past performance, whether actual or indicated by historical tests of strategies, is no guarantee of future performance or success. There is a possibility that you may sustain a loss equal to or greater than your entire investment regardless of which asset class you trade (equities, options or futures); therefore, you should not invest or risk money that you cannot afford to lose. Online trading is not suitable for all investors. View the document titled Characteristics and Risks of Standardized Options at www.TradeStation.com . Before trading any asset class, customers must read the relevant risk disclosure statements on www.TradeStation.com . System access and trade placement and execution may be delayed or fail due to market volatility and volume, quote delays, system and software errors, Internet traffic, outages and other factors.
Securities and futures trading is offered to self-directed customers by TradeStation Securities, Inc., a broker-dealer registered with the Securities and Exchange Commission and a futures commission merchant licensed with the Commodity Futures Trading Commission). TradeStation Securities is a member of the Financial Industry Regulatory Authority, the National Futures Association, and a number of exchanges.
TradeStation Securities, Inc. and TradeStation Technologies, Inc. are each wholly owned subsidiaries of TradeStation Group, Inc., both operating, and providing products and services, under the TradeStation brand and trademark. When applying for, or purchasing, accounts, subscriptions, products and services, it is important that you know which company you will be dealing with. Visit www.TradeStation.com for further important information explaining what this means.
Ultimate Scalping IndicatorOverview
The Confluence Signal Indicator is a precision-built scalping tool designed to identify high-probability reversal points in the market.
It combines three core technical elements:
Trend
Mean reversion
Momentum
into a single, efficient system.
By filtering out weak RSI signals and focusing only on setups that align with trend direction and recent momentum shifts, this indicator delivers cleaner and more accurate short-term trade signals.
Core Components
200-Period Moving Average (MA200, 5-Minute Timeframe)
The MA200 is always calculated from the 5-minute chart, regardless of your current timeframe. It defines the macro trend direction and ensures that all trades align with the prevailing momentum.
Session VWAP (Volume-Weighted Average Price)
The VWAP tracks the real-time average price weighted by volume for the current trading session. It acts as a dynamic mean-reversion level and helps identify key areas of institutional activity and short-term balance.
RSI (Relative Strength Index)
The indicator uses a standard 14-period RSI to detect overbought and oversold market conditions.
A “recency filter” is added to ensure signals only appear when RSI has recently transitioned from strength to weakness or vice versa, reducing false signals in trending markets.
Signal Logic
Bullish Signal (Green Arrow)
A bullish reversal signal is plotted below a candle when:
Price is above both the 5-minute MA200 and the Session VWAP.
RSI is oversold (below 30).
The last time RSI was above 50 occurred within the last 10 candles before going oversold.
This ensures that the dip is a fresh pullback within an uptrend, not a prolonged oversold condition.
Bearish Signal (Red Arrow)
A bearish reversal signal is plotted above a candle when:
Price is below both the 5-minute MA200 and the Session VWAP.
RSI is overbought (above 70).
The last time RSI was below 50 occurred within the last 10 candles before going overbought.
This ensures that the overbought reading follows a recent move from weakness, identifying potential short entries in a downtrend.
Recommended Usage
This is a scalping-focused indicator, intended for use on timeframes of 5 minutes or lower. Therefore I would highly recommend to use it on Equity futures trading, such as NQ!, ES!, GC! and so on.
It performs best when combined with additional tools such as support and resistance zones, order blocks, or liquidity levels for context.
Avoid counter-trend signals unless confirmed by price structure or volume behavior.
