Initial Balance Markets Time ZonesThe below script is based on Initial Balance.
Initial Balance is based on the highest and lowest points of Price Action (PA) within the first 60 minutes of trading. There is so much information available online, reference Initial Balance, that I have not provided a reference.
Most indicators I have seen have been solely based on UTC 0000 Initial Balance. My aim with this indicator was to be able to visualize how other time zones market openings Initial Balance affect PA.
The three market openings I chose to code in are:
London 0800 to 0900
New York 1430 to 1530
Asia 0000 to 0100
Within the script I have given the user the option to select to see with a green or red background when PA is above all zones Initial Balance high (green) or PA is below all zones Initial Balance low (red).
Alerts are also coded in, to prompt the user that PA has gone above or below as per above.
The Initial Balance high and lows also offer another form of areas of confluence.
Below are some examples of IB in action:
LTC
NULS
UNFI
DEXE
Open

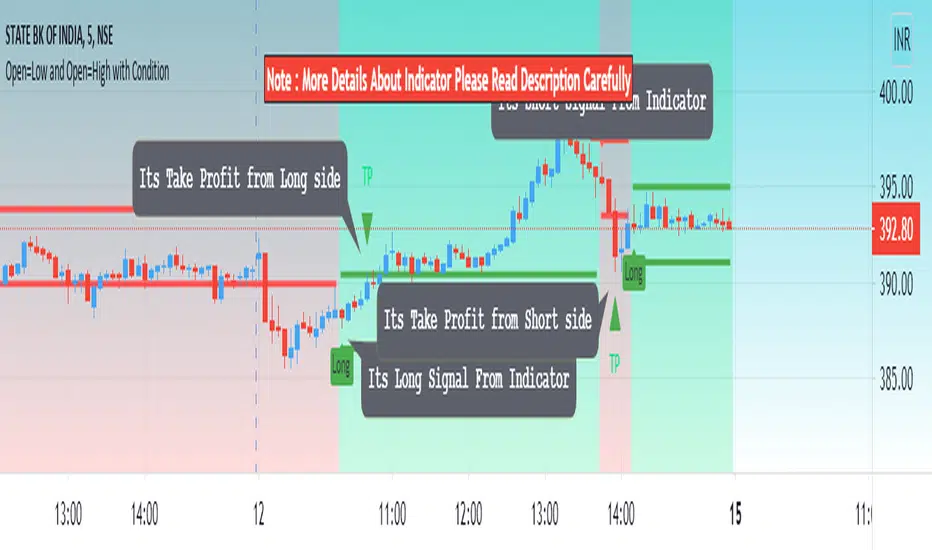
Open=Low and Open=High with ConditionHello Everyone Its indicator Base On Candle (Bar)
How to work its indicator?
➤ if Open = low and pervious bar close > open when Long signal and if Open = High and pervious bar close < open When Short
Indicator Feature
➤ Long Signal with Alert
➤ Short Signal with Alert
➤ Take Profit with Alerts calculated by Long or Short Bar Open You can also choose Percentage or Point by default percent
➤ Trailing Stop Loss with Alerts
Important: This Indicator we are using for Automation Trading if You Want This Indicator Access, Please Contact me PM on Tradingview
Pre and Market OpeningsPre and Market Openings is to enable you to quickly visualize the opening markets and how they could influence trading.
The below script has used the market time data from the below links:
Tokyo/Asia www.tradinghours.com
London www.tradinghours.com
New York www.tradinghours.com
The below script aims to plot:
Daily Asia Open
Weekly Asia Open
Daily London Open
Weekly London Open
Daily New York Open
Weekly New York Open
Using background colour it also shows market sessions (pre-market) for London and New York and regular for London, New York and Asia.
There is also plotted text for days of the week and sessions.
As you can see from the picture below that these market openings can act as support and resistance:
BTC
ETH

VFFVFluctuations to Volume desired to change the price.
to identifying which parameter of ask/bid (Technical ) or News (fundamental) parameters are changing the market I think this formula is enough !!!!
thanks for use and share your comments
Trading Ideas - Chart Champions Value - Points of Interest Trading Ideas is based on having visual Points of Interest.
The indicator displays:
- dOpen : Daily Open
- dPOC: Developing Point of Control
- pdPOC : Previous Day Point of Control
- dbyPOC : Day Before Yesterday Point of Control
Initial Balance (High, low, mid points for the first hour (UTC 0000)
- IB High : Initial Balance High
- IB Mid : Initial Balance Middle
- IB Low : Initial Balance Low
Chart Champions Value ( CCV ) is based on Daniel - Chart Champions theory explained in his educational videos.
That if the previous day is a range day and price action (PA) closes:
Above the previous days Value Area High (pdVAH) then there is an 80% chance of it retracing back to previous days Value Area Low (pdVAL)
Below the previous days Value Area Low (pdVAL) then there is an 80% chance of it going back up to the previous days Value Area High (pdVAH)
The CCV check can be ticked on and off for a quick visual to see if the setup could potentially be in play (if green then CCV could be play for that day).
Settings/Configuration
The calculated Value Area (VA) can be amended.
It is recommend to change the resolution to that of your symbol. For example BTC resolution 1, XRP resolution 0.00001.
As seen below having key Points of Interest can make you think twice before going into a trade:
My thanks go to:
ahancock for allowing usage of his script.
AnyDozer and Bjorn Mistiaen on Stack Overflow for all their assistance.
Any feedback will be gratefully received.

Combo VIX and DXYHello traders
It's been a while :)
I wanted to share a cool script that you can use for any asset class.
The script isn't really special - though what it displays is super helpful
Volatility Index $VIX
(Source: Wikipedia)
VIX is the ticker symbol and the popular name for the Chicago Board Options Exchange's CBOE Volatility Index, a popular measure of the stock market's expectation of volatility based on S&P 500 index options.
It is calculated and disseminated on a real-time basis by the CBOE, and is often referred to as the fear index or fear gauge.
I consider that a $VIX above 30% is a very bearish signal.
Above 30% translating investors selling in masse their assets. #blood #on #the #street
Dollar Index $DXY
(Source: Wikipedia)
The U.S. Dollar Index (USDX, DXY, DX, or, informally, the "Dixie") is an index (or measure) of the value of the United States dollar relative to a basket of foreign currencies, often referred to as a basket of U.S. trade partners' currencies.
The Index goes up when the U.S. dollar gains "strength" (value) when compared to other currencies.
The index is designed, maintained, and published by ICE (Intercontinental Exchange, Inc.), with the name "U.S. Dollar Index" a registered trademark.
It is a weighted geometric mean of the dollar's value relative to following select currencies:
Euro (EUR), 57.6% weight
Japanese yen (JPY) 13.6% weight
Pound sterling (GBP), 11.9% weight
Canadian dollar (CAD), 9.1% weight
Swedish krona (SEK), 4.2% weight
Swiss franc (CHF) 3.6% weight
In "bear markets", the $DXY usually goes up.
People are selling their hard assets to get some $USD in return - pumping the $DXY higher
Corollary
I'm not sure which one happens first between a bearish $DXY or bearish $DXY... though both are usually correlated
If:
- $VIX goes above 30%, usually $DXY increases and assets versus the good old' $USD drop
- $VIX goes below 30%, usually $DXY decreases and assets versus the good old' $USD increases
This is a nice lever effect between both the $VIX, $DXY and the assets versus the $USD
That's being said, I don't only use those 2 information to enter in a trade.
It gives me though a strong confirmation whenever I'm long or short
Imagine I get a LONG signal but the combo $VIX + $DXY is bearish... this tells me to be cautious and to:
- enter at a pullback
- protect my position quickly at breakeven
- take my profit quick
For a mega bull market (some called it hyperinflation), you want your fiat to drop in value for the counter-asset to increase in value.
And before you ask.... yes I look at what $DXY is doing before taking a trade on $BTCUSD :)
In other words, $DXY going down is quite bullish for Bitcoin.
Settings and Alerts
The settings by default are the ones I use for my trading.
The background colors will be colored whenever the COMBO is bullish (green) or bearish (red)
Alerts are enabled using the brand new alert function published last week by @TradingView
That's it for today, I hope you'll like it :)
PS: In this chart above, I'm using the Supertrend indicator from @KivancOzbilgic
Dave

Key Levels SpacemanBTC IDWMKey levels, plotted automatically
Additional timeframes can be added on request
Useful for seeing strength of the trend in the market

Key Levels TheHuntThis indicator is made to show you some key levels on the chart on the different timeframes. You can hide them or show them in the settings. The levels are the Monthly Weekly and Daily opens, current monthly, weekly and daily high / low, last weeks high / low & last daily high / low as well as Monday high and low. These levels can be used as key pivots or key liquidity areas. You can also adjust the time to also use the correct Mon range for forex pairs.
As you can see on the chart, that is how the levels show up on the chart.


CME/FX/ICE Sunday OpenDIsplays a background color for CME futures open, forex market open, and ICE US futures open. Since there are varying opening hours for products offered, the opening hours are mainly for currencies, equity indexes, and precious metals.
Currently,
Forex markets open at 1700 EST
CME futures open at 1700 CST
ICE US futures open at 2000 EST
There are alerts for each open.

Yesterday's open, high, low and closeA very simple script to plot the yesterday's OHLC, to be used in an intraday graph.
There were other scripts like this, but their code was ugly, filthy, smelly, and WET, so I did this.

PT High Low Version 1.0 of our PT High Low indicator helps create a visual for the Daily, Weekly, Monthly & Yearly range. These levels will give you an idea of where the price can react if reached. Consider them pivotal areas. We included a toggle that will help you go between the candle's High/Low to the candle's Open/Close. Both features are unique when scalping & swinging. The High/Low will paint a beautiful visual for your day to day trading & the Open/Close will help you determine where price maxed opened & closed for that specified timeframe.
Strategy:
Price tends to gravitate between the Daily level when playing intraday scalps. If playing the weekly, you want to be above the weekly pivot to punt longs & under the weekly level to punt shorts. More likely than not, when the price hits a monthly or yearly level, we get a noticeable reaction off it.
This Oscillator was built around our buy sell indicator & it is used on all time frames for swinging & scalping. It is included as part of the library. Just message us for access!
Gowri_1.0 After going through various ORB stratergy, I wrote this pine script. This gives exact risk and quantity in the right side panel. so, risk management is always taken care of.
When to use: wait for the first five minutes after the market opens.
Which stocks: use with Market gainers after the first five minutes based on the signal.
Risk/reward: Say you have a capital of 50,000 and you want to risk 2% on one trade. So the risk comes out to be 1000. Means you can risk 1000 on one trade.
Let's say the stop loss on your setup comes out to be 5. Just divide the stop by the risk and that's the no. of shares you should trade. In this case 1000/5=200 shares.
Hunt for your targets:
Look for 1:1 or 1:2 target depending on the stop loss. If the stop is wide then go for just 1:1 or else go for 1:2
Tips for short plays:
This strategy works well on long trades rather than on the short side. As on the short side the action, most of the times, is very huge in the first 5 min bar which increases the risk on the trade. However you may apply ORB on the short side If the action is not very strong on the first bar and the stock actually develops a range for the first 30 minutes or so and then breaks it.

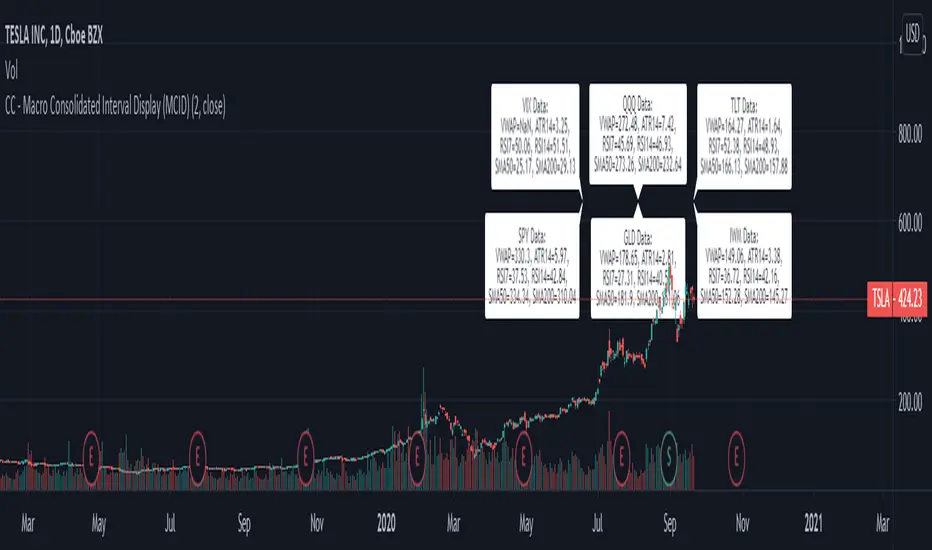
CC - Macro Consolidated Interval Display (MCID)Ever wish you didn't have to rapidly flip between 6 different tickers to get the full picture?
Yeah, me too. Do you also wish that you kind of understood how the shift / unshift function works for arrays?
Yeah, I did too. Both of those birds are taken care of with one stone!
The Macro Consolidated Interval Display uses the new Array structure and security to display data for VIX, GLD, TLT, QQQ, SPY and IWM (at a 1D interval) SIMUTANEOUSLY! Regardless of which ticker you're looking at you can get the full picture of macro futures data without flipping around to get it.
This is my first script trying to use arrays. It basically shows the following a 1d interval:
ATR14, RSI7, RSI14, SMA50, SMA200 and VWAP for VIX.
ATR14, RSI7, RSI14, SMA50, SMA200 and VWAP for GLD.
ATR14, RSI7, RSI14, SMA50, SMA200 and VWAP for TLT.
ATR14, RSI7, RSI14, SMA50, SMA200 and VWAP for QQQ.
ATR14, RSI7, RSI14, SMA50, SMA200 and VWAP for SPY.
ATR14, RSI7, RSI14, SMA50, SMA200 and VWAP for IWM
To make it more or less busy, I've allowed you to toggle off any of the levels you wish. I've also chosen to leave this as open source, as it's nothing too experimental, and I hope that it can gain some traction as an Array example that the public can use! If you don't like the different values that are shown, use this source code example as a spring-board to put values that you do care about onto the labels.
If this code has helped you at all please drop me a like or some constructive criticism if you do not think it's worth a like.
Good luck and happy trading friends. This should be compatible with my CID as well:
If this gets traction, I will post something similar for a dynamic combination of tickers and intervals that you can set yourself.
Highs Lows and OpensThis script is an update to a lovely script by BURSATRENDBANDCHART
There original script gave Daily, Weekly and Monthly Highs but I loved the format
I required
Previous Days Highs and Lows
Previous Week High and Low
Previous Day Open
Previous Week Open
Hope this can be of use

Perfect zonesAs the name says this script will be perfect.
There are 2 types of indicators in the market. Leading and Lagging.
I always prefer to choose a leading which can help me determine my trades future hand.
This script provides few levels which are not just leading but also perfect. This script can be used only on the current day/week/month and can't be used to predict the next sessions movement as this script uses current open price.
Open line - Line drawn based on the open of the candle. I feel this is one of the underrated line. This is a very powerful resistance and support line.
Average 10 days levels - These are just calculated based on average 10 previous days.
Logic is - since the script has stayed within the range for past 10 days it remains to stay in the same levels even today.
So on average this levels works 8/10 times which is very bigger in stock market.
Fibonnaci levels zones - This zone is derived from Thomas de-mark book. This is also a simple level where fibonnaci ratio is used to determine the levels from today's open.
Outer levels - They are also same fibonacci levels which are very much respected by all the stocks and indices.
Provided adjustment levels to determine the range for Day/Week/Month.
Added some code from one of my favorite indicator variable moving average. Thanks to the author of the script.
How to trade using this script.
Apply 10 days average and Fibonacci level zones in the chart
Range bound movement
When the stock open. Try to predict from price action whether the stock is going to be in a small range. Then do a strangle of the strikes just outside the zone.
Trending movement
When the stock seems to be little volatile both the levels applied act a good resistance. Take positions once the range in broken or reversal is happening from the level.
This script is unique because these are not drawn levels based on previous day unlike pivot or Fibonacci, current day open is important in this script.
tip - Use it in banknifty and Nifty with Range bound strategy I have mentioned above.
Happy trading.

Static + Dynamic LevelsShows static and dynamic levels which can act as support/resistance. These are important as there is a lot of users who are interested in buying/selling at these prices.
Static Levels include -
Daily/Weekly/Monthly/Yearly Open (changes color depending on if below or above price)
Previous Daily/Weekly/Monthly/Yearly Open
Previous day's High/Low
Dynamic Levels include -
100/200 Daily MA
100/200 Weekly MA

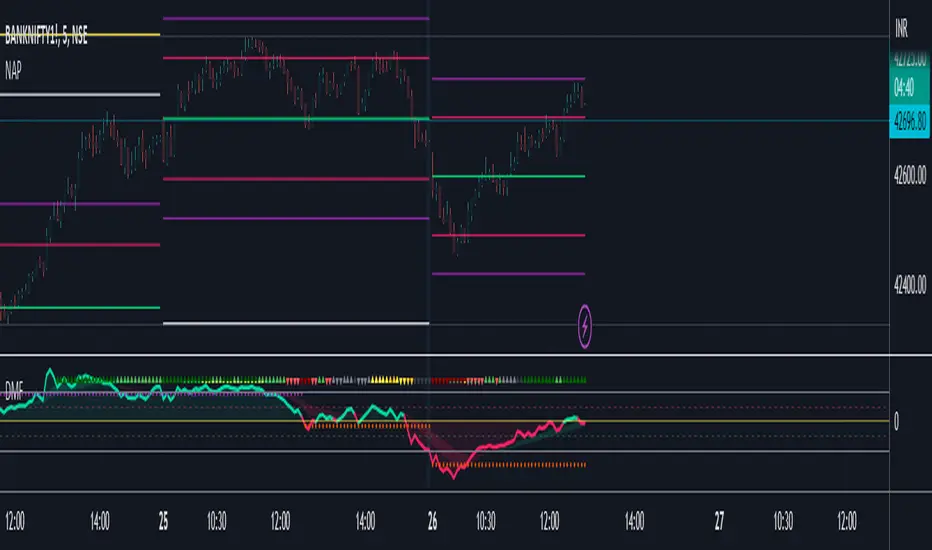
Decision MakerHere I propose a method to view only relevant decision-making zones for intraday and at that particular time. It is probably one of the cleanest ways to do this and have entire S/R system built-in without having clutter on the chart. This is great for discretionary traders to avoid confusion.
I'm here linking you examples of today;
As you can see, it only displays what is relevant at that particular time and helps you to make a decision in your trade according to it.
This script is for educational purposes only, any past performance is not an assurance of future success and the author does not take responsibility of your actions.
Enjoy~

New Age PivotsHere I'm proposing possibly the simplest and most relevant pivot style for intraday traders like me.
It utilizes fundamentals of the average range and devises S/R around that. Pivot point in this is today's open (colored lime), which is far more relevant than yesterday's/past data based pivots.
This is an attempt to reduce the influence of historical data as much as possible, as traders grow in their experience and skill, this becomes the newest and most successful methodology to stay profitable over the long run. Just my pov.
This is purely for educational purposes, no past performance be it visual or mathematical is a guarantee of success in the future. Use it at your own discretion.
The author takes no responsibility of your individual profit or loss. Also, the script will be checked protected for protection against theft, however, you can use it by adding to your favorites.
I've added the ability to hide and view historical S/R as well, it looks best when your chart is clutter-free.
Enjoy~
Highlight monday and friday with price actionSimple script to show you mondays and fridays and to show you the current open and previous close price plus current close on the candle you are sitting on.
I use this script to back test options strategies, and to look for major price divergence.
This is meant to be used on day candles.

ICT Killzone For Crypto Markets.Adjusted for Crypto 24/7 markets
Adjusted for UTC
i have hidden the asian open range and daily bars on my charts , you can choose to have them on
Less screen clutter
London Open 8:00 - 4:30 - Killzone 7:00 - 9:00
NewYork Open 9:30 - 4:00 Killzone 8:00 - 10:00
Shanghai open 9:15 Killzone 8:00 - 10:00
NOT MY ORIGINAL SCRIPT. JUST MODIFIED VERSION


Quarter Open Price LevelThis tool plots a dynamic level that represents the opening price of each quarter .
Labels provide additional information about the closing price and % change for a particular quarter and allow micro customizations.
