OasisTrading OHL Levels This indicator is free to all Oasis Trading Group members.
Open, High, and Low levels for D, W, M, 90D, 12M.
Labels and Alerts coming soon.
For Access or Questions: Private message us. Thank you.
Open

NSDT Daily Gap RangeSimple script that plots the range between the previous day close and the current day open. This makes it easier to reference the gap up or gap down zone throughout the day.

Weekly Monthly Yearly Open LevelsThis script displays the weekly, monthly, and yearly opens for the last few periods.
I added an option to extend the previous opens to the current period as well.

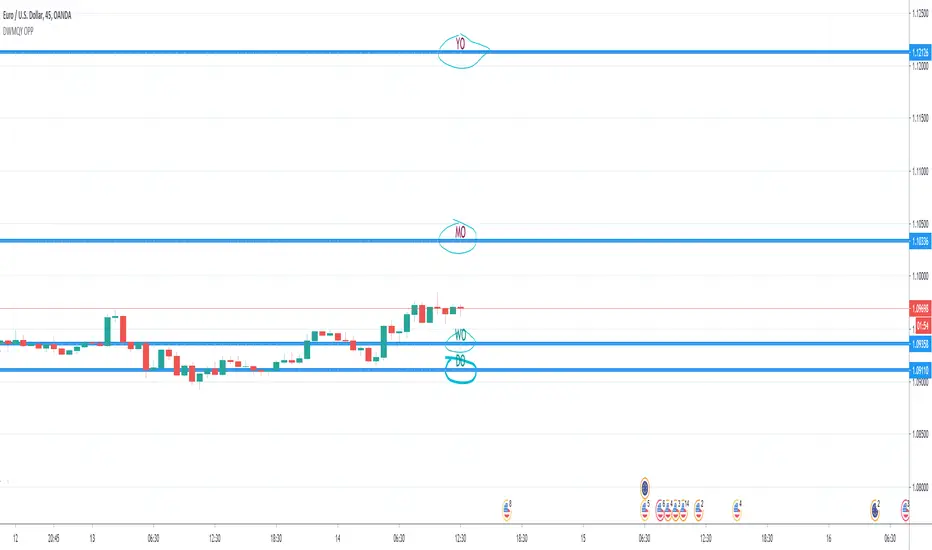
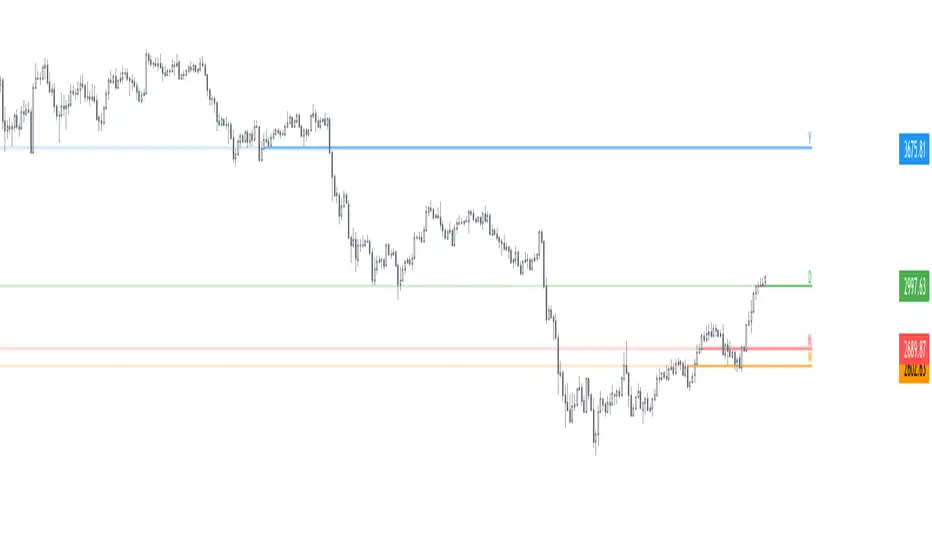
Day & Week & Month & Quarter & Year Open Price PointsPresent to your attention, basic “Day & Week & Month & Quarter & Year Open Price Points Indicator” !
You can determine support & resistance using Yearly, Quarterly, Monthly and Weekly open price points on a chart with any timeframe.
It is not a widely used technique, but according to different academic studies, levels are reliable. Google it! You can enhance your trading by adding that technique in your tool list.
At the current stage, Indicator shows Open Price Points.
Opening price points are extended into the future from the opening candle of each year, quarter, month and week and day.
By nature of that points, every level may be used as a support and as a resistance level at a similar time.
Initial setup:
1) Open the indicator Inputs settings, enable/disable additional Price Points.
2) Open the indicator Style settings, click on a style of each line and click on a “Price Line.”
How to use that?
With a lot of available strategies, there are two leading: Level convergence and Trend line convergence.
1) Level convergence involves locating two or more opening points that merge. This confluence can lead to greater accuracy and profitability.
2) Trend line convergence - The intersection of a trend line at a weekly, monthly, quarterly or even yearly opening level can produce fast and profitable reactions.
Try that!
As a stand-alone strategy, you can utilize that:
Price action under the WO (DO, MO, QO, YO) – Bearish
Price action above the WO (DO, MO, QO, YO) – Bullish
TIP: opening level not always good as a stand-alone tool!
Indicator Settings:
Show Daily Open (disabled by default)
Show Weekly Open (ON by default)
Show Monthly Open (ON by default)
Show Quarter Open (disabled by default)
Show Yearly Open (disabled by default)
Indicator Styling:
By default, each line is shown in the form of circles, line-width 1, silver colour.
Labels can be only in one of two states: Maroon (if open price less than ((open + high + low + close)/4) or Teal (if open price high than ((open + high + low + close)/4).
Alerts:
With the Indicator you can add a few different alerts:
DO Alert
WO Alert
MO Alert
QO Alert
YO Alert
Play with it:
Add a new alert with following condition: your SYMBOL crossing DWMQY OPP Weekly Open.
Options: Once per Bar.
Future of the Indicator:
The Indicator is a necessary part of more prominent Indicator which will include 8 modules in total:
2~ Arabian Wise Tunnels Module
3~ RH Waves Module (something like Vegas Waves)
4~ Trend Channels Module
5~ Opening Range Zoning Module
6~ Breakout Module
7~ BS Hemisphere Module
8~ Price Action Module
DISCLAIMER! RISK WARNING!
PAST PERFORMANCE IS NOT NECESSARILY INDICATIVE OF FUTURE RESULTS. TRADERS SHOULD NOT BASE THEIR DECISION ON INVESTING IN ANY TRADING PROGRAM SOLELY ON THE PAST PERFORMANCE PRESENTED, ADDITIONALLY, IN MAKING AN INVESTMENT DECISION, TRADERS MUST ALSO RELY ON THEIR OWN EXAMINATION OF THE PERSON OR ENTITY MAKING THE TRADING DECISIONS.
//Written by iambitboy request.
D/W/M/Y OpenThis is just a small Script
It show you:
Low and high of
Yesterday, last week, last month and last year
+
Open today

Yearly OHLplots Yearly Open, High, Low levels
Interesting interactions to note at previous yearly opens

Custom Time ranges. Daily price ranges.Addition to previous time range script, now containing daily ranges. You can select a day of the week, and have it show the high, low, mid, and open of that day.
For the time bands:
Monday = 2
Tuesday = 3
Wednesday = 4
Thursday = 5
Friday = 6
Saturday = 7
Sunday = 1
Example 1:
1500-1800:2
This will colour the background between 3pm and 6pm on Mondays.
Example 2:
0000-0600:247
This will colour the background between midnight and 6am on Mondays, Wednesdays, and Saturdays.
For the Daily price ranges:
Just select the tick-box forthe day, and then the price levels you'd like to see.
I want to add specific weekly levels to this, for example: week 06 of year 2020, but I've not figured out how to do it yet. If anyone knows, I'd appreciate it if you let me know. I'll then update this script.
As always, any questions you may have, please leave in comments below and I'll respond when I have time.
If you notice anything good with this indicator, let me know. We are all in this to make money after all! ;)

Candle OpenerIllustrates open and close of the superior candles; the timeframe is choosable from pulldown menu.
Label shows the price of the open and indicate chosen superior candle's status (bull/bear) according to the current close.
インジケーターの設定ドロップダウンメニューから上位足の始値と終値をスイッチングできるので、タイムフレームを跨がずに現在足からラインを引くことができます。表示した上位足の始値を示すラベルは、当該足が陽線か陰線かによって色が反転します。
ライントレードの補助用インジケータとしてご利用ください。

Daily OpenUses provided unix time functions to print daily open (0000 UTC) lines and optionally an additional extension to it from the previous day.
Daily Weekly Monthly Yearly OpensThis script plots the current daily, weekly and monthly opens (all enabled by default).
Here are some additional info about the drawing behavior:
Daily open is shown only on intraday timeframes
Weekly open is shown only on timeframes < weekly
Monthly open is shown only on timeframes < monthly
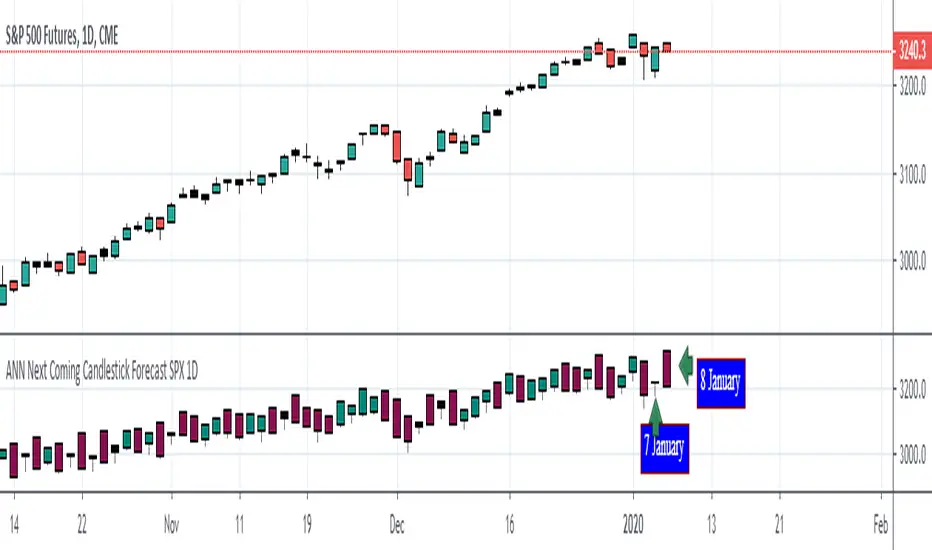
ANN Next Coming Candlestick Forecast SPX 1D v1.0WARNING:
Experimental and incomplete.
Script is open to development and will be developed.
This is just version 1.0
STRUCTURE
This script is trained according to the open, close, high and low values of the bars.
It is tried to predict the future values of opening, closing, high and low values.
A few simple codes were used to correlate expectation with current values. (You can see between line 129 - 159 )
Therefore, they are all individually trained.
You can see in functions.
The average training error of each variable is less than 0.011.
NOTE :
This script is designed for experimental use on S & P 500 and connected instruments only on 1-day bars.
The Plotcandle function is inspired by the following script of alexgrover :
Since we estimate the next values, our error rates should be much lower for all candlestick values. This is just first version to show logic.
I will continue to look for other variables to reach average error = 0.001 - 0.005 for each candlestick status.
Feel free to use and improve , this is open-source.
Best regards.
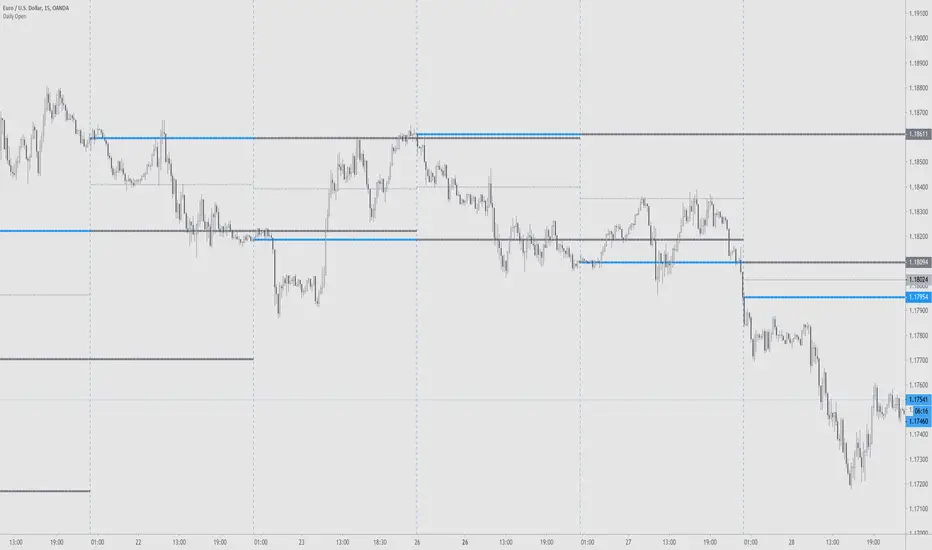
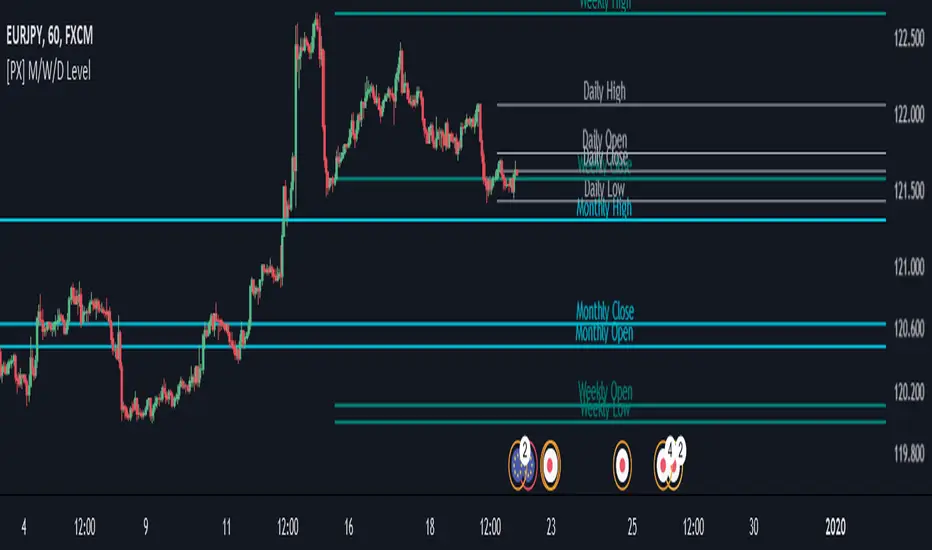
[PX] M/W/D LevelHey guys,
this script shows monthly, weekly and daily OHLC data represented as horizontal level.
I tried to make it as user-friendly as possible. Therefore, you can add different colors and styles for each level, as well as turn them on and off.
With the "Label Offset" -parameter you are in control where the label text should appear. You can shift it from left to right and vice-versa. To shift it to the left choose a negative value. To shift it to the right use a positive one.
This best setting for me personally is the "Candle Selection" -dropdown. This allows you to decide wether you want to show the previous candles OHLC-data or the current live OHLC-data.
!!CAUTION!! If you use the "Current Month/Week/Day" -selection be aware that values shown are "live"-data of the current candle. Therefore, values will change the same way your chart keeps changing on live data.
The "Previous Month/Week/Day" -selection on the other hand is historical data and therefore only changes once we reached a new month/week/day.
If you like my work, consider leaving a like :)
Happy trading!
CoT Absolute Percent-Buschi
English
I'm often asked to provide an alternate view on the CoT data. For example, the indicator "Commercial index" is an oscillator from 0 to 100, but oftentimes it can be helpful to look at the absolute position. So, here the absolute position of certain parts of the CoT report are given, alongside with the percentage of a given time frame to put them in place.
The inputs are:
CoT Part Number ('1' for Commercials Short, '2' for Commercials Long, '3' for Commercials Netto, '4' for Large Speculators Short, '5' for Large Speculators Long, '6' for Large Speculators Netto, '7' for Small Speculators Short, '8' for Small Speculators Long, '9' for Small Speculators Netto, '10' for Open Interest)
Review Period (in years, just used for the percentage)
Percent Line 1, 2, 3, 4 (just to provide some lines which can be altered as required)
DISCLAIMER: I'm aware of Pine Script's ability to provide options as inputs (which would be much nicer for the CoT Parts). Alas, it is only available since version 3, and I noticed that for some reason the CoT data is not correctly adjusted to last Tuesday when using higher versions than 1. If someone knows a solution, please contact me.
Deutsch
Ich werde oft gefragt, eine alternative Sicht auf die CoT-Daten zu geben. Der Indikator "Commercial Index" zum Beispiel schwankt als Oszillator zwischen 0 und 100, aber oft kann der Blick auf die absolute Positionierung hilfreich sein. Also werden hier die Absolutpositionen verschiedene CoT-Bestandteile wiedergegeben, zusammen mit einer prozentualen Einteilung über eine vorgegebene Zeitspanne, um sie einordnen zu können.
The Eingaben lauten:
CoT Part Number ('1' Commercials Short, '2' Commercials Long, '3' Commercials Netto, '4' Large Speculators Short, '5' Large Speculators Long, '6' Large Speculators Netto, '7' Snall Speculators Short, '8' Small Speculators Long, '9' Small Speculators Netto, '10' Open Interest)
Review Period (Zeitintervall in Jahren, um die Prozentlinien zeichnen zu können)
Percent Line 1, 2, 3, 4 (um die Prozentlinien zur Verfügung zu stellen, die dann beliebig geändert werden können)
DISCLAIMER: Ich weiß über die Möglichkeit Bescheid, ab Pine Script Version 3 Optionen als Eingaben benutzen zu können (was deutlich angenehmer für die CoT-Bestandteile wäre). Leider habe ich gemerkt, dass die CoT-Daten bei Versionen über 1 leider nicht korrekt auf letzten Dienstag adjustiert werden, keine Ahnung warum. Falls jemand eine Lösung kennt, bitte kontaktieren.

Opening Range Breakout- ORB Large Price Targets
During this period, you want to identify the high and low of the day. In addition, you will also want to account for the pre-market highs and lows, as these levels will often act like a magnet on price action after the bell rings.
Since the opening bell is associated with big trading volumes and volatility , this time of the session provides many trading opportunities. In this manner, traders use the opening range to set entry points on the chart and to forecast the price action for the day.
Add on to the ORB Script for Higher Price Targets 700% to 1061%

Opening Range Breakout- ORB Higher Price Targets
The opening range is simply the high and low of a given period after the market opens. This period is generally the first 30 minutes or the first hour of trading.
During this period, you want to identify the high and low of the day. In addition, you will also want to account for the pre-market highs and lows, as these levels will often act like a magnet on price action after the bell rings.
Since the opening bell is associated with big trading volumes and volatility , this time of the session provides many trading opportunities. In this manner, traders use the opening range to set entry points on the chart and to forecast the price action for the day.
Add on to the ORB Script for Higher Price Targets 300% to 661%

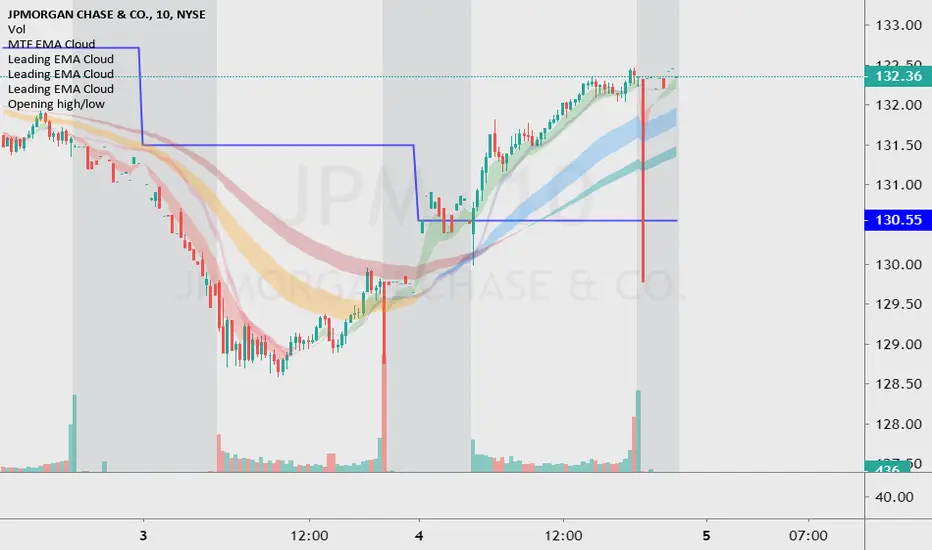
[AU] Open Close MidlineSimple open, close, midline indicator for 3D, W, M. Much less complex than Levels.
Candle (High/Low/Close)-MTF [Anan]
Hello Friends,,
This is just multi time frame candle plot (High / Low / Close) on your current chart resolution.

Open Interest Rank-BuschiEnglish:
One part of the "Commitment of Traders-Report" is the Open Interest which is shown in this indicator (source: Quandl database).
Unlike my also published indicator "Open Interest-Buschi", the values here are not absolute but in a ranking system from 0 to 100 with individual time frames-
The following futures are included:
30-year Bonds (ZB)
10-year Notes ( ZN )
Soybeans (ZS)
Soybean Meal (ZM)
Soybean Oil (ZL)
Corn ( ZC )
Soft Red Winter Wheat (ZW)
Hard Red Winter Wheat (KE)
Lean Hogs (HE)
Live Cattle ( LE )
Gold ( GC )
Silver (SI)
Copper (HG)
Crude Oil ( CL )
Heating Oil (HO)
RBOB Gasoline ( RB )
Natural Gas ( NG )
Australian Dollar (A6)
British Pound (B6)
Canadian Dollar (D6)
Euro (E6)
Japanese Yen (J6)
Swiss Franc (S6)
Sugar ( SB )
Coffee (KC)
Cocoa ( CC )
Cotton ( CT )
S&P 500 E-Mini (ES)
Russell 2000 E-Mini (RTY)
Dow Jones Industrial Mini (YM)
Nasdaq 100 E-Mini (NQ)
Platin (PL)
Palladium (PA)
Aluminium (AUP)
Steel ( HRC )
Ethanol (AEZ)
Brent Crude Oil (J26)
Rice (ZR)
Oat (ZO)
Milk (DL)
Orange Juice (JO)
Lumber (LS)
Feeder Cattle (GF)
S&P 500 ( SP )
Dow Jones Industrial Average Index (DJIA)
New Zealand Dollar (N6)
Deutsch:
Ein Bestandteil des "Commitment of Traders-Report" ist das Open Interest, das in diesem Indikator dargestellt wird (Quelle: Quandl Datenbank).
Anders als in meinem ebenfalls veröffentlichten Indikator "Open Interest-Buschi" werden hier nicht die absoluten Werte dargestellt, sondern in einem Ranking-System von 0 bis 100 mit individuellen Zeitrahmen.
Folgende Futures sind enthalten:
30-jährige US-Staatsanleihen (ZB)
10-jährige US-Staatsanleihen ( ZN )
Sojabohnen(ZS)
Sojabohnen-Mehl (ZM)
Sojabohnen-Öl (ZL)
Mais( ZC )
Soft Red Winter-Weizen (ZW)
Hard Red Winter-Weizen (KE)
Magerschweine (HE)
Lebendrinder ( LE )
Gold ( GC )
Silber (SI)
Kupfer(HG)
Rohöl ( CL )
Heizöl (HO)
Benzin ( RB )
Erdgas ( NG )
Australischer Dollar (A6)
Britisches Pfund (B6)
Kanadischer Dollar (D6)
Euro (E6)
Japanischer Yen (J6)
Schweizer Franken (S6)
Zucker ( SB )
Kaffee (KC)
Kakao ( CC )
Baumwolle ( CT )
S&P 500 E-Mini (ES)
Russell 2000 E-Mini (RTY)
Dow Jones Industrial Mini (YM)
Nasdaq 100 E-Mini (NQ)
Platin (PL)
Palladium (PA)
Aluminium (AUP)
Stahl ( HRC )
Ethanol (AEZ)
Brent Rohöl (J26)
Reis (ZR)
Hafer (ZO)
Milch (DL)
Orangensaft (JO)
Holz (LS)
Mastrinder (GF)
S&P 500 ( SP )
Dow Jones Industrial Average Index (DJIA)
Neuseeland Dollar (N6)

Open Interest-Buschi
English:
One part of the "Commitment of Traders-Report" is the Open Interest which is shown in this indicator (source: Quandl database).
The following futures are included:
30-year Bonds (ZB)
10-year Notes (ZN)
Soybeans (ZS)
Soybean Meal (ZM)
Soybean Oil (ZL)
Corn (ZC)
Soft Red Winter Wheat (ZW)
Hard Red Winter Wheat(KE)
Lean Hogs (HE)
Live Cattle (LE)
Gold (GC)
Silver (SI)
Copper (HG)
Crude Oil (CL)
Heating Oil (HO)
RBOB Gasoline (RB)
Natural Gas (NG)
Australian Dollar (A6)
British Pound (B6)
Canadian Dollar (D6)
Euro (E6)
Japanese Yen (J6)
Swiss Franc (S6)
Sugar (SB)
Coffee (KC)
Cocoa (CC)
Cotton (CT)
S&P 500 E-Mini (ES)
Russell 2000 E-Mini (RTY)
Dow Jones Industrial Mini (YM)
Nasdaq 100 E-Mini (NQ)
Platin (PL)
Palladium (PA)
Aluminium (AUP)
Steel (HRC)
Ethanol (AEZ)
Brent Crude Oil (J26)
Rice (ZR)
Oat (ZO)
Milk (DL)
Orange Juice (JO)
Lumber (LS)
Feeder Cattle (GF)
S&P 500 (SP)
Dow Jones Industrial Average Index (DJIA)
New Zealand Dollar (N6)
Deutsch:
Ein Bestandteil des "Commitment of Traders-Report" ist das Open Interest, das in diesem Indikator dargestellt wird (Quelle: Quandl Datenbank).
Folgende Futures sind enthalten:
30-jährige US-Staatsanleihen (ZB)
10-jährige US-Staatsanleihen (ZN)
Sojabohnen(ZS)
Sojabohnen-Mehl (ZM)
Sojabohnen-Öl (ZL)
Mais(ZC)
Soft Red Winter-Weizen (ZW)
Hard Red Winter-Weizen (KE)
Magerschweine (HE)
Lebendrinder (LE)
Gold (GC)
Silber (SI)
Kupfer(HG)
Rohöl (CL)
Heizöl (HO)
Benzin (RB)
Erdgas (NG)
Australischer Dollar (A6)
Britisches Pfund (B6)
Kanadischer Dollar (D6)
Euro (E6)
Japanischer Yen (J6)
Schweizer Franken (S6)
Zucker (SB)
Kaffee (KC)
Kakao (CC)
Baumwolle (CT)
S&P 500 E-Mini (ES)
Russell 2000 E-Mini (RTY)
Dow Jones Industrial Mini (YM)
Nasdaq 100 E-Mini (NQ)
Platin (PL)
Palladium (PA)
Aluminium (AUP)
Stahl (HRC)
Ethanol (AEZ)
Brent Rohöl (J26)
Reis (ZR)
Hafer (ZO)
Milch (DL)
Orangensaft (JO)
Holz (LS)
Mastrinder (GF)
S&P 500 (SP)
Dow Jones Industrial Average Index (DJIA)
Neuseeland Dollar (N6)

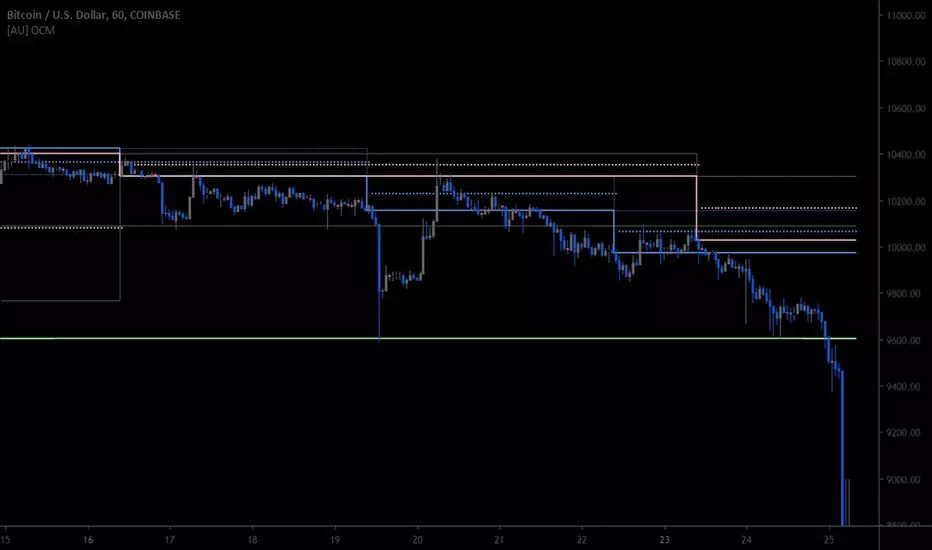
Previous OHLC LevelsQuick dirty code for personal use. Plots previous OHLC levels based on a selected time-frame on the chart.
Not bad if you want to see different time-frame levels.
Fill function can serve to highlight the daily range (high-low or open-close) on non-standard charts
Uses base code from JayRogers

OC indicatorIndicator to show previous open and close of a certain time frame.
Available timeframe :
H1
H4
Daily
Weekly
Monthly
You can disable previous option to show actual data but result will be 'weird' as it works on futur data (non closed candles).
When plotted, circle show open and cross show close. Color dependson the TF.

