FVG Finder | NRP | ProjectSyndicate🥇 ProjectSyndicate Fair Value Gap (FVG) Finder — Pine Script v6 • NRP Non-Repainting
📌 SMC Imbalance Zones Built for Clean Entries, Targets & Mitigation Tracking
The ProjectSyndicate FVG Finder is a professional TradingView indicator designed for traders who want clean, high-probability Fair Value Gaps price imbalances mapped instantly on-chart—without manual marking or clutter.
Fair Value Gaps form during aggressive displacement when price delivers inefficiently, leaving a void that price often returns to rebalance. This tool helps you spot those zones fast, track whether they’re still fresh, and plan entries with confidence. ✅
________________________________________
🚀 Why Traders Like It
✅ NRP Logic (Non-Repainting): Signals are built to remain stable once confirmed
✅ Real-Time FVG Detection: Automatically identifies bullish + bearish FVG zones as they form
📦 Clean Zone Visualization: Boxed imbalance areas that are easy to trade from
🧹 Auto-Cleanup (Mitigation): Zones update based on your chosen fill rule (Touch / 50% / Full)
🎛️ Anti-Noise Filtering: Minimum size + optional ATR filter to remove weak gaps
⚡ Pine Script v6: Built on the latest TradingView engine for stability and performance
🔔 Alerts + Markers: Get notified when new FVGs print + optional triangle signals
________________________________________
Gold H1 TF active FVGs
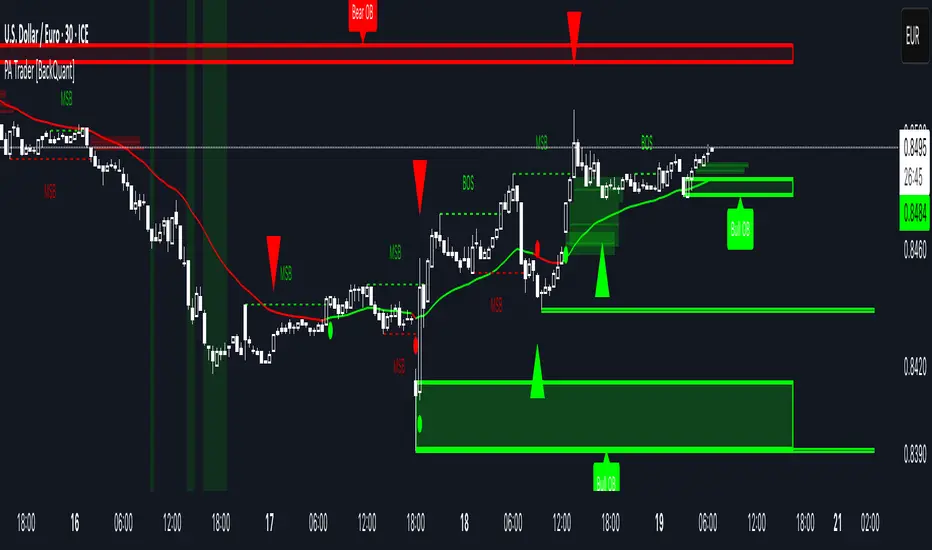
Eur Usd M30 TF active FVGs
NQ H1 TF active FVGs
🧠 Detection Logic — Simple, Effective, Battle-Tested
📈 Bullish Fair Value Gap (Demand Imbalance):
A 3-candle imbalance where the low of Candle 3 is above the high of Candle 1
➡️ Signals strong buy-side displacement / inefficient delivery
📉 Bearish Fair Value Gap (Supply Imbalance):
A 3-candle imbalance where the high of Candle 3 is below the low of Candle 1
➡️ Signals strong sell-side displacement / inefficient delivery
________________________________________
🧹 Mitigation Options — Choose How Filled Works
Your strategy decides what counts as used:
👆 Touch: Zone considered mitigated on first interaction
🎯 50% Fill: Mitigated once price fills half the gap
✅ Full Fill: Mitigated only when the entire zone is filled
Optional: Keep mitigated zones visible or hide them for ultra-clean charts.
________________________________________
🛠 Recommended Settings (ATR Multiplier Presets)
Use these as solid starting points on M30 / H1:
•🥇 XAUUSD (Gold) M30/H1: 0.5
•💻 NQ (Nasdaq) M30/H1: 0.25
•🛢️ USOIL M30/H1: 0.25
•₿ BTCUSD M30/H1: 0.25
•💶 EURUSD / GBPUSD M30/H1: 0.25 – 0.50
✅ Other markets are supported too just adjust the ATR Multiplier based on how many signals you want:
•More signals → lower multiplier
•Higher quality → higher multiplier
________________________________________
✅ Best Use-Cases
🎯 Mark imbalance zones instantly without manual drawing
🧲 Wait for price to return to FVG for cleaner entries
🛡️ Use zone boundaries for clear invalidation / stop placement
📊 Combine with trend bias + BOS/CHoCH + premium/discount for higher confirmation
🎯 Use FVGs as both entries and profit targets
________________________________________
⭐ How You Can Support ProjectSyndicate (3 Steps)
1. ✅ Click “Add to Favorites” to save this script to your TradingView Favorites
2. 🔎 Check out our other scripts to complete your SMC toolkit
3. 👤 Follow ProjectSyndicate for the latest updates, upgrades, and new releases
Order Block Finder | Gold | ProjectSyndicate
Breaker Blocks Finder | Gold | ProjectSyndicate
Orderblock

SuperTrend Filtered with Dash| Gold | ProjectSyndicate📘 ProjectSyndicate Filtered Supertrend M30 GOLD
✅ User Guide Optimized Settings for XAUUSD on M30
Indicator: Supertrend Filtered Gold
Version: 1.0
Author: ProjectSyndicate
Pine Script: v6
________________________________________
1) 👋 Introduction
Welcome to ProjectSyndicate Filtered Supertrend, an upgraded, professional-grade Supertrend system built in Pine Script v6.
This version is designed specifically to help M30 GOLD (XAUUSD) traders reduce the most common Supertrend problem: false flips in chop / low volatility.
By adding 5 powerful filters (all optional + fully adjustable), this indicator aims to keep signals clean, selective, and trend-aligned — which is ideal for GOLD’s frequent fakeouts and liquidity sweeps. 🧠✨
________________________________________
2) ⭐ Key Features What Makes It “Filtered”
✅ Pine Script v6 for speed and stability
✅ 5 Advanced Filters to reduce noise and false signals
✅ Full Customization (each filter can be turned ON/OFF)
✅ On-Chart Filter Dashboard to see what’s blocking signals in real time 📊
✅ Built-In Alerts (Buy / Sell / Direction Change) 🔔
✅ Conservative Defaults (high-quality signals out of the box)
________________________________________
________________________________________
3) 🎛 Sensitivity Control Panel
This is where the magic happens. All enabled filters use AND logic meaning:
✅ A signal prints ONLY if every enabled filter passes.
If even one fails → signal is blocked 🚫
That’s why this system feels “smart” and selective (especially on GOLD M30).
________________________________________
4.1) 📈 Trend Filter
Purpose: Blocks signals when price is drifting sideways (flat momentum).
How it works:
It checks the slope of a short-term EMA. If the EMA slope is too flat, the market is likely ranging → signals get blocked.
Recommended (M30 GOLD Optimized):
• ✅ Enable Trend Filter: ON
• ⏱ Trend Filter Period: 10
• 📏 Trend Strength Threshold (%): 0.05%
Tip for GOLD:
If you’re not getting signals during London/NY trend days, slightly lower the threshold (example 0.04%) to catch more moves. ⚡
________________________________________
4.2) ✅ Signal Confirmation
Purpose: Stops “one-candle flips” and failed breakouts (very common on XAUUSD).
How it works:
It waits for the new trend direction to remain valid for X bars before confirming.
Recommended (M30 GOLD Optimized):
•✅ Enable Signal Confirmation: ON
•🧱 Confirmation Bars: 5
Behavior example:
• Confirmation = 5 → the signal prints on the 5th candle after trend changes
This reduces fakeouts, but signals appear later (more reliable, less early). 🎯
________________________________________
4.3) 🌪 Volatility Filter
Purpose: Avoids signals during “dead” volatility phases (choppy micro-ranges).
How it works:
Measures percentage price movement over a period.
If movement is too small → no signals.
Recommended (M30 GOLD Optimized):
•✅ Enable Volatility Filter: ON
•⏱ Volatility Period: 20
•📉 Minimum Volatility Threshold: 0.25%
Tip:
If you trade only during active sessions (London/NY), you can raise this slightly to filter even harder (ex: 0.30%). 🔥
________________________________________
4.4) 💪 ADX Filter
Purpose: Confirms the market is truly trending using ADX, a classic trend-strength tool.
How it works:
If ADX is below the threshold, the market is likely non-trending → signals blocked.
Recommended (M30 GOLD Optimized):
•✅ Enable ADX Filter: ON
•⏱ ADX Period: 14
•🎚 Minimum ADX Value: 25
Rule of thumb:
📌 ADX > 25 = trend conditions
📌 ADX < 20 = likely chop / mean-reversion
________________________________________
4.5) 🧯 Signal Spacing Anti-Spam Filter
Purpose: Prevents overtrading by forcing a cooldown period between signals.
How it works:
It tracks bars since last BUY and since last SELL separately.
Recommended M30 GOLD Optimized:
•✅ Enable Signal Spacing: ON
•⏳ Minimum Bars Between Signals: 75
What 75 bars means on M30:
75 × 30 minutes = 2250 minutes = 37.5 hours
So this is intentionally strict (high quality / swing-style filtering). 🏦
If you want more signals:
Try 30–50 for active trend capture, still clean. ✅
________________________________________
5) 📊 Filter Dashboard Read This First When Confused
The dashboard shows live status of each filter.
✅ PASS (Green) = filter condition met
❌ FAIL (Red) = filter is blocking signals
Dashboard also shows:
• 📏 Trend Strength (EMA slope %)
• 💪 ADX Value
• 🔁 Current Trend UPTREND / DOWNTREND
Pro Tip 🧠:
Not getting signals? Don’t guess. Look at the dashboard — it will instantly tell you which filter is failing.
________________________________________
6) 🔔 Alerts Integration TradingView Alerts Ready
This indicator includes built-in alert conditions.
To set alerts:
1️⃣ Click Alert (top toolbar) or press Alt + A
2️⃣ In Condition, select Supertrend Advanced
3️⃣ Choose one:
📌 Alert Conditions
✅ SuperTrend Buy → Buy printed after all enabled filters PASS
✅ SuperTrend Sell → Sell printed after all enabled filters PASS
⚠️ SuperTrend Direction Change → raw Supertrend flip (ignores filters)
Recommended alert frequency:
✅ Once Per Bar Close (reduces noise + avoids repaint confusion)
________________________________________
7) 🧠 Strategy & Best Practices M30 GOLD Focused
✅ Best Use Case
This Filtered Supertrend works best when GOLD is doing one of these:
•🏃 Strong session trend (London / NY continuation)
•🔁 Post-news directional expansion
•📈 Clean structure break + follow-through
🔥 Smart Trading Workflow (Simple + Effective)
✅ Use dashboard → wait for filters PASS
✅ Align with market structure (HH/HL for buys, LH/LL for sells)
✅ Use key zones:
•Support/Resistance 🧱
•Liquidity sweeps 💧
•Order Blocks / Supply-Demand (if you use them) 📦
🧪 Tune One Filter At A Time
When optimizing:
1.Reduce Signal Spacing first
2.Then reduce Confirmation Bars
3.Only then touch volatility / ADX / trend slope
________________________________________
8) 🧩 Example Profiles Quick Presets
🥇 GOLD M30 “Optimized / Conservative” Recommended
•Trend Strength: 0.05%
•Confirmation Bars: 5
•Volatility Threshold: 0.25%
•ADX: 25
•Signal Spacing: 75
⚖️ Balanced More signals, still filtered
•Trend Strength: 0.05%
•Confirmation Bars: 2
•Volatility Threshold: 0.50%
•ADX: 25
•Signal Spacing: 10
⚡ Aggressive / Scalping Style
•Trend Strength: 0.03%
•Confirmation Bars: 1
•Volatility Threshold: 0.10%
•ADX: OFF
•Signal Spacing: 3
________________________________________
🤝 Combining Filtered Supertrend + ProjectSyndicate Order Blocks Finder SMC Boost
For SMC traders, use Order Block Finder to map clean institutional supply/demand zones (bullish OB = last bearish candle before strong bullish displacement + BOS; bearish OB = last bullish candle before strong bearish displacement + BOS, with a displacement-strength filter and auto-cleanup) and then let Filtered Supertrend act as the “permission + timing” engine
✅only take Supertrend Buy signals when price is reacting from/returning into a bullish OB (demand) in an uptrend, and Supertrend Sell signals from a bearish OB (supply) in a downtrend; entries become higher probability because you’re stacking trend bias + institutional zone + confirmation filters, with clean risk defined by the OB boundary (stop beyond the box) and logical targets toward the next opposing OB or trend continuation
Order Block Finder | Gold | ProjectSyndicate
________________________________________
9) 🧯 Troubleshooting
❓ “No signals are appearing”
Likely filters are too strict.
✅ Check dashboard → see which filter fails.
Try this order:
1.Lower Signal Spacing (75 → 50 → 30)
2.Lower Confirmation Bars (5 → 3 → 2)
3.Slightly reduce thresholds
❓ “Still too many signals”
Tighten filters:
✅ Confirmation Bars 3+
✅ Signal Spacing 100+
✅ Increase Trend Strength + ADX thresholds
❓ “Signals appear too late”
Reduce Confirmation Bars:
✅ 5 → 3 or 2
(earlier entries, slightly more risk of fakeouts)
________________________________________
✅ Conclusion
ProjectSyndicate Filtered Supertrend turns a basic trend indicator into a high-control signal engine. On GOLD M30, where fakeouts and chop are common, the 5-filter AND logic + dashboard gives you a cleaner edge — especially when combined with structure and key zones. 📈💎

Breaker Blocks Finder | Gold | ProjectSyndicateProjectSyndicate Breaker Blocks Finder
📊 Overview
The ProjectSyndicate Breaker Blocks Finder (PS BB Finder) is a professional-grade Pine Script indicator designed to detect and display Bullish and Bearish Breaker Blocks based on Smart Money Concepts (SMC) methodology. This indicator is specifically optimized for XAUUSD (Gold) trading but works reliably across all symbols and timeframes.
Key Features
✅ Non-Repainting: Breaker blocks never change position after formation
✅ Multi-Timeframe Support: Optimized for M5, M10, M15, M20, M30, and H1
✅ Highly Customizable: 10+ user-configurable settings
✅ Visual Clarity: Color-coded boxes and labels for easy identification
✅ Performance Optimized: Handles 1000+ candles without lag
✅ Cross-Symbol Compatible: Works on Forex, Crypto, Stocks, Indices, and Commodities
✅ Displacement Detection: Uses ATR-based displacement to filter false signals
🎯 What are Breaker Blocks?
A Breaker Block is a failed order block that becomes a new support or resistance zone after being invalidated by price. It represents a market structure shift where institutional traders (smart money) have flipped their position.
Bullish Breaker Block
A Bullish Breaker Block forms when:
1 A bearish order block (resistance zone) exists
2 Price breaks ABOVE this zone with strong displacement
3 The former resistance zone now becomes SUPPORT
4 Price may retest this zone before continuing higher
Visual: Green box with "BB ▲" label
Bearish Breaker Block
A Bearish Breaker Block forms when:
5 A bullish order block (support zone) exists
6 Price breaks BELOW this zone with strong displacement
7 The former support zone now becomes RESISTANCE
8 Price may retest this zone before continuing lower
Visual: Red box with "BB ▼" label
⚙️ Default Settings
Setting Default Range Description
Lookback Period 1000 100-5000 Number of historical candles to analyze
Max Breaker Blocks 5 1-50 Maximum number of breaker blocks to display
Swing Detection Length 10 2-20 Bars on each side to confirm swing high/low. Higher = more significant swings
Use Displacement Filter true true/false Enable to filter breaker blocks by displacement size
Displacement Multiplier 2.0 0.5-5.0 Minimum move size as multiple of ATR. Higher = stricter detection
Invalidation Method Close Close/Wick Close = Conservative (candle must close beyond zone)Wick = Aggressive (wick touch is enough)
📈 Recommended Timeframes & Settings
This indicator is optimized for the following timeframes. Use these settings as a starting point.
Lower Timeframes (M5, M10, M15, M20)
These settings are designed to capture faster price movements and are the default settings for the indicator.
Setting Recommended Value
Lookback Period 1000
Max Breaker Blocks 5
Swing Detection Length 10
Use Displacement Filter true
Displacement Multiplier 2.0
Invalidation Method Close
Higher Timeframes (M30, H1)
For these timeframes, a less strict displacement filter is recommended to capture more significant, but less frequent, breaker blocks.
Setting Recommended Value
Lookback Period 1000
Max Breaker Blocks 5
Swing Detection Length 10
Use Displacement Filter true
Displacement Multiplier 1.0
Invalidation Method Close
🎓 How to Use
Step 1: Identify Breaker Blocks
Once the indicator is loaded, breaker blocks will automatically appear on your chart:
• Green boxes = Bullish breaker blocks (former resistance, now support)
• Red boxes = Bearish breaker blocks (former support, now resistance)
Step 2: Wait for Retest
The most reliable trading opportunities occur when price retests the breaker block zone:
• For bullish breaker blocks, wait for price to come back down to the green zone
• For bearish breaker blocks, wait for price to come back up to the red zone
Step 3: Look for Confluence
Combine breaker blocks with other SMC concepts for higher probability setups:
• Fair Value Gaps (FVG) within the breaker block zone
• Liquidity grabs before the retest
• Break of Structure (BoS) or Change of Character (ChoCH) confirmation
Step 4: Enter the Trade
Bullish Setup:
• Entry: At or near the bullish breaker block zone
• Stop Loss: Below the breaker block
• Take Profit: Previous swing high or higher
Bearish Setup:
• Entry: At or near the bearish breaker block zone
• Stop Loss: Above the breaker block
• Take Profit: Previous swing low or lower
🛡️ Non-Repainting Guarantee
This indicator is 100% non-repainting, meaning:
✅ Breaker blocks never change position after formation
✅ Historical breaker blocks remain in the exact same location indefinitely
✅ Backtesting results are reliable and consistent
🐛 Troubleshooting
Issue: No Breaker Blocks Appearing
Solutions:
• Ensure "Use Displacement Filter" is enabled.
• On M30/H1, try lowering the "Displacement Multiplier" to 1.0.
• Scroll back in history; blocks may not be present on the most recent bars.
Issue: Too Many Breaker Blocks
Solutions:
• Increase "Displacement Multiplier" to 2.5 or 3.0.
• Increase "Swing Detection Length" to 12-15.
• Decrease "Max Breaker Blocks" to 3-4.

Order Block Strategy Pyramiding. TG:@MrBCNOrder Block Strategy Pyramiding is a strategy for TradingView based on the concept of Order Blocks. It identifies areas of interest for major market participants and looks for price reversal points when prices return to these areas. It generates LONG/SHORT signals, is suitable for cryptocurrencies, forex, and stocks, and is effective on short and medium timeframes.
Order Block Strategy Pyramiding — стратегия для TradingView, основанная на концепции Order Blocks. Определяет зоны интереса крупных участников рынка и ищет точки разворота цены при возврате в эти зоны. Генерирует сигналы LONG / SHORT, подходит для криптовалют, форекса и акций, эффективна на младших и средних таймфреймах.
TG:@MrBCN

Order Block Strategy ReversWIN: 70-100%
8, 3, 3,1
TP 1.6%
Order Block Strategy Revers is a trading indicator that identifies key order block zones (areas of accumulation by large players) and looks for price reversal points. The indicator tracks impulsive movements, forms supply and demand levels, and generates LONG/SHORT signals when the price returns to the order block with confirmation. Suitable for crypto, forex, and stocks, effective on medium and lower timeframes.
Translated with DeepL.com (free version)
Order Block Strategy Revers — это торговый индикатор, который определяет ключевые order block зоны (области накопления крупных игроков) и ищет точки разворота цены. Индикатор отслеживает импульсные движения, формирует уровни спроса и предложения и подаёт сигналы LONG / SHORT при возврате цены в order block с подтверждением. Подходит для крипты, форекса и акций, эффективен на средних и младших таймфреймах.

Advanced Order Block Visualization ToolAdvanced Order Block Visualization Tool
Description:
This custom TradingView indicator is designed to enhance the visualization and analysis of order blocks across all timeframes. It accurately identifies and displays order blocks based on specific criteria, helping traders make informed decisions.
Key Features:
Accurate identification of order blocks using advanced algorithms
Improved visibility and clarity of order blocks, even on lower timeframes
Customizable settings to adapt to different trading styles and preferences
Intelligent filtering to display only the most relevant order blocks
Inclusion of internal order blocks for a comprehensive view of market structure
Efficient and optimized code for smooth performance
Usage Instructions:
Add the indicator to your TradingView chart
Customize the settings according to your preferences (e.g., input.int(), input.float(), etc.)
Analyze the displayed order blocks in conjunction with your trading strategy
Use the insights gained to make informed trading decisions
Note: This indicator is designed to aid in analysis and decision-making but does not constitute financial advice. Always use discretion and risk management when trading.
Feedback and Support:
If you encounter any issues, have suggestions for improvement, or need assistance, please feel free to contact me via the TradingView chat or leave a comment on the indicator's page. I appreciate your feedback and strive to continuously enhance the indicator's performance.
Happy trading!

Order Block Finder | Gold | ProjectSyndicate🥇 ProjectSyndicate Gold Order Block Finder
📌 Institutional Order Blocks for XAUUSD Built for Gold’s Volatility
The ProjectSyndicate Gold Order Block Finder is a professional-grade TradingView indicator engineered specifically for XAUUSD / Gold traders who want clean, high-probability institutional supply & demand zones on their chart.
Gold moves fast, sweeps liquidity often, and loves sharp displacement. This tool is tuned to match that behavior—so you can quickly spot the zones where smart money likely stepped in, and plan entries, targets, and invalidations with confidence. ✅
🚀 Why Gold Traders Like It
✅ Made for XAUUSD: Detection is tuned for Gold’s unique volatility and impulse structure
🏦 Institutional Zone Detection: Finds the last opposing candle before a true displacement + structure break
🧹 Auto-Cleanup (Mitigation): Zones automatically disappear when invalidated (no clutter)
📦 Clean Visualization: Professional OB boxes that extend into live price action
⚡ Pine Script v6: Built on the latest TradingView engine for stability and speed
🧠 Detection Logic Simple, Effective, Battle-Tested
📈 Bullish Order Block (Demand):
The last bearish candle before a strong bullish displacement that breaks market structure (BOS)
📉 Bearish Order Block (Supply):
The last bullish candle before a strong bearish displacement that breaks market structure (BOS)
💥 Displacement Filter Power Move Confirmation:
Zones are validated only when the impulse move meets a minimum strength threshold (default: 1.3× candle range)—helping filter out weak noise and low-quality blocks.
🛠 Recommended Gold Settings (XAUUSD)
Use these presets to match Gold’s typical behavior across higher-impact timeframes:
Timeframe | Swing Length | Displacement
M5 | 5–7 | 1.2 – 1.4
M10 | 5–7 | 1.2 – 1.4
M30 | 5–7 | 1.2 – 1.4
H1 | 7–9 | 1.3 – 1.6
H4 | 8–10 | 1.5 – 2.0
💡 Tip: If you want more signals, reduce Swing Length.
If you want higher quality only, increase Displacement.
✅ Best Use-Cases on Gold
🎯 Mark premium supply/demand zones without manual drawing
🧲 Wait for price to return to the OB for cleaner entries
🛡️ Use OB boundaries for clear invalidation + stop placement
📊 Combine with trend bias / liquidity sweeps / session levels for extra confirmation

Apex Delivery: Body-Anchored CISD & Liquidity EngineA precision-grade execution toolkit designed for the professional ICT trader. This script focuses on the "Change in State of Delivery" (CISD) and the automated tracking of institutional liquidity, built with a strict "Clean Chart" philosophy to ensure only active, relevant data remains on your workspace.
I. Body-Anchored CISD (Change in State of Delivery)
This script implements a strict rule-based approach to CISD, focusing on the candle body rather than wicks to identify true shifts in narrative.
Bearish CISD: Dynamically anchored only to the top of the candle body.
Bullish CISD: Dynamically anchored only to the bottom of the candle body.
This asymmetry ensures you are looking at the correct "draw" or "protection" levels based on the current state of delivery.
II. The "Clean Chart" Engine
The script acts as an automated housekeeper. To prevent "analysis paralysis," it identifies and immediately removes:
Broken Session Levels: Once a Session High or Low (Asia, London, NY) is breached, the line and label are purged.
Mitigated Zones: Filled FVGs and mitigated 1H Order Blocks are removed in real-time.
Proximity Filtering: Levels that are too far from the current price action are cleared to keep your focus on the active trade.
III. Institutional Framework
1H Order Blocks: High-volume 1-hour OBs serve as your Higher Timeframe (HTF) anchor.
5m FVG/IFVG: Tracks displacement-based gaps and automatically flips them into Inversion FVGs when price closes through them.
Session Liquidity: Clearly labeled session extremes provide the "Draw on Liquidity" (DOL).
Swing-Based SMT: A background correlation filter to confirm "Cracks in Correlation" at key levels.
Usage Philosophy
Identify the HTF Narrative: Locate a 1H Order Block or a Session Liquidity pool.
Monitor the Delivery: Watch for a Body-Anchored CISD to confirm the institutional shift.
Execute & Target: Use the 5m FVGs or IFVGs for entry, targeting the next available Session High/Low label.

ICT Smart Money Concepts SMC Malibu🔷 Overview
The Smart Money Concepts (SMC) indicator is a comprehensive toolkit designed for institutional-style trading analysis. It automatically identifies and visualizes key SMC structures including Order Blocks, Breaker Blocks, Fair Value Gaps, Liquidity Levels, and Market Structure shifts — all in real-time.
Built with precision and clarity in mind, this indicator eliminates chart clutter through intelligent zone clustering, ensuring only the most relevant and actionable levels are displayed.
🔷 Key Features
Order Blocks (OB) — Automatically detects bullish and bearish order blocks with mitigation tracking
Breaker Blocks (BB) — Identifies failed order blocks that convert into breaker zones
Fair Value Gaps (FVG/IFVG) — Spots imbalances and inverse FVGs with visual fill tracking
Liquidity Levels (BSL/SSL) — Maps buy-side and sell-side liquidity with smart clustering
Market Structure (BOS/ChoCH) — Tracks Break of Structure and Change of Character in real-time
Kill Zones — Highlights key trading sessions (Asia, London, NY AM, NY Lunch, NY PM)
HTF Dashboard — Displays higher timeframe OB, FVG, and BB zones for confluence
Unicorn Model — Detects the rare ICT Unicorn setup automatically
🔷 What Makes It Unique?
✅ Smart Overlap Prevention — When multiple zones form at the same price level, older zones are automatically removed, keeping only the most recent and relevant structure.
✅ Mitigation Tracking — Zones that have been mitigated fade automatically, allowing you to distinguish between fresh and used levels.
✅ Multi-Timeframe Confluence — The built-in HTF dashboard shows higher timeframe structures directly on your chart without switching timeframes.
✅ Clean & Professional Design — Every element is carefully styled for maximum clarity and minimal distraction.
🔷 How To Use
Enable the structures you want to see (OB, BB, FVG, Liquidity, etc.)
Use Kill Zones to focus on high-probability trading windows
Look for confluence between current timeframe structures and HTF dashboard levels
Trade reactions at fresh (non-mitigated) zones with proper risk management
🔷 Settings
All features are fully customizable:
Toggle each structure on/off independently
Adjust colors and transparency
Control maximum active zones
Show/hide historical (mitigated) levels
Customize Kill Zone sessions and times
🔷 Notes
Works on all markets (Forex, Crypto, Stocks, Indices)
Optimized for 1M to 4H timeframes
Best used in conjunction with your own analysis and risk management
📱 7-DAY FREE TRIAL: Website: harmonikprzmalibu.netlify.app/

Trader Otto - Smart Order Blocks & Delta Flow [SMC]This indicator brings a professional approach to Smart Money Concepts (SMC) by combining classic **Order Block** identification with **Volume Delta** and **Volatility Filtering**.
Standard Order Block indicators often clutter the chart with weak zones. This script solves that by applying a rigorous "Quality Control" engine to every potential block.
### 🧠 Key Concepts
**1. Volume Delta Analysis (Δ)**
Inside every Order Block, the script calculates the internal buying/selling pressure.
* **The Problem:** A candle might look bullish, but have weak internal buying volume.
* **The Solution:** This tool displays the **Delta %** (Δ) directly on the block. A high positive Delta confirms strong institutional interest.
**2. Exhaustion Filter (ATR Logic)**
Not all big candles are Order Blocks; some are just exhaustion moves.
* The script uses an Average True Range (ATR) multiplier to detect statistically abnormal moves.
* If a candle is too large (likely a climax move), it is **rejected** as an Order Block, preventing false traps.
**3. Mitigation & Cleanup**
The system automatically manages the chart workspace:
* Blocks are extended into the future until they are mitigated (broken).
* Once price closes beyond the block, it is automatically removed to keep the chart clean.
### ⚙️ Settings
* **Pivot Period:** Defines the structural significance of the swing points.
* **Exhaustion Filter:** Users can adjust the ATR multiplier to filter out news spikes or climatic candles.
* **Volume Filter:** Ensures only blocks with above-average volume are plotted.
* **Visuals:** Customize colors and toggle the Delta information text.
---
*Disclaimer: This tool assists in market structure analysis but does not guarantee future price movements.*

ICT CISD+FVG+OBThis script is a high-performance ICT suite designed for traders who want a professional, "noise-free" chart. It identifies core institutional patterns—Order Blocks, Fair Value Gaps, and Changes in State of Delivery (CISD)—across multiple timeframes.
The script features a proprietary Proximity Cleanup Engine that automatically deletes old or broken levels, keeping your workspace focused only on price action that is currently tradeable. It strictly follows directional delivery rules for CISD and includes a 50-candle "freshness" limit to ensure you never have to manually clear old data from your past bars.
Core Features
Intelligent CISD: Only triggers Bullish CISD on green candles and Bearish CISD on red candles.
Proximity Filter: Automatically wipes away any levels that are "miles away" from the current price.
Clean Workspace: Removes broken session highs/lows and mitigated zones instantly.
Full Customization: Toggle visibility and colors for every component via the settings menu.

BOS Zones (Order Blocks) [VCAI]BOS Zones (Order Blocks)
BOS Zones (Order Blocks) is a market-structure visualiser that highlights Breaks of Structure (BOS) and automatically marks the price zones formed immediately before the break.
Instead of guessing where structure changed or manually drawing zones, this indicator does the work for you and keeps the chart clean.
What This Indicator Does
• Detects bullish and bearish Breaks of Structure
• Identifies the last opposing candle before the break
• Draws a clear zone (order-block style) from that candle
• Projects the zone forward for future interaction
• Optionally shows midlines for refined price reference
How to Read It
• Bullish BOS
When price breaks above a prior swing high, the indicator marks the last bearish candle before the break and draws a bullish zone.
• Bearish BOS
When price breaks below a prior swing low, the indicator marks the last bullish candle before the break and draws a bearish zone.
These zones often act as areas of interest where price may react, stall, or reverse.
Why This Is Useful
Most traders:
miss structure shifts
draw zones inconsistently
clutter charts with too many lines
BOS Zones gives you:
• Objective structure breaks
• Consistent zone placement
• Clean, readable visuals
• Fewer decisions, less noise
Customisation Options
• Control swing sensitivity
• Limit how many zones are displayed
• Toggle boxes, midlines, and markers
• Automatically clean old zones
Inputs are intentionally limited to avoid over-optimisation.
What This Indicator Is NOT
• No buy or sell signals
• No trade automation
• No prediction or future-looking logic
This is a structure and context tool, designed to support discretionary analysis.
Best Use Cases
• Market structure analysis
• Supply & demand / order block trading
• Confluence with trend tools
• Higher-timeframe bias mapping
Works across Crypto, Forex, Indices, and Commodities.
Final Note
This indicator does not repaint structure breaks once confirmed.
All zones are derived from historical price action only.

ICT Concepts [Kodexius]ICT Concepts is an all in one, chart overlay toolkit that combines several widely used ICT style components into a single, modular workflow. It is designed to help you map higher timeframe context, track directional structure, and refine execution areas with imbalance and liquidity concepts, without turning the chart into a cluttered drawing board.
Instead of plotting everything indefinitely, each module focuses on “live relevance” and chart readability. Zones, lines, and labels are managed with sensible limits so the most recent and most meaningful structures remain visible while older objects are automatically retired.
Because the system is modular, you can run it like a complete toolkit:
- Use multi timeframe Order Blocks to define high probability zones
- Use Market Structure (BOS and MSS) for bias and context
- Validate intent with SMT Divergence when you want intermarket confirmation
- Refine with Imbalances (FVG, BPR, CE) and Liquidity Sweeps
- Add timing structure via Killzones and risk structure via auto Fibonacci
🔹 Features
🔸 Multi Timeframe Order Blocks (3 candle displacement OB)
The OB engine detects a strict 3 candle displacement sequence (bull and bear) and projects the “order block candle” as a forward extending zone. Detection can run on the chart timeframe or on a user selected higher timeframe and then be displayed on your execution chart.
🔸 Overlap Control
Before adding a new OB, the script checks overlap against existing zones of the same direction. If a new zone intersects an existing one, it is ignored to reduce redundant stacking in the same price area.
🔸 Automatic Extension and Mitigation for Order Blocks
OB zones extend forward on every bar and are removed once mitigation is confirmed. Mitigation is evaluated by close breaking decisively beyond the relevant boundary:
- Bullish OB mitigates when close prints below the OB bottom
- Bearish OB mitigates when close prints above the OB top
🔸 Market Structure (BOS and MSS)
Market Structure is built from swing pivots using a configurable pivot length. When price closes through the latest swing, the script prints a structure event:
BOS (Break of Structure) for continuation
MSS (Market Structure Shift) for a directional change
To keep the chart readable, older structure drawings are capped by history limits.
🔸 SMT Divergence with optional mini panel
SMT can compare the current instrument with a user selected symbol to highlight divergence at swing points. A divergence is flagged when one market makes a new swing extreme while the other fails to confirm.
Optional: a compact right side “compare symbol” candle panel can be enabled so you can visually confirm what the secondary market is doing without leaving the chart.
🔸 Imbalances: FVG, BPR, and CE modes
You can choose between three imbalance views depending on your style:
FVG mode: Fair Value Gaps are plotted as extending zones
CE mode: Consequent Encroachment is visualized using a midpoint line and a half zone fill
BPR mode: Balanced Price Range is formed when a new FVG overlaps an opposing FVG, producing a “balanced” region that often behaves differently than a standalone gap
🔸 Automatic extension, limits, and mitigation for imbalances
Imbalance objects extend forward until mitigated. Mitigation uses wick based logic:
Bullish imbalance mitigates when price wicks below the zone bottom
Bearish imbalance mitigates when price wicks above the zone top
The script also enforces per side limits and removes older items to keep performance stable.
🔸 Liquidity sweeps (buyside and sellside)
The liquidity module tracks swing highs and lows and marks sweep events when price runs the level and then closes back through it, which often behaves like a rejection signal. Sweeps are visualized with a level line plus a small sweep highlight box, with an optional history cap.
🔸 Auto anchored Fibonacci (EQ and OTE focus)
Fibonacci levels are automatically anchored using the most recent structure context so you do not need to manually re draw fibs every time the market evolves. EQ and OTE focused bands are plotted to support common premium discount style workflows, with optional extra levels if desired.
🔸 Killzones (session boxes with optional range tracking)
Asian, London Open, New York AM, and New York PM killzones can be displayed using UTC-5 session definitions. Session boxes dynamically expand as new highs and lows are formed during the session, and historical zones can be retained up to a user set count. Rendering is restricted to intraday timeframes up to 60 minutes for clean scaling and performance.
🔹 Calculations
1) Order Block detection (3 candle displacement)
The OB pattern is defined inside detectLogic() . The zone boundaries always come from candle (the middle candle of the 3 candle sequence).
detectLogic() =>
bool isBull = open > close and close > open and close > open and low < low and close > high
bool isBear = open < close and close < open and close < open and high > high and close < low
[isBull, high , low , time , isBear, high , low , time ]
Interpretation (bullish side):
Candle is bearish
Candle is bullish (the OB candle)
Current candle is bullish and closes above high
low undercuts low to form the sweep style condition
Bearish logic is the mirrored inverse.
2) Multi timeframe projection and duplicate control
If the timeframe input is set, detections are computed on that timeframe and projected onto the current chart using request.security . A last processed time check prevents duplicate prints.
=
request.security(syminfo.tickerid, i_tf, detectLogic())
var int lastBullTime = 0
var int lastBearTime = 0
if mtf_isBull and mtf_bullTime != lastBullTime
lastBullTime := mtf_bullTime
if mtf_isBear and mtf_bearTime != lastBearTime
lastBearTime := mtf_bearTime
3) OB overlap validation and mitigation
Overlap is checked before pushing a new zone, then zones are extended and removed once mitigated by close.
method hasOverlap(array OBs, float top, float bottom) =>
bool overlap = false
if OBs.size() > 0
for i = 0 to OBs.size() - 1
OB item = OBs.get(i)
if (top < item.top and top > item.bottom) or (bottom > item.bottom and bottom < item.top)
overlap := true
break
overlap
method isMitigated(OB this, float currentClose) =>
this.isBull ? (currentClose < this.bottom) : (currentClose > this.top)
4) Market Structure: pivots, BOS, and MSS
Swings are derived from pivots; then BOS/MSS prints when price crosses the latest swing. The script tracks trend state to decide whether the break is continuation (BOS) or shift (MSS).
float ph = ta.pivothigh(i_structLen, i_structLen)
float pl = ta.pivotlow(i_structLen, i_structLen)
bool brokenHigh = ta.crossover(close, lastHigh)
bool brokenLow = ta.crossunder(close, lastLow)
// drawStructure(..., "BOS", ...) or drawStructure(..., "MSS", ...) depending on trend state
5) SMT Divergence conditions
SMT uses pivot highs/lows on both instruments. A bearish SMT prints when the main chart makes a higher high but the compare symbol fails to exceed its prior high. A bullish SMT prints when the main chart makes a lower low but the compare symbol fails to make a lower low.
bool bearishSmt = not na(smtAHighPrev) and not na(smtBHighPrev) and (smtAHighLast > smtAHighPrev) and (smtBHighLast <= smtBHighPrev)
bool bullishSmt = not na(smtALowPrev) and not na(smtBLowPrev) and (smtALowLast < smtALowPrev) and (smtBLowLast >= smtBLowPrev)
6) FVG detection, BPR construction, and CE level
FVGs are detected via a classic 3 bar gap condition. When a new FVG overlaps an opposing FVG, the script builds a BPR using the intersecting region. CE is the midpoint (top + bottom) / 2, plotted as a dashed line plus a half fill box.
bool fvgBullDetected = low > high
bool fvgBearDetected = high < low
// CE
float ceLevel = (this.top + this.bottom) / 2
Imbalance mitigation uses wick logic:
method isMitigated(FVG this, float currentHigh, float currentLow) =>
this.isBull ? (currentLow < this.bottom) : (currentHigh > this.top)
7) Liquidity sweep trigger
A sweep is confirmed only when price runs the pivot level and closes back through it (reject style).
bool sweepBull = i_showLiq and not na(liqLastLow) and not liqLastLowSwept and low < liqLastLow and close > liqLastLow
bool sweepBear = i_showLiq and not na(liqLastHigh) and not liqLastHighSwept and high > liqLastHigh and close < liqLastHigh
8) Killzone session mapping
Sessions are defined in UTC-5 using time() session strings.
string kzTz = "UTC-5"
kzInSession(string sess) =>
not na(time(timeframe.period, sess, kzTz))
bool inAsian = kzInSession("2000-0000")
bool inLondon = kzInSession("0200-0500")
bool inNY = kzInSession("0830-1100")

SMC Execution Engine by @abdallacryptoSMC Execution Engine by @abdallacrypto is a Smart Money Concepts structure and execution toolkit that turns price action into a clear, rules-based map.
It automatically detects swing structure, BOS and CHOCH, tracks the active structural anchor, and projects clean Fibonacci retracement levels built from the current context. It also draws the latest context Order Block and adds optional intrabar alerts for high-probability confluence events (OB touches, 0.79 and 0.618 fib interactions, OB plus fib, and sequential “fib then OB” logic). A multi-timeframe HUD (5m to 1M) shows structural bias and RSI so you can align execution with higher-timeframe context.
This is not a buy/sell signal generator. It is a structure reader and execution framework designed to reduce noise, improve consistency, and help you act with clarity.
Suggested use: identify context with CHOCH and anchor, wait for price to return to key fib levels and the active Order Block, then execute your own risk plan.
Full documentation:
🇺🇸 beneficial-hyena-c1e.notion.site
🇧🇷 beneficial-hyena-c1e.notion.site
🇪🇸 beneficial-hyena-c1e.notion.site

Order Blocks v2This is a short code script that shows you a REAL Order Blocks.
There is many indicators that show you random blocks on the screen, these are by definition Order Blocks. The code is simple and short.
You can use this indicator as an extra confluence or as a place to put your stop losses or to put your stop losses in profit.
I recommend always keeping the "Consider order block only with following FVG" on, as the best Order Blocks are found with that setting on.
I have a lot more code i can share, use this and let me know how it works for you!
THE SETTINGS I USE ARE:
(NO) Only show on on time levels 3,7,11,14
fractal bars 3
Order blocks on break of Fractal close or HL Close
(YES) Consider order block only with following FVG
Max distance of FVG following Order Blocks 2
Oder Block Height Body
Dotted 13 length and 3 width

VCAI BOS-Zone PROVCAI BOS-Zone PRO is a structure-driven order-block mapper that tracks swing highs/lows, detects Break of Structure (BOS), and automatically draws clean bullish and bearish OB zones with midlines and directional flags.
It provides a clear, rules-based map of where structural shifts occurred and where price may react on future retests.
What it does:
Uses configurable swing pivots to define structure.
A bullish BOS is triggered when price closes above the last swing high;
a bearish BOS when price closes below the last swing low.
After each BOS, the script finds the last opposite candle (bearish before a bullish BOS, bullish before a bearish BOS) and builds an order-block zone from that candle’s high/low.
Each zone is projected a fixed number of bars into the future, keeping charts clean and preventing zones from extending into the price scale.
Only the latest N bullish and N bearish zones are kept, so the chart focuses on the most relevant active levels.
How to read it:
Yellow boxes + BULL flags = bullish demand zones.
Purple boxes + BEAR flags = bearish supply zones.
The edges of each zone act as potential support/resistance.
Reactions inside a yellow zone suggest buy-side interest;
rejection at a purple zone suggests sell-side pressure.
Optional midlines mark the 50% level of each zone, commonly used for refined entries, mitigations, and partial management.
How traders typically use it:
BOS-Zone PRO does not generate buy/sell alerts, but many traders use the zones as part of a broader decision process:
Bullish zones are often monitored for long setups when price returns and shows strength or continuation.
Bearish zones are often monitored for short setups when price retests and shows rejection or weakness.
Midlines provide refined entry levels with clearer invalidation points.
This tool is best used as structural context alongside your own entry model, risk settings, and trade management.
Notes & best practices:
BOS is directional, not predictive — treat zones as context, not guaranteed reversals.
Works on all symbols and timeframes.
Lower swing settings capture local structure; higher settings focus on major breaks and cleaner OB's.
Ideal as a structural map for discretionary traders or as a component inside automated systems.
Part of the VCAI toolset.
We develop a range of market-structure, volume, trend and liquidity tools designed to work together or stand alone.

QuantMotions - Smart Money BlocksSmart Money Blocks – Clean Edition is a minimalistic, high-precision Smart Money Concepts (SMC) tool designed for traders who want clean and reliable market structure signals without chart clutter.
This script detects and visualizes Order Blocks, Fair Value Gaps (FVGs), and Liquidity Levels using a strictly filtered, volume-based institutional logic.
Unlike many SMC indicators that overload the chart with noise, this version is built to stay fast, clean, and accurate — ideal for both scalpers and higher-timeframe traders.
🔍 Features
✔ Institutional Order Block Detection
• Identifies bullish and bearish order blocks
• Uses high-volume + price-displacement confirmation
• OBs extend forward and deactivate when broken
• Includes volume + tick range info-box
✔ Fair Value Gaps (FVG)
• Auto-detects bullish and bearish FVGs
• Marks imbalance zones until they are fully filled
• Clean, non-intrusive visualization
✔ Liquidity Levels
• Smart swing-high/swing-low liquidity detection
• Tracks touches to distinguish strong vs weak levels
• Marks support/resistance liquidity with labels only (no chart clutter)
⚙️ Clean & Minimal Design
This script is optimized for a clean workflow:
• No volume profile
• No BOS/CHOCH spam
• No unused SMC elements
• Only high-value SMC signals
• Clean color theme for dark charts
The goal is to provide only what matters, nothing more.
📈 Use Cases
• Smart Money / ICT style trading
• Scalping (1s – 1m)
• Intraday / London & New York session trading
• Swing trading
• Market structure analysis
• Liquidity and imbalance mapping
Whether you're identifying points of interest (POIs), building a bias, or mapping high-probability reaction zones — this tool helps you see structure clearly.
🔔 Alerts Included
• Order Block creation
• FVG creation
• Price touching an active Order Block
• Volume surge
• Institutional candle detection
• Structure break detection
Great for automation or bias confirmation.
🧠 Why This Script?
Many SMC indicators try to do everything — which often results in clutter, lag, and unreliable signals.
This edition focuses on precision, clarity, and real usability.
The logic is light, efficient, and suited for real-time execution on very fast charts.
📌 Note
This tool does not generate trade signals by itself.
It is designed as a market structure map for traders who already understand Smart Money principles such as:
• Displacement
• Imbalance
• Institutional candles
• OB mitigation
• Liquidity sweeps
Use it as part of your confluence system.

Smart Money Flow Index (SMFI) - Advanced SMC [PhenLabs]📊Smart Money Flow Index (SMFI)
Version: PineScript™v6
📌Description
The Smart Money Flow Index (SMFI) is an advanced Smart Money Concepts implementation that tracks institutional trading behavior through multi-dimensional analysis. This comprehensive indicator combines volume-validated Order Block detection, Fair Value Gap identification with auto-mitigation tracking, dynamic Liquidity Zone mapping, and Break of Structure/Change of Character detection into a unified system.
Unlike basic SMC indicators, SMFI employs a proprietary scoring algorithm that weighs five critical factors: Order Block strength (validated by volume), Fair Value Gap size and recency, proximity to Liquidity Zones, market structure alignment (BOS/CHoCH), and multi-timeframe confluence. This produces a Smart Money Score (0-100) where readings above 70 represent optimal institutional setup conditions.
🚀Points of Innovation
Volume-Validated Order Block Detection – Only displays Order Blocks when formation candle exceeds customizable volume multiplier (default 1.5x average), filtering weak zones and highlighting true institutional accumulation/distribution
Auto-Mitigation Tracking System – Fair Value Gaps and Order Blocks automatically update status when price mitigates them, with visual distinction between active and filled zones preventing trades on dead levels
Proprietary Smart Money Score Algorithm – Combines weighted factors (OB strength 25%, FVG proximity 20%, Liquidity 20%, Structure 20%, MTF 15%) into single 0-100 confidence rating updating in real-time
ATR-Based Adaptive Calculations – All distance measurements use 14-period Average True Range ensuring consistent function across any instrument, timeframe, or volatility regime without manual recalibration
Dynamic Age Filtering – Automatically removes liquidity levels and FVGs older than configurable thresholds preventing chart clutter while maintaining relevant levels
Multi-Timeframe Confluence Integration – Analyzes higher timeframe bias with customizable multipliers (2-10x) and incorporates HTF trend direction into Smart Money Score for institutional alignment
🔧Core Components
Order Block Engine – Detects institutional supply/demand zones using characteristic patterns (down-move-then-strong-up for bullish, up-move-then-strong-down for bearish) with minimum volume threshold validation, tracks mitigation when price closes through zones
Fair Value Gap Scanner – Identifies price imbalances where current candle's low/high leaves gap with two-candle-prior high/low, filters by minimum size percentage, monitors 50% fill for mitigation status
Liquidity Zone Mapper – Uses pivot high/low detection with configurable lookback to mark swing points where stop losses cluster, extends horizontal lines to visualize sweep targets, manages lifecycle through age-based removal
Market Structure Analyzer – Tracks pivot progression to identify trend through higher-highs/higher-lows (bullish) or lower-highs/lower-lows (bearish), detects Break of Structure and Change of Character for trend/reversal confirmation
Scoring Calculation Engine – Evaluates proximity to nearest Order Blocks using ATR-normalized distance, assesses FVG recency and distance, calculates liquidity proximity with age weighting, combines structure bias and MTF trend into smoothed final score
🔥Key Features
Customizable Display Limits – Control maximum Order Blocks (1-10), Liquidity Zones (1-10), and FVG age (10-200 bars) to maintain clean charts focused on most relevant institutional levels
Gradient Strength Visualization – All zones render with transparency-adjustable coloring where stronger/newer zones appear more solid and weaker/older zones fade progressively providing instant visual hierarchy
Educational Label System – Optional labels identify each zone type (Bullish OB, Bearish OB, Bullish FVG, Bearish FVG, BOS) with color-coded text helping traders learn SMC concepts through practical application
Real-Time Smart Money Score Dashboard – Top-right table displays current score (0-100) with color coding (green >70, yellow 30-70, red <30) plus trend arrow for at-a-glance confidence assessment
Comprehensive Alert Suite – Configurable notifications for Order Block formation, Fair Value Gap detection, Break of Structure events, Change of Character signals, and high Smart Money Score readings (>70)
Buy/Sell Signal Integration – Automatically plots triangle markers when Smart Money Score exceeds 70 with aligned market structure and fresh Order Block detection providing clear entry signals
🎨Visualization
Order Block Boxes – Shaded rectangles extend from formation bar spanning high-to-low of institutional candle, bullish zones in green, bearish in red, with customizable transparency (80-98%)
Fair Value Gap Zones – Rectangular areas marking imbalances, active FVGs display in bright colors with adjustable transparency, mitigated FVGs switch to gray preventing trades on filled zones
Liquidity Level Lines – Dashed horizontal lines extend from pivot creation points, swing highs in bearish color (short targets above), swing lows in bullish color (long targets below), opacity decreases with age
Structure Labels – "BOS" labels appear above/below price when Break of Structure confirmed, colored by direction (green bullish, red bearish), positioned at 1% beyond highs/lows for visibility
Educational Info Panel – Bottom-right table explains key terminology (OB, FVG, BOS, CHoCH) and score interpretation (>70 high probability) with semi-transparent background for readability
📖Usage Guidelines
General Settings
Show Order Blocks – Default: On, toggles visibility of institutional supply/demand zones, disable when focusing solely on FVGs or Liquidity
Show Fair Value Gaps – Default: On, controls FVG zone display including active and mitigated imbalances
Show Liquidity Zones – Default: On, manages liquidity line visibility, disable on lower timeframes to reduce clutter
Show Market Structure – Default: On, toggles BOS/CHoCH label display
Show Smart Money Score – Default: On, controls score dashboard visibility
Order Block Settings
OB Lookback Period – Default: 20, Range: 5-100, controls bars scanned for Order Block patterns, lower values detect recent activity, higher values find older blocks
Min Volume Multiplier – Default: 1.5, Range: 1.0-5.0, sets minimum volume threshold as multiple of 20-period average, higher values (2.0+) filter for strongest institutional candles
Max Order Blocks to Display – Default: 3, Range: 1-10, limits simultaneous Order Blocks shown, lower settings (1-3) maintain focus on most recent zones
Fair Value Gap Settings
Min FVG Size (%) – Default: 0.3, Range: 0.1-2.0, defines minimum gap size as percentage of close price, lower values detect micro-imbalances, higher values focus on significant gaps
Max FVG Age (bars) – Default: 50, Range: 10-200, removes FVGs older than specified bars, lower settings (10-30) for scalping, higher (100-200) for swing trading
Show FVG Mitigation – Default: On, displays filled FVGs in gray providing visual history, disable to show only active untouched imbalances
Liquidity Zone Settings
Liquidity Lookback – Default: 50, Range: 20-200, sets pivot detection period for swing highs/lows, lower values (20-50) mark shorter-term liquidity, higher (100-200) identify major swings
Max Liquidity Age (bars) – Default: 100, Range: 20-500, removes liquidity lines older than specified bars, adjust based on timeframe
Liquidity Sensitivity – Default: 0.5, Range: 0.1-1.0, controls pivot detection sensitivity, lower values mark only major swings, higher values identify minor swings
Max Liquidity Zones to Display – Default: 3, Range: 1-10, limits total liquidity levels shown maintaining chart clarity
Market Structure Settings
Pivot Length – Default: 5, Range: 3-15, defines bars to left/right for pivot validation, lower values (3-5) create sensitive structure breaks, higher (10-15) filter for major shifts
Min Structure Move (%) – Default: 1.0, Range: 0.1-5.0, sets minimum percentage move required between pivots to confirm structure change
Multi-Timeframe Settings
Enable MTF Analysis – Default: On, activates higher timeframe trend analysis incorporation into Smart Money Score
Higher Timeframe Multiplier – Default: 4, Range: 2-10, multiplies current timeframe to determine analysis timeframe (4x on 15min = 1hour)
Visual Settings
Bullish Color – Default: Green (#089981), sets color for bullish Order Blocks, FVGs, and structure elements
Bearish Color – Default: Red (#f23645), defines color for bearish elements
Neutral Color – Default: Gray (#787b86), controls color of mitigated zones and neutral elements
Show Educational Labels – Default: On, displays text labels on zones identifying type (OB, FVG, BOS), disable once familiar with patterns
Order Block Transparency – Default: 92, Range: 80-98, controls Order Block box transparency
FVG Transparency – Default: 92, Range: 80-98, sets Fair Value Gap zone transparency independently from Order Blocks
Alert Settings
Alert on Order Block Formation – Default: On, triggers notification when new volume-validated Order Block detected
Alert on FVG Formation – Default: On, sends alert when Fair Value Gap appears enabling quick response to imbalances
Alert on Break of Structure – Default: On, notifies when BOS or CHoCH confirmed
Alert on High Smart Money Score – Default: On, alerts when Smart Money Score crosses above 70 threshold indicating high-probability setup
✅Best Use Cases
Order Block Retest Entries – After Break of Structure, wait for price retrace into fresh bullish Order Block with Smart Money Score >70, enter long on zone reaction targeting next liquidity level
Fair Value Gap Retracement Trading – When price creates FVG during strong move then retraces, enter as price approaches unfilled gap expecting institutional orders to continue trend
Liquidity Sweep Reversals – Monitor price approaching swing high/low liquidity zones against prevailing Smart Money Score trend, after stop hunt sweep watch for rejection into premium Order Block/FVG
Multi-Timeframe Confluence Setups – Identify alignment when current timeframe Order Block coincides with higher timeframe FVG plus MTF analysis showing matching trend bias
Break of Structure Continuations – After BOS confirms trend direction, trade pullbacks to nearest Order Block or FVG in direction of structure break using Smart Money Score >70 as entry filter
Change of Character Reversal Plays – When CHoCH detected indicating potential reversal, look for Smart Money Score pivot with opposing Order Block formation then enter on structure confirmation
⚠️Limitations
Lagging Pivot Calculations – Pivot-based features (Liquidity Zones, Market Structure) require bars to right of pivot for confirmation, meaning these elements identify levels retrospectively with delay equal to lookback period
Whipsaw in Ranging Markets – During choppy conditions, Order Blocks fail frequently and structure breaks produce false signals as Smart Money Score fluctuates without clear institutional bias, best used in trending markets
Volume Data Dependency – Order Block volume validation requires accurate volume data which may be incomplete on Forex pairs or limited in crypto exchange feeds
Subjectivity in Scoring Weights – Proprietary 25-20-20-20-15 weighting reflects general institutional behavior but may not optimize for specific instruments or market regimes, user cannot adjust factor weights
Visual Complexity on Lower Timeframes – Sub-hour timeframes generate excessive zones creating cluttered charts, requires aggressive display limit reduction and higher minimum thresholds
No Fundamental Integration – Indicator analyzes purely technical price action and volume without incorporating economic events, news catalysts, or fundamental shifts that override technical levels
💡What Makes This Unique
Unified SMC Ecosystem – Unlike indicators displaying Order Blocks OR FVGs OR Liquidity separately, SMFI combines all three institutional concepts plus market structure into single cohesive system
Proprietary Confidence Scoring – Rather than manual setup assessment, automated Smart Money Score quantifies probability by weighting five institutional dimensions into actionable 0-100 rating
Volume-Filtered Quality – Eliminates weak Order Blocks forming without institutional volume confirmation, ensuring displayed zones represent genuine accumulation/distribution
Adaptive Lifecycle Management – Automatically updates mitigation status and removes aged zones preventing trades on dead levels through continuous validity and age monitoring
Educational Integration – Built-in tooltips, labeled zones, and reference panel make indicator functional for both learning Smart Money Concepts and executing strategies
🔬How It Works
Order Block Detection – Scans for patterns where strong directional move follows counter-move creating last down-candle before rally (bullish OB) or last up-candle before sell-off (bearish OB), validates formations only when candle exhibits volume exceeding configurable multiple (default 1.5x) of 20-bar average volume
Fair Value Gap Identification – Compares current candle’s high/low against two-candles-prior low/high to detect price imbalances, calculates gap size as percentage of close and filters micro-gaps below minimum threshold (default 0.3%), monitors whether subsequent price fills 50% triggering mitigation status
Liquidity Zone Mapping – Employs pivot detection using configurable lookback (default 50 bars) to identify swing highs/lows where retail stops cluster, extends horizontal reference lines from pivot creation and applies age-based filtering to remove stale zones
Market Structure Analysis – Tracks pivot progression using structure-specific lookback (default 5 bars) to determine trend, confirms uptrend when new pivot high exceeds previous by minimum move percentage, detects Break of Structure when price breaks recent pivot level, flags Change of Character for potential reversals
Multi-Timeframe Confluence – When enabled, requests security data from higher timeframe (current TF × HTF multiplier, default 4x), compares HTF close against HTF 20-period MA to determine bias, contributes ±50 points to score ensuring alignment with institutional positioning on superior timeframe
Smart Money Score Calculation – Evaluates Order Block component via ATR-normalized distance producing max 100-point contribution weighted at 25%, assesses FVG factor through age penalty and distance at 20% weight, calculates Liquidity proximity at 20%, incorporates structure bias (±50-100 points) at 20%, adds MTF component at 15%, applies 3-period smoothing to reduce volatility
Visual Rendering and Lifecycle – Draws Order Block boxes, Fair Value Gap rectangles with color coding (green/red active, gray mitigated), extends liquidity dashed lines with fade-by-age opacity, plots BOS labels, displays Smart Money Score dashboard, continuously updates checking mitigation conditions and removing elements exceeding age/display limits
💡Note:
The Smart Money Flow Index combines multiple Smart Money Concepts into unified institutional order flow analysis. For optimal results, use the Smart Money Score as confluence filter rather than standalone entry signal – scores above 70 indicate high-probability setups but should be combined with risk management, higher timeframe bias, and market regime understanding.

Volume Order Block Scanner [BOSWaves]Volume Order Block Scanner - Dynamic Detection of High-Volume Supply and Demand Zones
Overview
The Volume Order Block Scanner introduces a refined approach to institutional zone mapping, combining volume-weighted order flow, structural displacement, and ATR-based proportionality to identify regions of aggressive participation from large entities.
Unlike static zone mapping or simplistic body-size filters, this framework dynamically evaluates each candle through a multi-layer model of relative volume, candle structure, and volatility context to isolate genuine order block formations while filtering out market noise.
Each identified zone represents a potential institutional footprint, defined by significant volume surges and efficient body-to-ATR relationships that indicate purposeful positioning. Once mapped, each order block is dynamically adjusted for volatility and tracked throughout its lifecycle - from creation to mitigation to potential invalidation - producing an evolving liquidity map that adapts with price.
This adaptive behavior allows traders to visualize where liquidity was absorbed and where it remains unfilled, revealing the structural foundation of institutional intent across timeframes.
Theoretical Foundation
At its core, the Volume Order Block Scanner is built on the interaction between volume displacement and structural imbalance. Traditional order block systems often rely on fixed candle formations or simple engulfing logic, neglecting the fundamental driver of institutional activity: volume concentration relative to volatility.
This framework redefines that approach. Each candle is filtered through two comparative ratios:
Relative Volume Ratio (RVR) - the candle’s volume compared to its rolling average, confirming genuine transactional surges.
Body-ATR Ratio (BAR) - a measure of displacement efficiency relative to recent volatility, ensuring structural strength.
Only when both conditions align is an order block validated, marking a displacement event significant enough to create a lasting imbalance.
By embedding this logic within a volatility-adjusted environment, the system maintains scalability across asset classes and volatility regimes - equally effective in crypto, forex, or index markets.
How It Works
The Volume Order Block Scanner operates through a structured multi-stage process:
Displacement Detection - Identifies candles whose body and volume exceed dynamic thresholds derived from ATR and rolling volume averages. These represent the origin points of institutional aggression.
Zone Construction - Each qualified candle generates an order block with ATR-proportional dimensions to ensure consistency across instruments and timeframes. The zone includes two regions: Body Zone (the precise initiation point of displacement) and Wick Imbalance (the residual inefficiency representing unfilled liquidity).
Lifecycle Tracking - Each zone is continuously monitored for market interaction. Reactions within a defined window are classified as respected, mitigated, or invalidated, giving traders a data-driven sense of ongoing institutional relevance.
Volume Confirmation Layer - Reinforces signal integrity by ensuring that all detected blocks correspond with meaningful increases in transactional activity.
Temporal Decay Control - Zones that remain untested beyond a set period gradually lose visual and analytical weight, maintaining chart clarity and contextual precision.
Interpretation
The Volume Order Block Scanner visualizes how institutional participants interact with the market through zones of accumulation and distribution.
Bullish order blocks denote demand imbalances where price displaced upward under high volume; bearish order blocks signify supply regions formed by concentrated selling pressure.
Price revisiting these areas often reflects institutional re-entry or liquidity rebalancing, offering actionable insights for both continuation and reversal scenarios.
By continuously monitoring interaction and expiry, the framework enables traders to distinguish between active institutional footprints and historical liquidity artifacts.
Strategy Integration
The Volume Order Block Scanner integrates naturally into advanced structural and order-flow methodologies:
Liquidity Mapping : Identify high-volume regions that are likely to influence future price reactions.
Break-of-Structure Confirmation : Validate BOS and CHOCH signals through aligned order block behavior.
Volume Confluence : Combine with BOSWaves volume or momentum indicators to confirm real institutional intent.
Smart-Money Frameworks : Utilize order block retests as precision entry zones within SMC-based setups.
Trend Continuation : Filter zones in line with higher-timeframe bias to maintain directional integrity.
Technical Implementation Details
Core Engine : Dual-filter mechanism using Relative Volume Ratio (RVR) and Body-ATR Ratio (BAR).
Volatility Framework : ATR-based scaling for cross-asset proportionality.
Zone Composition : Body and wick regions plotted independently for visual clarity of imbalance.
Lifecycle Logic : Real-time monitoring of reaction, mitigation, and invalidation states.
Directional Coloring : Distinct bullish and bearish shading with adjustable transparency.
Computation Efficiency : Lightweight structure suitable for multi-timeframe or multi-asset environments.
Optimal Application Parameters
Timeframe Guidance:
5m - 15m : Reactive intraday zones for short-term liquidity engagement.
1H - 4H : Medium-term structures for swing or intraday trend mapping.
Daily - Weekly : Macro accumulation and distribution footprints.
Suggested Configuration:
Relative Volume Threshold : 1.5× - 2.0× average volume.
Body-ATR Threshold : 0.8× - 1.2× for valid displacement.
Zone Expiry : 5 - 10 bars for intraday use, 15 - 30 for swing/macro contexts.
Parameter optimization should be asset-specific, tuned to volatility conditions and liquidity depth.
Performance Characteristics
High Effectiveness:
Markets exhibiting clear displacement and directional flow.
Environments with consistent volume expansion and liquidity inefficiencies.
Reduced Effectiveness:
Range-bound markets with frequent false impulses.
Low-volume sessions lacking institutional participation.
Integration Guidelines
Confluence Framework : Pair with structure-based BOS or liquidity tools for validation.
Risk Management : Treat active order blocks as contextual areas of interest, not guaranteed reversal points.
Multi-Timeframe Logic : Derive bias from higher-timeframe blocks and execute from refined lower-timeframe structures.
Volume Verification : Confirm each reaction with concurrent volume acceleration to avoid false liquidity cues.
Disclaimer
The Volume Order Block Scanner is a quantitative mapping framework designed for professional traders and analysts. It is not a predictive or guaranteed system of profit.
Performance depends on correct configuration, market conditions, and disciplined risk management. BOSWaves recommends using this indicator as part of a comprehensive analytical process - integrating structural, volume, and liquidity context for accurate interpretation.

ICT SMART MONEY__Advanced Multi-Timeframe Target TREND indicator with comprehensive ICT (Inner Circle Trader) concepts, session analysis, and smart money concepts for professional forex and crypto trading.__
---
### __🔥 Core Features:__
#### __📈 Multi-Timeframe Analysis__
- __7 Timeframe Table__: 1min, 5min, 15min, 30min, 1hour, 4hour, Daily analysis
- __Target System__: Stop Loss, Entry, TP1, TP2, TP3 calculations for each timeframe
- __Trend Direction__: Visual arrows showing bullish/bearish bias across all timeframes
#### __⚡ ICT Killzone Sessions__
- __4 Major Sessions__: Asia KZ, London KZ, NY AM, NY PM with colored session boxes
- __Pivot Lines__: Automatic high/low detection with full format labels ("ASIA High", "LONDON Low")
- __Global Label Alignment__: All session labels perfectly aligned for professional appearance
- __Range Analytics__: Real-time pip calculations with historical averages and Turkish volatility analysis
#### __🌍 Trading Session Management__
- __Individual Controls__: Asia/London sessions auto-enabled, NY sessions optional
- __Horizontal Lines__: Clean session high/low tracking without clutter
- __NY Lunch Session__: Additional 11:30-13:30 session for advanced analysis
- __Session Transparency__: Adjustable transparency levels for optimal chart visibility
#### __📍 Professional Key Levels__
- __Monday High/Low__: Weekly opening reference levels
- __Previous Day High/Low__: Daily support/resistance zones
- __Previous Week High/Low__: Major weekly levels
- __Full Format Labels__: "Previous Day High" instead of "PDH" for crystal clarity
- __160 Bar Distance__: Optimized label positioning for clean charts
#### __🔗 Liquidity Trendlines__
- __Automatic Detection__: 8-bar lookback pivot detection system
- __Breakout Signals__: Visual alerts when trendlines are broken
- __Dynamic Padding__: 4.0 ATR-based trendline spacing
- __Bullish/Bearish Colors__: Clear color coding for trend direction
#### __💎 Smart Money Concepts (SMC)__
- __Fair Value Gaps (FVG)__: Automatic gap detection with mitigation tracking
- __Structure Analysis__: BOS (Break of Structure) and CHoCH (Change of Character) detection
- __Structure Fibonacci__: 5-level fibonacci retracements (78.6%, 70.5%, 61.8%, 50%, 38.2%)
- __Lifecycle Management__: Complete FVG and structure history tracking
#### __📊 Range Analytics Table__
- __Session Volatility__: Current pip movement vs historical averages
- __Turkish Analysis__: "Güçlü Momentum", "Yüksek Aktivite", "Normal Aktivite", "Düşük Hareket", "Zayıf Session"
- __Integrated Display__: Seamlessly positioned below multi-timeframe table
- __Professional Formatting__: Color-coded session identification with status analysis

My setup [Pro] (fadi)My Setup is a powerful TradingView indicator that visualizes your trading strategy, helping you find high-probability setups with precision and discipline. It combines Higher Timeframe (HTF) context with Lower Timeframe (LTF) entries on a single chart, streamlining your trading process.
What It Does
Tracks your chosen timeframe and its paired higher timeframe for custom trade setups, so you don’t have to stay glued to the screen.
Plots clear Entry, Stop Loss, and Take Profit levels when your conditions align.
Customizes to your strategy with HTF triggers (e.g., sweeps, liquidity grabs) and LTF entries (e.g., Order Blocks, FVGs, Breakers).
Ensures discipline by only showing setups that meet all your rules, eliminating emotional trading and FOMO.
Backtest your edge by visualizing past setups to refine entries, stops, and confluences.
How It Works
Set Your HTF Trigger: Choose a market event like a sweep of a high/low, pivot point, or liquidity grab on the paired higher timeframe (e.g., 1H for a 5m chart).
Define Your LTF Entry: Select your entry model from a range of institutional concepts, such as Order Block, Fair Value Gap (FVG), Inverted FVG (iFVG), Breaker Block, Unicorn Model, and more, on the chart’s timeframe.
Add Confluence Filters: Stack conditions like requiring an FVG + Breaker for higher-probability setups.
See It on Your Chart: When a setup forms, it’s instantly plotted with Entry, Stop Loss, and Take Profit levels based on your Risk-to-Reward ratio.
Key Features
Multi-Timeframe Sync: Pair your chart’s timeframe (e.g., 5m) with a higher timeframe (e.g., 1H) for seamless analysis.
Institutional Tools: Supports a comprehensive suite of ICT concepts, including Order Blocks, FVGs, iFVGs, Breakers, Unicorn Model, and additional entry models.
Custom Risk Management: Set your Stop Loss and Take Profit levels with fixed R:R or measured moves using large range of entry and stop levels.
Session Filtering: Limit setups to specific trading sessions (e.g., London, New York) with timezone support.
Visual Clarity: Displays HTF candles and key levels on your chart for context, with customizable colors and styles.
Alerts: Get notified the moment a valid setup appears, even on live candles.
Who It’s For
Traders who want to systematize their ICT-based strategy on a single chart.
Those seeking to trade with discipline and avoid impulsive decisions.
Anyone looking to backtest and optimize their setups with clear, visual feedback.
Busy traders who need a tool to track their chart while they focus on life.
Why Choose My Setup ?
Save Time: Let the indicator track your chart and its paired timeframe.
Trade Confidently: Only take A+ setups that match your exact rules.
Learn and Improve: Analyze historical setups to refine your strategy.
Disclaimer of Warranties and Limitation of Liability for [My Setup ]
Please read this disclaimer carefully before using the [My Setup ] indicator (hereafter referred to as "the Software").
1. No Financial Advice
The Software is provided for educational and informational purposes only. The data, calculations, and signals generated by the Software are not, and should not be interpreted as, financial advice, investment advice, trading advice, or a recommendation or solicitation to buy, sell, or hold any security or financial instrument.
2. Assumption of Risk You acknowledge that trading and investing are inherently risky activities that carry a high potential for significant financial loss. All actions you take in the market, including but not limited to trade execution and risk management, are your sole responsibility. You agree to use the Software at your own sole risk. The creator shall not be held responsible or liable for any financial losses or damages you may incur as a result of using the Software.
3. No Warranty; "AS IS" Provision
The Software is provided "AS IS" and "AS AVAILABLE", without any warranties of any kind, either express or implied. The creator disclaims all warranties, including, but not limited to, implied warranties of merchantability, fitness for a particular purpose, accuracy, timeliness, completeness, and non-infringement.
The creator does not warrant that the Software will be error-free, uninterrupted, secure, or free of bugs, viruses, or other harmful components. You acknowledge that software is never wholly free from defects, and you are responsible for implementing your own procedures for data accuracy and security.
4. Limitation of Liability
TO THE MAXIMUM EXTENT PERMITTED BY APPLICABLE LAW, IN NO EVENT SHALL THE CREATOR, FADI ZEIDAN, BE LIABLE FOR ANY CLAIM, DAMAGES, OR OTHER LIABILITY, WHETHER IN AN ACTION OF CONTRACT, TORT, OR OTHERWISE, ARISING FROM, OUT OF, OR IN CONNECTION WITH THE SOFTWARE OR THE USE OR OTHER DEALINGS IN THE SOFTWARE.
This limitation of liability applies to any and all damages, including but not limited to:
Direct, indirect, incidental, special, consequential, or exemplary damages.
Loss of profits, revenue, data, or use.
Financial losses resulting from trading decisions made based on the Software.
Damages arising from software defects, interruptions, or inaccuracies.
5. Indemnification
You agree to indemnify, defend, and hold harmless the creator, Fadi Zeidan, from and against any and all claims, liabilities, damages, losses, or expenses, including reasonable attorneys' fees and costs, arising out of or in any way connected with your access to or use of the Software.
6. Acknowledgment and Agreement
By accessing, installing, or using the [My Setup ] indicator, you acknowledge that you have read, understood, and agree to be bound by the terms of this disclaimer. If you do not agree with these terms, you must not use the Software.

OrderBlocks by exp3rts (Non-Repainting)The OrderBlocks by exp3rts indicator automatically identifies and visualizes bullish and bearish order blocks using confirmed, non-repainting fractals combined with Fair Value Gap (FVG) validation for enhanced accuracy.
This tool is designed to help traders spot high-probability institutional price zones — areas where large buy or sell orders previously caused significant moves — allowing you to anticipate potential reversal, continuation, or mitigation levels with precision.
Core Features
✅ Non-Repainting Logic: Uses confirmed 3- or 5-bar fractals only after full pattern completion.
📈 Dynamic Order Block Detection: Marks both bullish and bearish OBs automatically.
⚖️ FVG Filter (Optional): Optionally require a Fair Value Gap within a user-defined distance to confirm valid OBs.
🎯 Customizable OB Lines: Adjust color, style (solid, dashed, dotted), width, and body/wick placement.
🧹 Auto-Cleanup: Option to remove order block lines once price has been mitigated (touched/filled).
🔺🔻 Fractal Display: Toggle fractal highs/lows on or off for extra structure clarity.
⚡ Optimized for Performance: Uses efficient array management to run smoothly within TradingView’s bar processing limits.
How to Use
Add the indicator to your chart.
Adjust settings such as Fractal Filter (3/5), FVG distance, and Line Style to match your trading preference.
Watch for bullish OBs (green lines) near potential demand zones and bearish OBs (red lines) near supply zones.
Use in confluence with market structure and liquidity concepts for best results.
Settings Overview
Fractal Filter: Choose between 3-bar or 5-bar swing fractals.
Order Block Type: Detect OBs based on Close or High/Low break structure.
FVG Filter: Optionally require nearby Fair Value Gaps.
Delete After Fill: Automatically remove mitigated OBs.
Visuals: Customize line color, thickness, and style for clear chart integration.
Made for any timeframe & any market.
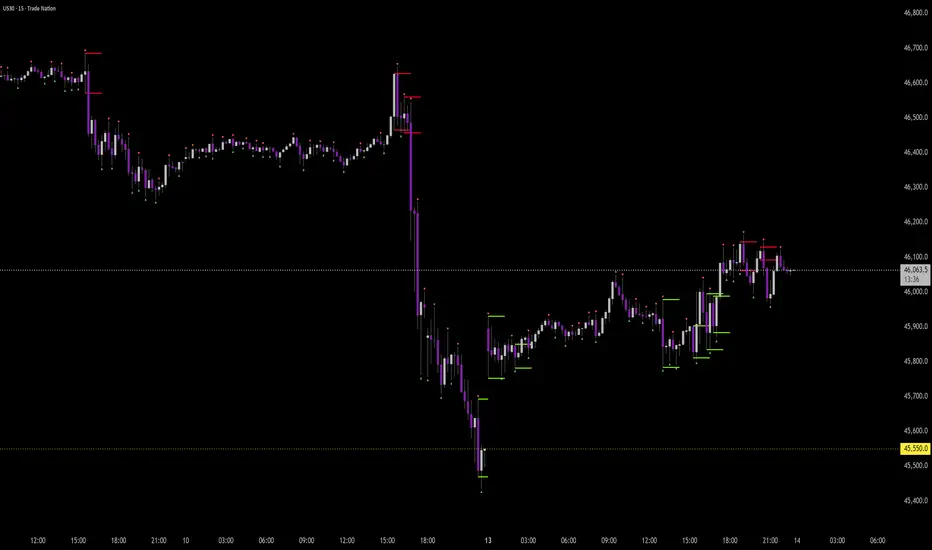
Price Action Trader [BackQuant]Price Action Trader
Introduction
Price Action Trader is an all-in-one, chart-side workflow for reading trend, timing impulses, and mapping high-probability zones the way discretionary traders actually trade. It blends an ensemble trend engine with clean price-action building blocks—Market Structure (BOS/MSB), Fair Value Gaps, Order Blocks, and Volumetric Support/Resistance—so you can form a bias, find confluence, and execute with context.
What is it
A modular “price-action stack” that:
Paints trend bias and impulse shifts on the chart (optional candle coloring).
Auto-annotates internal & swing structure (BOS / MSB).
Finds FVGs on your chosen timeframe and draws them cleanly.
Detects Order Blocks (with optional FVG confirmation).
Builds volumetric S/R levels that adapt to liquidity.
Emits alerts for key events (new levels, touches, breaks, OB creation/touch).
Everything is configurable—keep it minimal (trend + a few zones) or run the full toolkit.
What’s it used for
Bias first, trade second: establish direction/conviction, then execute where structure, gaps, blocks, and volume agree.
Timing: impulse flips and level touches provide actionable triggers.
Risk placement: OB edges, FVG midlines, and volumetric bands give logical stop/target references.
Review & journaling: optional session shading and labeled structures make post-trade notes simple.
Composite Trend Model
A lightweight signal line (default: 30-period) that turns green when the composite regime is bullish and red when bearish. Under the hood, multiple cues (adaptive momentum, de-noised oscillation, volatility-aware filters) are blended into a single directional score; when thresholds flip, the line recolors and optional Long/Short dots appear.
How to use
Treat the line as your bias rail : favor longs while green, shorts while red.
Flat/rapid flips = stand down or reduce size.
Prefer clean charts? Keep only the line and (optionally) trend-painted candles.
Inputs to know
Show Trend Signal Line / Width.
Paint Candles by Trend.
Long/Bearish color controls.
Impulse Model
Highlights short-term pressure shifts with optional impulse candle coloring and ▲/▼ markers. Great for entries in the prevailing trend and for early warnings when impulses fire against bias.
How to use
Up-bias: look for the next impulse-up near structure/FVG/OB or volumetric support.
Down-bias: mirror the logic.
Frequent counter-impulses → expect chop or regime change.
Inputs to know
Show Impulse Signals.
Paint Impulse Candles.
Market Structure
Automatic Internal (tight lookback) and Swing (wider lookback) structure with BOS and MSB (CHoCH) labels. You decide what to show—All, BOS only, MSB only—independently for internal vs swing.
How to use
Use Swing labels for the primary map; Internal for entry refinement.
After a bullish MSB , seek the first HL back into support/FVG/OB.
After a bearish BOS , favor LH fades into resistance/FVG/OB.
Inputs to know
Swing Lookback / Internal Lookback.
Swing/Internal Structure: All | BOS | MSB | None .
Separate bull/bear color controls for both layers.
Fair Value Gaps
Detects bullish/bearish FVGs on the current or higher TF, draws boxes, and can extend them forward. Midlines provide quick visual targeting.
How to use
In-trend fills: in an up-bias, tags of bullish FVGs often offer high-quality continuation entries, especially with structure/OB confluence.
Failed fills: rejections at the midline can signal emerging strength/weakness.
Inputs to know
Show FVG / Show Last N / Extend.
Timeframe (blank = chart TF; set higher TF for macro FVGs).
Bull/Bear colors (tune opacity to taste).
Volumetric Support and Resistance
Builds adaptive S/R from price interaction + relative volume over a rolling lookback. Levels store touch counts; you can show volume stats on labels or inside boxes. Transparency and border thickness can scale with volume so stronger levels are visually louder. Broken levels can auto-remove.
How to use
Use as confluence with structure, OBs, and FVGs. A long at volumetric support + Bull OB + FVG midline is qualitatively different from a naked level.
If a level breaks on strong volume, stop fading—flip expectations or wait for a clean retest.
Inputs to know
Detection Sensitivity / Volume Multiplier.
Analysis Period / Max Levels / Min Distance (%).
Remove Broken / Extend Right / Show Volume Info / Text Inside.
Support/Resistance colors (+ high-vol variants).
Alerts
New Support/Resistance Level Created.
Level Touch.
Level Break.
Order Blocks
Detects bullish/bearish OBs using configurable fractals (3- or 5-bar) with a break confirmation (by Close or High/Low). Optional FVG proximity filter, right-extension, and auto-delete when filled.
How to use
Bullish bias: stalk pullbacks into fresh Bull OBs aligned with a bullish FVG or volumetric support.
If price fills an opposing OB and fails to continue, reassess bias—context may be shifting.
Inputs to know
Fractal Type & Break Method (Close / HL).
Filter with FVG + Max FVG Distance.
Extend Blocks / Delete When Filled / Show Labels.
Alerts
New Order Block Created.
Order Block Touch.
Final Notes
Suggested workflow
Start with Composite Trend (bias).
Mark Swing structure in that direction.
Wait for an Impulse in-direction near an OB / FVG / Volumetric level.
Risk = nearest opposite level or OB edge; targets = FVG midlines / next S/R.
Timeframes & assets
Defaults suit liquid intraday and 1–4H swing.
Slower markets → lengthen lookbacks, lower sensitivity.
Very noisy crypto → keep trend visible, trim drawings (e.g., MSB only, last 3–5 FVGs, 8–12 volume levels).
Keep it readable
Turn off modules you don’t need today—fewer, higher-quality signals beat clutter.
About this release
Internal scoring, smoothing, and detection logic are proprietary. Behavior is controlled via inputs described above.
Trade with a plan, test your settings, and let confluence do the heavy lifting.