Order Blocks [TakingProphets]The Order Blocks indicator automatically finds and highlights institutional Order Blocks (OBs) on your chart — powerful price zones where smart money has previously entered the market with large orders. These areas often act as strong support or resistance, and they’re key tools for traders using ICT (Inner Circle Trader) and Smart Money Concepts (SMC) strategies.
📘 What’s an Order Block?
An Order Block is usually the last bullish or bearish candle before a big move or shift in market structure. It represents where banks, funds, or institutions placed large buy or sell orders. Retail traders often miss these zones, but smart money traders use them to anticipate where price may return, stall, or even reverse.
This indicator identifies these zones for you — both bullish and bearish — so you don’t have to manually mark them.
🔍 How the Indicator Works
It waits for a market structure shift — when price breaks out of a recent high or low range.
Then it looks back to find the last opposite candle before that breakout — that candle becomes the OB.
It draws a box from the open of that candle to the high/low (depending on type) and keeps updating the box forward.
You can choose how strict the OBs need to be (Small, Medium, or Large) using ATR-based size filtering.
🔄 Breaker Blocks (Optional Feature)
If price closes through an Order Block in the opposite direction, that OB is considered invalid. But instead of deleting it, the indicator can automatically draw a Breaker Block. Breakers are important because they often become new support or resistance zones — a sign the market has flipped direction and is now respecting that level in a new way.
🎛 Custom Settings
Choose OB detection sensitivity: High (shows smaller moves), Medium, or Low (only the biggest institutional moves).
Customize colors and whether you want to show borders on each block.
Turn Breaker Blocks on or off based on your strategy.
Everything is dynamic and updates live as price evolves.
💡 Why Use It?
Knowing where smart money entered the market gives you a huge edge. Price often returns to these Order Blocks to "rebalance" or fill unfilled orders. With this indicator, you’ll:
Spend less time marking charts.
Spot high-probability entry zones faster.
Avoid common retail traps and trade with the algorithm.
Orderblock

Volume Order Blocks [BigBeluga]Volume Order Blocks is a powerful indicator that identifies significant order blocks based on price structure, helping traders spot key supply and demand zones. The tool leverages EMA crossovers to determine the formation of bullish and bearish order blocks while visualizing their associated volume and relative strength.
🔵 Key Features:
Order Block Detection via EMA Crossovers:
Plots bullish order blocks at recent lows when the short EMA crosses above the long EMA.
Plots bearish order blocks at recent highs when the short EMA crosses below the long EMA.
Uses customizable sensitivity through the “Sensitivity Detection” setting to fine-tune block formation.
Volume Collection and Visualization:
Calculates the total volume between the EMA crossover bar and the corresponding high (bearish OB) or low (bullish OB).
Displays the absolute volume amount next to each order block for clear volume insights.
Percentage Volume Distribution:
Shows the percentage distribution of volume among bullish or bearish order blocks.
100% represents the cumulative volume of all OBs in the same category (bullish or bearish).
Order Block Removal Conditions:
Bullish order blocks are removed when the price closes below the bottom of the block.
Bearish order blocks are removed when the price closes above the top of the block.
Helps maintain chart clarity by only displaying relevant and active levels.
Midline Feature:
Dashed midline inside each order block indicates the midpoint between the upper and lower boundaries.
Traders can toggle the midline on or off through the settings.
Shadow Trend:
Shadow Trend dynamically visualizes trend strength and direction by adapting its color intensity based on price movement.
🔵 Usage:
Supply & Demand Zones: Use bullish and bearish order blocks to identify key market reversal or continuation points.
Volume Strength Analysis: Compare volume percentages to gauge which order blocks hold stronger market significance.
Breakout Confirmation: Monitor block removal conditions for potential breakout signals beyond support or resistance zones.
Trend Reversals: Combine EMA crossovers with order block formation for early trend reversal detection.
Risk Management: Use OB boundaries as potential stop-loss or entry points.
Volume Order Blocks is an essential tool for traders seeking to incorporate volume-based supply and demand analysis into their trading strategy. By combining price action, volume data, and EMA crossovers, it offers a comprehensive view of market structure and potential turning points.

Advanced Market Structure & Order Blocks (fadi)Advanced Market Structure & Order Blocks indicator provides a new approach to understanding price action using ICT (Inner Circle Trader) concepts related to candle blocks to analyze the market behavior and eliminate much of the noise created by the price action.
This indicator is not intended to provide trade signals, it is designed to provide the traders with to support their trading strategies and add clarity where possible.
There are currently three main elements to this indicator:
Market Structure
Order Blocks
Liquidity Voids
Market Structure
In trading, market structure is often identified by observing higher highs and higher lows. An uptrend is characterized by a series of higher highs, where each peak surpasses the previous one, and higher lows, where each trough is higher than the preceding one. Conversely, a downtrend is marked by lower highs and lower lows.
Other indicators usually determine these peaks by calculating the highest or lowest levels within a predefined number of candles. For example, identifying the highest price level within the last 15 candles and marking it as a higher high or a lower high. While this approach offers some structure to price action, it can be arbitrary and random due to price fluctuations and the lack of proper structure analysis beyond finding the highest peaks and valleys within candle ranges.
In his 2022 mentorship, episode 12, ICT introduced an alternative approach focusing on three-candle pivots called Short Term High and Low (STH/STL), which are then used to calculate the Intermediate Term High and Low (ITH/ITL), and in turn, the Long Term High and Low (LTH/LTL). ICT’s approach provides better structure than the traditional method mentioned above. However, it can be confusing and difficult to track. There are great indicators that track and label ICT’s levels, but traders still find it challenging to follow and understand.
The Advanced Market Structure indicator takes a unique approach by analyzing candle formations, using ICT concepts, to identify possible turning points that mimic a real trader’s analysis of price action as closely as possible. However, it should be expected that Market Makers may use market manipulation to induce traders to make failed trades, and no tooling can eliminate these situations.
Advanced Market Structure tracks true Peaks and Valleys as they form, confirms them, and marks the chart with corresponding labels using traditional labeling methods (HH/HL/LH/LL), as such labeling makes it easier for traders to follow and understand. The indicator also draws levels to help identify possible liquidity areas and trade targets.
The indicator uses different calculation methods for the different type of market structure length, however all calculations are based on the same ICT candle blocks concepts.
Market Structure Settings
Other than the display settings, there are four (4) settings, mainly under the Level Settings section.
Allow Nested Candles
This option is only available on the Short Market Structure due to the methods used in calculating highs and lows. When used, the indicator will attempt to detect smaller fluctuations in price by tracking smaller candle moves, if any.
Level Settings
Level Settings allows the trader to decide two main calculations:
1. A new pivot point will form when a candle’s is crossed by the following candle’s
2. For a liquidity sweep and marking a level as mitigated, a candle’s must cross that level
Order Blocks
ICT (Inner Circle Trader) defines an Order Block as the last down-closing candle, or series of candles, before a significant upward price move or the last up-closing candle, or series of candles, before a significant downward price move. These key price levels, marked by substantial buy or sell orders from institutional traders or "smart money," create a block or zone on the price chart. When the price revisits these levels, it often leads to a strong market reaction. Order Blocks can consist of one or multiple consecutive candles of the same color, signaling areas of significant buying or selling interest. ICT's approach to Order Blocks provides traders with a structured method to identify potential areas of support or resistance, where price movements are more likely to change direction. Although ICT has shared some criteria for identifying Order Blocks publicly, the full details are reserved for his upcoming books. This indicator leverages the publicly available information to provide traders with valuable insights into these crucial price levels.
The Advanced Market Structure indicator is designed to be highly flexible, allowing traders to define their own combination of rules for identifying Order Blocks, thus customizing it to fit their unique trading strategies.
Order Block Configuration
Can be nested
An Order Block is defined as the last down candle or candles before a strong move higher, and vice versa for bearish Order Blocks. However, larger-than-usual candles resulting from news events or price action may not qualify as Order Blocks and can mute any Order Block within their range.
The "Can be nested" flag ensures that each Order Block is treated as an independent entity, even if it appears within the body of another Order Block.
Forms at swing point
Order Blocks formed at swing points typically have higher probabilities but are less frequent, assuming the same rules are applied. Additionally, Order Blocks at swing points may become Breaker and Mitigation blocks if they fail, providing more trading opportunities.
Forms a simple pivot point
A simple pivot point corresponds to ICT Short Term High and Low (STH/STL). Order Blocks using simple pivot points can occur in the middle of a move, not just at swing points. These are useful for identifying IOFED setups and supporting blocks that can bolster the price move.
Causes Market Structure Shift
Order Blocks that result in a break above or below a short swing point can help narrow down target order blocks, but they are less frequent. An Order Block causing a break above or below a pivot point does not necessarily indicate a strong Order Block. For example, an Order Block formed at a Lower Low is more likely to fail in a downtrend.
A clean close above order block
When the first candle breaks above an Order Block and closes above its high, this indicates a stronger Order Block. On the other hand, if a candle merely wicks through the Order Block without a solid close above it, it suggests a weaker Order Block. This may indicate hesitation or an impending reversal, as the wick represents a temporary and unsustained price movement.
Has displacement more than X the body
While some traders may capitalize on the initial break above an Order Block's CISD level, others prefer to focus on the return to an Order Block after displacement. Displacement is determined by the body size of the Order Block, and an Order Block cannot be tested until this level has been achieved.
Has a Fair Value Gap
When an Order Block is combined with a Fair Value Gap (FVG), it signifies a strong Order Block. The Fair Value Gap indicates a strong price movement away from the Order Block.
Has a liquidity void
A Liquidity Void occurs when two consecutive candles of the same color do not overlap, creating a gap similar to a Fair Value Gap, but involving one or more middle candles. Liquidity Voids can be utilized in combination with, or as an alternative to, the displacement setting.
Maximum number of OBs
The maximum number of Order Blocks to display.
Mitigated at block’s
An Order Block is considered mitigated when price reaches one of the main Order Block levels.
Liquidity Void
Liquidity Void refers to areas on a price chart where there is one-sided trading activity. This phenomenon occurs when the price of an asset moves sharply in one direction, leaving gaps where two consecutive candles of the same color do not overlap. These gaps can comprise one or more middle candles and indicates a pronounced lack of trading within that price range. Liquidity Voids are important because they highlight areas of minimal resistance, where price is more likely to return to fill the void and balance the market.
Liquidity Void vs Fair Value Gap
While both concepts are related to gaps in price action, they are distinct. A Fair Value Gap is a specific three-candle pattern where the middle candle creates a gap between the first and third candles. In contrast, a Liquidity Void represents a broader area on the chart where there is little to no trading activity, often encompassing multiple candles and indicating a more pronounced imbalance between buy and sell orders.
A FVG can be part of a Liquidity Void, a Liquidity Void can exist without necessarily including an FVG. Both concepts highlight areas of minimal resistance and potential price movement, but they differ in their formation and implications.
Advanced Market Structure and Order Blocks indicator focus on liquidity voids since a liquidity void can substitute for a FVG and it is usually less addressed by other indicators.

OrderBlocksLibrary "OrderBlocks"
This is a library I created that creates order blocks. It's originated from my indicator "Order blocks" (). It will return a Zone object that can be used to draw an order block. If you want to see how that is done you can check out my indicar that uses the same logic.
Create(settings)
Creates an order block if one is found according to the settings parameter.
Parameters:
settings (Settings) : set all values in this parameter to define the settings for the order block creation.
Returns: a Zone object if an order block is found, na otherwise
Zone
Fields:
Time (series int)
TimeClose (series int)
High (series float)
Low (series float)
ReactionLimit (series float)
TouchedZone (Zone type from mickes/Touched/14)
Type (series int)
Zones
Fields:
Index (series int)
Maximum (series int)
Zones (array)
Remove (Zone)
Settings
Fields:
TakeOut (series bool)
ReactionFactor (series float)
Type (series string)
ConsecutiveRisingOrFalling (series bool)
FairValueGap (series bool)
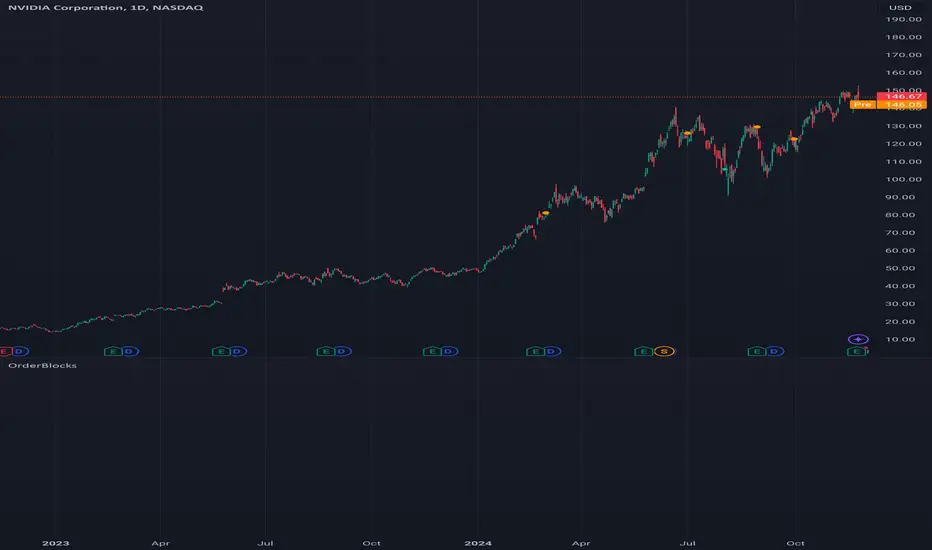
Order blocksHi all!
This indicator will show you found order blocks that can be used as supply or demand. It's my take on trying to create good order blocks and I hope it makes sense.
First off I suggest to verify the current trend before using an order block. This can be done in a variety of ways, one way could be to use my other script "Market structure" () which I use and suggest.
You can configure the indicator to behave differently depending on settings. These are the settings available:
• The order blocks created can be found in any higher timeframe defined in "Timeframe"
• The number of active order blocks are defined in "Count". If an order block is found the earliest order block will be replaced
• You can choose the type of order blocks that are found ("Bullish", "Bearish " or "Both") in "Type"
• The old order blocks can be kept if "Keep history" is checked
• Order blocks that are found are not removed when mitigated (entered) but when a new one appears. They can be removed when they are broken by price if "Remove broken zones" are checked
There is also a setting section called "Requirements" that defines what is required for an order block to be created. These are the settings:
• "Take out"
Check this if you want the base of the order block (the candle where the zone is drawn from (high and low)) to have to take out the previous candle (be higher or lower depending if the order block is bullish or bearish).
• "Consecutive rising/falling"
Each following candle in the reaction (the 3 reaction candles) needs to reach higher or lower (depending on bullish or bearish). Check this if you want that to be true.
• "Reaction"
Some sort of reaction is needed from the 3 candles creating the order block. This reaction is based on the value of the Average True Length (ATR) of length 14. You can here define a factor of the value from the ATR that these 3 candles needs to move in price. A higher need for a reaction (higher factor of the ATR) will create lesser zones. You can also choose to show this limit with the checkbox.
• "Fair Value Gap"
The reaction needs to create a gap (imbalance) in price. This gap is known as a "Fair Value Gap" and is created when the last candle's wick does not meet with the base candle's wick. Check this if you want this to be needed.
After these settings you can also choose the colors of the created zones. The ones that are active (called "Zones"), the ones that are replaced ("Replaced zones") and the ones that are broken ("Broken zones") (if this is enabled in "Remove broken zones").
I'm using my library "Touched" to be able to show you labels when the order blocks have a retest, false breakout and breakout. These labels can be hidden if you disable the labels under the style tab in the indicator settings.
The concept of order blocks is widely used among traders and can provide you with good supply or demand zones. I hope that this indicator makes sense.
My todo-list has a few things, but top of that list is adding alerts for zone interactions or creations. Please feel free to say what you want to be coded!
The order blocks in the publication chart are found in weekly timeframe but are shown on the daily timeframe. Other than that the image shows you zones from the default settings (which are based on the daily timeframe).
Best of luck trading!
3 CANDLE SUPPLY/DEMANDExplanation of the Code:
Demand Zone Logic: The script checks if the second candle closes below the low of the first candle and the third candle closes above both the highs of the first and second candles.
Zone Plotting: Once the pattern is identified, a demand zone is plotted from the low of the first candle to the high of the third candle, using a dashed green line for clarity.
Markers: A small triangle marker is added below the bars where a demand zone is detected for easy visualization.
Efficient Logic: The script checks the conditions for demand zone formation for every three consecutive candles on the chart.
This approach should be both accurate and efficient in plotting demand zones, making it easier to spot potential support levels on the chart.

Volumetric Rejection Blocks [UAlgo]The Volumetric Rejection Blocks is designed to help traders identify and visualize key price levels where volumetric rejections occur, which may indicate a shift in market sentiment. These rejections can signal potential trend reversals or areas where price action is likely to face support or resistance. By drawing rejection blocks based on volumetric strength, the indicator allows users to observe where significant buying or selling pressure has been exerted, which can be used as a reference point for future price action.
Also indicator dynamically calculates swing highs and lows, analyzes bullish and bearish strengths based on volume-weighted price movements, and displays rejection blocks on the chart. Each rejection block represents an area where the price attempted to move beyond a certain level but faced rejection, either on a close or wick basis. This can be particularly useful for traders who rely on market structure and order flow to make informed decisions about entering or exiting trades.
🔶 Key Features
Swing Length Customization: Allows users to define the swing length, helping tailor the sensitivity of the swing high and low detection to the specific market conditions.
Rejection Block Visualization: Displays up to the last 10 rejection blocks based on user settings, clearly marking areas of significant bullish or bearish rejections.
Volumetric Strength Analysis: The indicator calculates bullish and bearish strength for each rejection block, based on volume-weighted price movements over the last few bars, giving insight into the intensity of the rejection.
Violation Check Type: Offers two options for violation detection—"Close" and "Wick". This allows traders to specify whether a price level is considered broken only if it closes beyond the level or if any wick breaches it.
Bullish and Bearish Block Coloring: Rejection blocks are colored to represent bullish (green) and bearish (red) rejection areas. The color transparency can be adjusted for clear visibility overlaid on the price chart.
Market Structure Labels: Labels and lines marking "Market Structure Shift" (MSS) and "Break of Structure" (BOS) are displayed, giving traders context about significant market structure changes.
🔶 Interpreting the Indicator
Rejection Blocks: These colored blocks on the chart indicate areas where the price faced significant buying or selling pressure. A green block suggests a bullish rejection (support zone), where buyers absorbed the sell-off, potentially pushing the price upward. Conversely, a red block indicates a bearish rejection (resistance zone), where sellers overpowered buyers, potentially driving the price lower.
Strength Analysis: The width of the green and red sections within a rejection block represents the relative bullish and bearish strengths. A wider green section indicates stronger bullish support, while a wider red section suggests more robust bearish resistance. This helps traders gauge the likelihood of price holding or breaching these levels.
Market Structure Shift (MSS) and Break of Structure (BOS): The indicator automatically detects and labels significant changes in market structure. An "MSS" label indicates the first break, suggesting a potential shift in trend direction. A "BOS" label indicates a subsequent confirmation in trend direction, allowing traders to recognize potential trend continuations.
Violation Check: Traders can choose how to interpret breaks of these rejection blocks. Using the "Close" option provides a more conservative approach, requiring a close beyond the level for confirmation. The "Wick" option is more aggressive, treating any wick beyond the level as a break.
🔶 Disclaimer
Use with Caution: This indicator is provided for educational and informational purposes only and should not be considered as financial advice. Users should exercise caution and perform their own analysis before making trading decisions based on the indicator's signals.
Not Financial Advice: The information provided by this indicator does not constitute financial advice, and the creator (UAlgo) shall not be held responsible for any trading losses incurred as a result of using this indicator.
Backtesting Recommended: Traders are encouraged to backtest the indicator thoroughly on historical data before using it in live trading to assess its performance and suitability for their trading strategies.
Risk Management: Trading involves inherent risks, and users should implement proper risk management strategies, including but not limited to stop-loss orders and position sizing, to mitigate potential losses.
No Guarantees: The accuracy and reliability of the indicator's signals cannot be guaranteed, as they are based on historical price data and past performance may not be indicative of future results.

Cumulative Volume Delta Strategy | Flux Charts💎 GENERAL OVERVIEW
Introducing the Cumulative Volume Delta Strategy (CVDS) Indicator, an advanced tool designed to enhance trading strategies by identifying potential trend reversals through volume dynamics. This script features integrated order block detection, Fair Value Gaps (FVGs), and a dynamic take-profit (TP) and stop-loss (SL) system. For an in-depth understanding of the strategy, refer to the "HOW DOES IT WORK?" section below.
Features of the new Cumulative Volume Delta Strategy (CVDS) Indicator :
Cumulative Volume Delta-based Strategy
Order Block and Fair Value Gap (FVG) Entry Methods
Dynamic TP/SL System
Customizable Risk Management Settings
Alerts for Buy, Sell, TP, and SL Signals
📌 HOW DOES IT WORK ?
The CVDS indicator operates by tracking the net volume difference between buyers and sellers to identify divergences that could indicate potential trend reversals. A cumulative volume delta (CVD) calculation is employed to measure the intensity of these divergences in relation to price movements. The net volume sum is reset every trading day (can be changed from the settings using the anchor period option), and divergences are detected when the cumulative volume crosses the 0-line over or under.
Once a significant divergence is detected, the indicator identifies breakout points, confirmed by either Fair Value Gaps (FVGs) or Order Blocks (OBs). Depending on your chosen entry mode, the indicator will trigger a buy or sell entry when the confirmation signal aligns with the breakout direction. Alerts for Buy, Sell, Take-Profit, and Stop-Loss are available.
Note that the indicator cannot run on 1-minute and 1-second charts, as it needs to get data from a lower timeframe. 1-minutes & 1-second timeframes are the minimum timeframes in their ranges respectively.
🚩 UNIQUENESS
What sets this indicator apart is the combination of volume divergence analysis with advanced price action tools like Fair Value Gaps (FVGs) and Order Blocks (OBs). The ability to choose between these methods, along with a dynamic TP/SL system that adapts based on volatility, provides flexibility for traders in any market condition. The backtesting dashboard provides metrics about the performance of the indicator. You can use it to tune the settings for best use in the current ticker. The CVD-based strategy ensures that trades are initiated only when meaningful divergences between volume and price occur, filtering out noise and increasing the likelihood of profitable trades.
⚙️ SETTINGS
1. General Configuration
Anchor Period: Time anchor period used in CVD calculation. This is essentially the period that the volume delta sum will be reset. Lower timeframes may result in more entries at the cost of less reliable results.
Entry Mode: Choose between FVGs or OBs to trigger your entries based on the confirmation signals.
Retracement Requirement: Enable to confirm the entry after a retracement toward the FVG or OB.
2. Fair Value Gaps
FVG Sensitivity: Modify the sensitivity of FVG detection, allowing for more or fewer gaps to be considered valid.
3. Order Blocks (OB)
Swing Length: Define the swing length to identify OB formations. Shorter lengths find smaller OBs, while longer lengths detect larger structures.
4. TP / SL
TP / SL Method:
a) Dynamic: The TP / SL zones will be auto-determined by the algorithm based on the Average True Range (ATR) of the current ticker.
b) Fixed : You can adjust the exact TP / SL ratios from the settings below.
Dynamic Risk: The risk you're willing to take if "Dynamic" TP / SL Method is selected. Higher risk usually means a better winrate at the cost of losing more if the strategy fails. This setting is has a crucial effect on the performance of the indicator, as different tickers may have different volatility so the indicator may have increased performance when this setting is correctly adjusted.

Institutional Demand Supply IndicatorINTRODUCTION
Institutional demand and supply zones are key areas on a price chart where large institutional traders, such as banks and hedge funds, place significant buy or sell orders. These zones often act as strong support or resistance levels due to the substantial volume of trades executed by institutions.
There are various ways to identify these areas of interest on the charts, but the main goal is to study the price movements, especially significant ones. Large financial entities tend to operate in the same price areas repeatedly. Instead of chasing price movements and risking counter moves, it's better to wait for the price to return to these areas, expecting that these entities will buy or sell there again.
INDICATOR SETTINGS:
1. High Probability Zones (HPZ) - High Probability Zones (HPZ) are demand and supply zones identified using advanced calculations to highlight the most relevant and significant areas. These zones have a higher probability of impacting price movements. Better to keep it turned On.
2. Zone Extension? - Extending zones can be useful for identifying areas that have already been retraced as these zones may continue to influence market dynamics despite the retracement.
3. Zone Type - This option lets you select the zone layout type. 4 options are given which are self explanatory.
4. Directional Candle Count - This option keeps a count of number of consecutive bullish / bearish candle that you would like to set as qualifying parameter for demand / supply zone. For Example - If you keep the number 1, the script will draw a demand or supply zone by just checking if 1 candle has met all the criteria's and calculations.
5. Zone Validity Percentage - You can set the percent change for the number of candles mentioned in point 4 above.
6. HPZ - Keep the number between 6 to 10. As you move the number up, less number of zones will be displayed.
7. Zone Count - You can adjust the number of visible demand and supply zones on the chart. Increase this number if you want to display more zones, or decrease it if the chart becomes too cluttered.
D I S P L A Y
1. Background Color Demand / Supply Zone - This is the background color of demand and supply zone.
2. Channel Color Demand / Supply Zone - This is the color of channel.
3. Channel Line Style - Choose between Solid, dotted or dashed.
4. Background Color Transparency - Choose the transparency of background color
5. Channel Line Width - Choose Channel line width between 1 to 4.
6. Channel Line Transparency - Choose Channel Line Transparency and keep it between 1 to 100.
Sometimes, a level may be breached on one timeframe, but that doesn’t mean the indicator is not working. To understand the price action better, switch to a different timeframe to check why that level was breached and why it found support at a different zone on another timeframe. Look at the 2 screenshots below.
SMC Orderblocks (MTF)The SMC Orderblocks Indicator is designed to detect institutional orderblocks by focusing on price action and pattern detection, with a strong emphasis on identifying liquidity grabs.
This tool helps traders pinpoint areas where significant institutional trades are likely to occur by assuming the presence of orderblocks based on observed market behavior.
Unlike other indicators that may rely heavily on volume, the SMC Orderblocks Indicator offers a fresh approach rooted in a deep study of price action and Smart Money Concepts (SMC).
🔍 Unique Approach
Unlike other orderblock indicators that typically depend on volume to detect orderblocks (a common and valid method), the SMC Orderblocks Indicator explores a new approach. After extensive study and understanding of price action and SMC principles, this indicator focuses on market behavior to assume where institutional orderblocks might be. This approach offers traders a unique perspective and valuable insights, allowing them to view the market through a different lens.
🧠 The Theory Behind It
In trading, liquidity is essential for institutions and large market participants to execute their substantial orders. Orders tend to cluster around predictable levels, such as recent highs or lows, creating pools of liquidity. To secure better entry points for their large trades, institutions and market makers may manipulate prices to sweep these liquidity levels. The SMC Orderblocks Indicator is designed to detect these market manipulations—when price moves to capture liquidity—and uses these events to assume the presence of orderblocks at key levels. By recognizing these manipulations, the indicator provides insights into potential areas of significant institutional activity.
⚙️ How It Works
In order to make it work, there are two big essentail parts for this indicator. The first one is being able to identify liquidity areas. The second one is to detect the liquidity grab pattern.
1. Identifying Liquidity
So, in order to find market manipulations, mainly "liquidity grabs", the first thing we need is to find where the liquidity is.
Here "liquidity", refers to "orders", and only the exchange actually knows at what price orders are placed. The limit orders are visible in the order book and most of the time the exchange let this information be publicly accessed. But not all orders are in the orderbook. The stop-limit orders like stop-loss orders are added in the orderbook only when the market price reaches a certain price (the stop price).
At present, when using a chart script like Pinescript, there is no known way to access this real information.
But fortunately, traders and institutional behavior stay the same. Traders tend to place their orders at predictable levels, like above highs or below lows. They can also be near inducement areas, specifically created by institutions to induce traders to place their orders at certain levels.
So, the job of the indicator is first to find these levels, regardless of the method used. In the previous version of this script, I used pivots to detect highs and lows, but this method was lacking when it came to finding inducement zones or stacks of liquidity.
Instead, the indicator now uses a new method to check whether there is a stack of non-liquidated candles. This method allows the detection of inducement zones with unliquidated candles. When the stack reaches a certain number (by default, three), the liquidity is marked as valid for sweep detection.
Note: When using the indicator, you can enable the display of liquidity (to see mitigated and unmitigated liquidity) and their stack number.
2. Detecting a Liquidity sweep
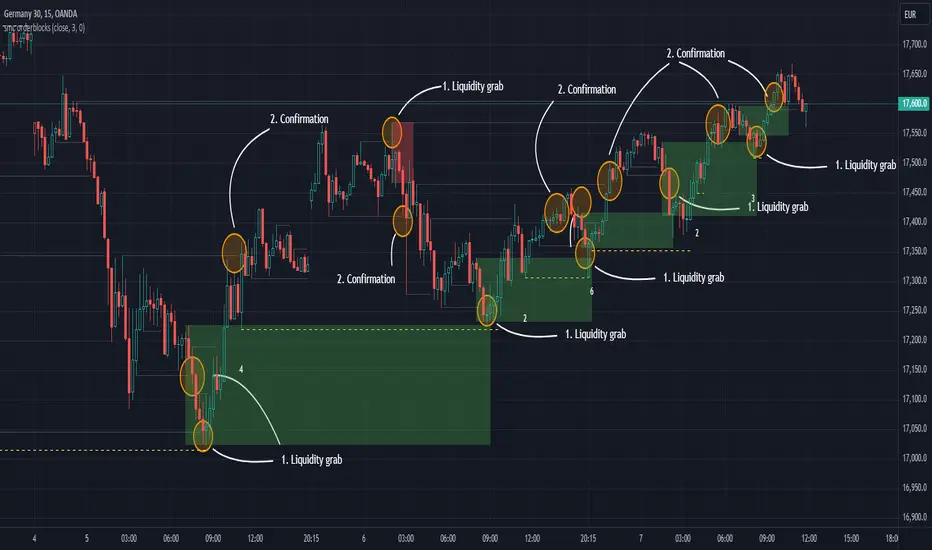
Once the first and key part is done, we need to detect the market manipulation: the liquidity grabs. Liquidity grab patterns are always the same. In the following example, let's assume the institutions want to fill sell orders in a bearish market. Here are the steps they will likely take:
- 1. The institutionals place their main orders (the orderblock) at a desired price.
- 2. They let the liquidity accumulate next to that desired price. They can even induce traders to place their own orders there. The will serve as liquidity.
- 3. Institutionals will manipulate the market price to move it towards their awaiting orders to fill them. Once that price is reach, and their orders are being filled, the market price will start moving in the opposite direction.
- 4. The grab is confirmed, when the liquidity in that oppsiite direction is grabed, or simply when the bearish market trend resumes by breaking the lows, along with additional confirmations
Sometimes, institutions will have two opposite positions in the same asset—one short and one long. This is called hedging. The goal here is to use the long orders to push the market price towards the main sell orders. Once the sell orders are filled and the market price starts falling, they may try to push it up again to close their long position with minimal loss and finally let the price fall for good.
It is at that moment that it is best to enter the market. This is why, by default, the indicator will display when the price starts moving upward towards the liquidity grab: because it's where the manipulation started and where the price is likely to reach again before resuming the main trend.
Real-Time Visualization:
As soon as an "orderblock" (or market manipulation) is detected, the indicator will display it on the chart in real time.
This immediate visualization helps traders stay ahead and catch the main market move.
💡 Usage Tips
Apply the script to your chart. This is a price-action based script so it will work on most markets. You do not need to edit settings but you can adjust them to match your trading style.
To get the most out of the SMC Orderblocks Indicator, it’s recommended to use it alongside other analysis tools, espacially market structure indicators. You can try the free-to-use SMC Market Structure (MTF) to filter the interesting orderblocks.
Additionnaly, if you search liquidity areas to set as your trade's target, you can enable their display to see mitigated and unmitigated liquidity lines. The display is disabled by default to keep charts clean.
While the indicator helps detect potential institutional orderblocks based on liquidity grabs, combining its insights with your trading knowledge and other tools will enhance decision-making.
⚠️ Disclaimer
While this method provides useful information, the orderblocks can only be assumed based on market behavior. Moreover, given how the indicator works, the accuracy cannot be guaranteed. It's important to combine the indicator's information with your own experience and other confirmation methods.
Orderblocks are also time-sensitive. The fact that an orderblock was detected and displayed on the chart does not guarantee that orders will still be present when the price returns to that level. If too much time has elapsed since the orderblock was created, or if the market structure has changed, it may be wise to disregard it. Always seek additional confirmation before opening a position.
The theory presented here on how institutional orderblocks are made, and how the market may be manipulated to fill orders, is based on my own research, knowledge, and analysis. Since I have never worked within an institution, these are educated assumptions and could be incorrect. Please always do your own research.
🚀 Active Development
The SMC Orderblocks Indicator is continuously evolving, with updates aimed at improving the rules for detecting and confirming orderblocks. Future updates may include new features and bug fixes to enhance performance and adapt to different trading styles.
📬 Note: If you encounter a bug, please contact me directly via private message, as I do not want to pollute the comment section with screenshots.
If you have any questions or suggestions for new features, feel free to reach out. You can also add a comment to boost its visibility.
Additionally, it’s recommended to compare the results of this indicator with others to find what best suits your trading style.
Please note that while this indicator is a paid script, you do not need to pay to test it. Contact me directly on TradingView via private message or through my socials, or leave a comment, and I’ll provide you with a free trial.
Volumetric Volatility Blocks [UAlgo]The Volumetric Volatility Blocks indicator is designed to identify significant volatility blocks based on price and volume data. It utilizes a combination of the Average True Range (ATR) and Simple Moving Average (SMA) to determine the volatility level and identify periods of heightened market activity. The indicator highlights these volatility blocks, providing traders with visual cues for potential trading opportunities. It differentiates between bullish and bearish volatility by analyzing price movement and volume, offering a nuanced view of market sentiment. This tool is particularly useful for traders looking to capitalize on periods of high volatility and momentum shifts.
🔶 Key Features
Volatility Measurement Length: Controls the period used to calculate the ATR.
Smooth Length of Volatility: Defines the period for the SMA used to smooth the ATR.
Multiplier of SMA: Sets the minimum threshold for the ATR to be considered a "high volatility" block.
Show Last X Volatility Blocks: Determines how many of the most recent volatility blocks are displayed on the chart.
Mitigation Method: Choose between "Close" or "Wick" price to filter volatility blocks based on price action. This helps avoid highlighting blocks broken by the chosen price level.
Volume Info: Displaying the volume associated with each block.
Up/Down Block Color: Sets the color for bullish and bearish volatility blocks.
🔶 Usage
The Volumetric Volatility Blocks indicator visually represents periods of high volatility with blocks on the chart. Green blocks indicate bullish volatility, while red blocks indicate bearish volatility.
Bullish Volatility Blocks: When the ATR surpasses the smoothed ATR multiplied by the set multiplier, and the price closes higher than it opened, a bullish block is formed. These blocks are generally used to identify potential buying opportunities as they indicate upward momentum.
Bearish Volatility Blocks: Conversely, bearish blocks form under the same conditions, but when the price closes lower than it opened. These blocks can signal potential selling opportunities as they highlight downward momentum.
Volume Information: Each block can display volume data, providing insight into the strength of the market movement. The percentage shown on the block indicates the relative volume contribution of that block, helping traders assess the significance of the volatility.
The volume percentages in the Volumetric Volatility Blocks indicator are calculated based on the total volume of the most recent volatility blocks. For each of the most recent volatility blocks, the percentage of the total volume is calculated by dividing the block's volume by the total volume:
🔶 Disclaimer
Use with Caution: This indicator is provided for educational and informational purposes only and should not be considered as financial advice. Users should exercise caution and perform their own analysis before making trading decisions based on the indicator's signals.
Not Financial Advice: The information provided by this indicator does not constitute financial advice, and the creator (UAlgo) shall not be held responsible for any trading losses incurred as a result of using this indicator.
Backtesting Recommended: Traders are encouraged to backtest the indicator thoroughly on historical data before using it in live trading to assess its performance and suitability for their trading strategies.
Risk Management: Trading involves inherent risks, and users should implement proper risk management strategies, including but not limited to stop-loss orders and position sizing, to mitigate potential losses.
No Guarantees: The accuracy and reliability of the indicator's signals cannot be guaranteed, as they are based on historical price data and past performance may not be indicative of future results.

RunRox - Backtesting System (ASMC)Introducing RunRox - Backtesting System (ASMC), a specially designed backtesting system built on the robust structure of our Advanced SMC indicator. This innovative tool evaluates various Smart Money Concept (SMC) trading setups and serves as an automatic optimizer, displaying which entry and exit points have historically shown the best results. With cutting-edge technology, RunRox - Backtesting System (ASMC) provides you with effective strategies, maximizing your trading potential and taking your trading to the next level
🟠 HOW OUR BACKTESTING SYSTEM WORKS
Our backtesting system for the Advanced SMC (ASMC) indicator is meticulously designed to provide traders with a thorough analysis of their Smart Money Concept (SMC) strategies. Here’s an overview of how it works:
🔸 Advanced SMC Structure
Our ASMC indicator is built upon an enhanced SMC structure that integrates the Institutional Distribution Model (IDM), precise retracements, and five types of order blocks (CHoCH OB, IDM OB, Local OB, BOS OB, Extreme OB). These components allow for a detailed understanding of market dynamics and the identification of key trading opportunities.
🔸 Data Integration and Analysis
1. Historical Data Testing:
Our system tests various entry and exit points using historical market data.
The ASMC indicator is used to simulate trades based on predefined SMC setups, evaluating their effectiveness over a specified time period.
Traders can select different parameters such as entry points, stop-loss, and take-profit levels to see how these setups would have performed historically.
2. Entry and Exit Events:
The backtester can simulate trades based on 12 different entry events, 14 target events, and 14 stop-loss events, providing a comprehensive testing framework.
It allows for testing with multiple combinations of entry and exit strategies, ensuring a robust evaluation of trading setups.
3. Order Block Sensitivity:
The system uses the sensitivity settings from the ASMC indicator to determine the most relevant order blocks and fair value gaps (FVGs) for entry and exit points.
It distinguishes between different types of order blocks, helping traders identify strong institutional zones versus local zones.
🔸 Optimization Capabilities
1. Auto-Optimizer:
The backtester includes an auto-optimizer feature that evaluates various setups to find those with the best historical performance.
It automatically adjusts parameters to identify the most effective strategies for both trend-following and counter-trend trading.
2. Stop Loss and Take Profit Optimization:
It optimizes stop-loss and take-profit levels by testing different settings and identifying those that provided the best historical results.
This helps traders refine their risk management and maximize potential returns.
3. Trailing Stop Optimization:
The system also optimizes trailing stops, ensuring that traders can maximize their profits by adjusting their stops dynamically as the market moves.
🔸 Comprehensive Reporting
1. Performance Metrics:
The backtesting system provides detailed reports, including key performance metrics such as Net Profit, Win Rate, Profit Factor, and Max Drawdown.
These metrics help traders understand the historical performance of their strategies and make data-driven decisions.
2. Flexible Settings:
Traders can adjust initial balance, commission rates, and risk per trade settings to simulate real-world trading conditions.
The system supports testing with different leverage settings, allowing for realistic assessments even with tight stop-loss levels.
🔸 Conclusion
The RunRox Backtesting System (ASMC) is a powerful tool for traders seeking to validate and optimize their SMC strategies. By leveraging historical data and sophisticated optimization algorithms, it provides insights into the most effective setups, enhancing trading performance and decision-making.
🟠 HERE ARE THE AVAILABLE FEATURES
Historical backtesting for any setup – Select any entry point, exit point, and various stop-loss options to see the results of your setup on historical data.
Auto-optimizer for finding the best setups – The indicator displays settings that have shown the best results historically, providing valuable insights.
Auto-optimizer for counter-trend setups – Discover entry and exit points for counter-trend trading based on historical performance.
Auto-optimizer for stop-loss – The indicator shows stop-loss points that have been most effective historically.
Auto-optimizer for take-profit – The indicator identifies take-profit points that have performed well in historical trading data.
Auto-optimizer for trailing stop – The indicator presents trailing stop settings that have shown the best historical results.
And much more within our indicator, all of which we will cover in this post. Next, we will showcase the possible entry points, targets, and stop-loss options available for testing your strategies
🟠 ENTRY SETTINGS
12 Event Triggers for Trade Entry
Extr. ChoCh OB
Extr. ChoCh FVG
ChoCh
ChoCh OB
ChoCh FVG
IDM OB
IDM FVG
BoS FVG
BoS OB
BoS
Extr. BoS FVG
Extr. BoS OB
3 Trade Direction Options
Long Only: Enter long positions only
Short Only: Enter short positions only
Long and Short: Enter both long and short positions based on trend
3 Levels for Order Block/FVG Entries
Beginning: Enter the trade at the first touch of the Order Block/FVG
Middle: Enter the trade when the middle of the Order Block/FVG is reached
End: Enter the trade upon full filling of the Order Block/FVG
*Three levels work only for Order Blocks and FVG. For trade entries based on BOS or CHoCH, these settings do not apply as these parameters are not available for these types of entries
You can choose any combination of trade entries imaginable.
🟠 TARGET SETTINGS
14 Target Events, Including Fixed % and Fixed RR (Risk/Reward):
Fixed - % change in price
Fixed RR - Risk Reward per trade
Extr. ChoCh OB
Extr. ChoCh FVG
ChoCh
ChoCh OB
ChoCh FVG
IDM OB
IDM FVG
BoS FVG
BoS OB
BoS
Extr. BoS FVG
Extr. BoS OB
3 Levels of Order Block/FVG for Target
Beginning: Close the trade at the first touch of your target.
Middle: Close the trade at the midpoint of your chosen target.
End: Close the trade when your target is fully filled.
Customizable Parameters
Easily set your Fixed % and Fixed RR targets with a user-friendly input field. This field works only for the Fixed and Fixed RR entry parameters. When selecting a different entry point, this field is ignored
Choose any combination of target events to suit your trading strategy.
🟠 STOPLOSS SETTINGS
14 Possible StopLoss Events Including Entry Orderblock/FVG
Fixed - Fix the loss on the trade when the price moves by N%
Entry Block
Extr. ChoCh OB
Extr. ChoCh FVG
ChoCh
ChoCh OB
ChoCh FVG
IDM OB
IDM FVG
BoS FVG
BoS OB
BoS
Extr. BoS FVG
Extr. BoS OB
3 Levels for Order Blocks/FVG Exits
Beginning: Exit the trade at the first touch of the order block/FVG.
Middle: Exit the trade at the middle of the order block/FVG.
End: Exit the trade at the full completion of the order block/FVG.
Dedicated Field for Setting Fixed % Value
Set a fixed % value in a dedicated field for the Fixed parameter. This field works only for the Fixed parameter. When selecting other exit parameters, this field is ignored.
🟠 ADDITIONAL SETTINGS
Trailing Stop, %
Set a Trailing Stop as a percentage of your trade to potentially increase profit based on historical data.
Move SL to Breakeven, bars
Move your StopLoss to breakeven after exiting the entry zone for a specified number of bars. This can enhance your potential WinRate based on historical performance.
Skip trade if RR less than
This feature allows you to skip trades where the potential Risk-to-Reward ratio is less than the number set in this field.
🟠 EXAMPLE OF MANUAL SETUP
For example, let me show you how it works on the chart. You select entry parameters, stop loss parameters, and take profit parameters for your trades, and the strategy automatically tests this setup on historical data, allowing you to see the results of this strategy.
In the screenshot above, the parameters were as follows:
Trade Entry: CHoCH OB (Beginning)
Stop Loss: Entry Block
Take Profit: Break of BOS
The indicator will automatically test all possible trades on the chart and display the results for this setup.
🟠 AUTO OPTIMIZATION SETTINGS
In the screenshot above, you can see the optimization table displaying various entry points, exits, and stop-loss settings, along with their historical performance results and other parameters. This feature allows you to identify trading setups that have shown the best historical outcomes.
This functionality will enhance your trading approach, providing you with valuable insights based on historical data. You’ll be aware of the Smart Money Concept settings that have historically worked best for any specific chart and timeframe.
Our indicator includes various optimization options designed to help you find the most effective settings based on historical data. There are 5 optimization modes, each offering unique benefits for every trader
Trend Entry - Optimization of the best settings for trend-following trades. The strategy will enter trades only in the direction of the trend. If the trend is upward, it will look for long entry points and vice versa.
Counter Trend Entry - Finding setups against the trend. If the trend is upward, the script will search for short entry points. This is the opposite of trend entry optimization.
Stop Loss - Identifying stop-loss points that showed the best historical performance for the specific setup you have configured. This helps in finding effective exit points to minimize losses.
Take Profit - Determining targets for the configured setup based on historical performance, helping to identify potentially profitable take profit levels.
Trailing Stop - Finding optimal percentages for the trailing stop function based on historical data, which can potentially increase the profit of your trades.
Ability to set parameters for auto-optimization within a specified range. For example, if you choose FixRR TP from 1 to 10, the indicator will automatically test all possible Risk Reward Take Profit variations from 1 to 10 and display the results for each parameter individually.
Ability to set initial deposit parameters, position commissions, and risk per trade as a fixed percentage or fixed amount. Additionally, you can set the maximum leverage for a trade.
There are times when the stop loss is very close to the entry point, and adhering to the risk per trade values set in the settings may not allow for such a loss in any situation. That’s why we added the ability to set the maximum possible leverage, allowing you to test your trading strategy even with very tight stop losses.
Duplicated Smart Money Structure settings from our Advanced SMC indicator that you can adjust to match your trading style flexibly. All these settings will be taken into account during the optimization process or when manually calculating settings.
Additionally, you can test your strategy based on higher timeframe order blocks. For example, you can test a strategy on a 1-minute chart while displaying order blocks from a 15-minute timeframe. The auto-optimizer will consider all these parameters, including higher timeframe order blocks, and will enter trades based on these order blocks.
Highly flexible dashboard and results optimization settings allow you to display the tables you need and sort results by six different criteria: Profit Factor, Profit, Winrate, Max Drawdown, Wins, and Trades. This enables you to find the exact setup you desire, based on these comprehensive data points.
🟠 ALERT CUSTOMIZATION
With this indicator, you can set up buy and sell alerts based on the test results, allowing you to create a comprehensive trading strategy. This feature enables you to receive real-time signals, making it a powerful tool for implementing your trading strategies.
🟠 STRATEGY PROPERTIES
For backtesting, we used realistic initial data for entering trades, such as:
Starting balance: $1000
Commission: 0.01%
Risk per trade: 1%
To ensure realistic data, we used the above settings. We offer two methods for calculating your order size, and in our case, we used a 1% risk per trade. Here’s what it means:
Risk per trade: This is the maximum loss from your deposit if the trade goes against you. The trade volume can change depending on your stop-loss distance from the entry point. Here’s the formula we use to calculate the possible volume for a single trade:
1. quantity = percentage_risk * balance / loss_per_1_contract (incl. fee)
Then, we calculate the maximum allowed volume based on the specified maximum leverage:
2. max_quantity = maxLeverage * balance / entry_price
3. If quantity < max_quantity, meaning the leverage is less than the maximum allowed, we keep quantity. If quantity > max_quantity, we use max_quantity (the maximum allowed volume according to the set leverage).
This way, depending on the stop-loss distance, the position size can vary and be up to 100% of your deposit, but the loss in each trade will not exceed the set percentage, which in our case is 1% for this backtest. This is a standard risk calculation method based on your stop-loss distance.
🔸 Statistical Significance of Trade Data
In our strategy, you may notice there weren’t enough trades to form statistically significant data. This is inherent to the Smart Money Concept (SMC) strategy, where the focus is not on the number of trades but rather on the risk-to-reward ratio per trade. In SMC strategies, it’s crucial to avoid taking numerous uncertain setups and instead perform a comprehensive analysis of the market situation.
Therefore, our strategy results show fewer than 100 trades. It’s important to understand that this small sample size isn’t statistically significant and shouldn’t be relied upon for strategy analysis. Backtesting with a small number of trades should not be used to draw conclusions about the effectiveness of a strategy.
🔸 Versatile Use Cases
The methods of using this indicator are numerous, ranging from identifying potentially the best-performing order blocks on the chart to creating a comprehensive trading strategy based on the data provided by our indicator. We believe that every trader will find a valuable application for this tool, enhancing their entry and exit points in trades.
Disclaimer
Past performance is not indicative of future results. The results shown by this indicator do not guarantee similar outcomes in the future. Use this tool as part of a comprehensive trading strategy, considering all market conditions and risks.
How to access
For access to this indicator, please read the author’s instructions below this post

SMC Community [algoat] — Smart Money ConceptsEmpower your trading with the core principles of the Smart Money Concepts through interactive features and highly customizable settings.
The indicator's strength lies in the unique SMC Core algorithm, a calculation based on real price action data, capturing every tick from small intraday fluctuations to significant high timeframe movements.
algoat SMC Core is our continually evolving, specialized structure mapping algorithm, serving as the backbone of our price action related publications.
⭐ Key Features
Swing Market Structure: Change of Character, Break of Structure
Recognize and visualize real-time market structures with swing elements. Identify and mark key structural changes in the market to visually highlight shifts in market trends and patterns. This feature is designed to alert you to significant changes in the market's behavior, signaling a potential shift from accumulation to distribution phases, or vice versa. It helps traders adapt their strategies based on evolving market dynamics.
Order Flow: Structure Fractal
Connect the successive structural high and low levels, visualizing the intricate flow of market movements. This feature highlights fractal structures within the market, enabling traders to detect significant price action patterns.
Structure Range: Determine Discount, Premium, and Equilibrium Zones
This feature provides a unique way of visualizing price areas where a security could be overbought or oversold (premium or discount zones) and where the price is expected to be fair and balanced (equilibrium zone). Distance from the current price is displayed in percentage terms, which can assist traders with crucial data for risk management and strategic planning. The Range function helps you identify the most favorable price zones for entries and set your stop-loss and take-profit levels more accurately.
Liquidity Grabs: Reveal Hidden Manipulation Attempts
Identify uncovered market areas where high liquidity trading may take place. Liquidity Grabs help track "smart money" footprints by identifying levels where large institutional traders may have induced liquidity traps. Understanding these traps can aid in avoiding false market moves and optimizing trade entries.
Institutional Interest Zones: Order Blocks and Fair Value Gaps
Uncover areas where bigger orders may be lined up. Reveal zones of interest ordered by volume strength. Receive warnings about market price imbalances.
▸ Order Blocks pinpoint crucial zones where large institutional investors ("smart money") have shown strong buying or selling interest recently. These blocks can serve as a tool for identifying key areas for potential trade entries or exits.
▸ Fair Value Gaps detect discrepancies between the perceived market value and the actual market price, revealing potential areas for price correction. With its mitigation settings, you can fine-tune the FVG detection according to the magnitude of value misalignment you consider significant.
Mitigation types dictate how price interacts with a zone, with order blocks requiring a close through (indicating stronger price movement) and fair value gaps requiring a wick through (hinting at weak rejection).
══════════════════
⭐ Why SMC?
In the ever-evolving trading landscape, mainstream methods and strategies can quickly become outdated as they are widely adopted. Liquidity is constantly sought after, and the best source for this is exploring and exploiting trading strategies that are widely accepted and applied. Currently, one of these strategies is the SMC (Supply, Demand, and Price Action).
It's no coincidence that our educational materials incorporate concepts such as liquidity grabs (LG) and Smart Money Traps (SMT). As the application of SMC gains popularity among retail traders, trading with this approach becomes more challenging. Therefore, the recent focus has been on reforming the SMC methodology, as it is the only method that relies on real price movements and will always work when applied correctly.
The indicator reflects our personal use and deep comprehension of Smart Money Concepts. It provides streamlined tools for tracking algorithmic trends with modern visualizations, without unnecessary clutter.
▸ What does the proper application of SMC entail?
Many SMC traders associate their key areas of interest with the market structure, which is generally considered acceptable. However, depending solely on a single foundation can lead to significant deviations, which may cause notable impacts on trading results. Moreover, if the basis for the market structure calculation is inaccurate, the consequences can be even more severe. It's akin to risking money on a lottery ticket, believing it will be a winner.
Our methodology is different, and it may ensure longevity in the financial markets. The structure remains crucial, but it is not the sole foundation of everything; instead, it serves as a validation tool. Each calculation, such as order blocks (OB), Fair Value Gaps (FVG), liquidity grabs (LG), range analysis, and more, is independent and unique, separate from the structure. However, validation must ultimately come from the structure itself.
We employ individual and high-quality filters: before a function calculation is validated by the structure, it must undergo rigorous testing based on its own set of validation conditions. This approach aims to enhance robustness and accuracy, providing traders with a reliable framework for making informed trading decisions.
▸ An example of structure validation: Order Block with "Swing Sensitivity"
These order blocks will only be displayed and utilized by the script if there is a swing structure validation with a valid break. In other words, the presence of a confirmed swing Change of Character (ChoCh) or Break of Structure (BoS) is essential for the Order Block to be considered valid and relevant.
This approach ensures that the order blocks are aligned with the overall market structure and are not based on isolated or unreliable price movements. Whether it's Fair Value Gaps (FVG), Liquidity Grabs (LG), Range calculations, or other functionalities, the same underlying principle holds true. The background structure calculation serves as a validation mechanism for the data and insights generated by these functions, ensuring they adhere to the specific criteria and rules established within our methodology. By incorporating this robust validation process, traders can have confidence in the reliability and accuracy of the information provided by the indicator, allowing them to make informed trading decisions based on validated data and analysis.
══════════════════
👉 Usage - the general approach
Determine your trading style and build your basic strategy:
The indicator helps you understand your trading style, whether it's swing trading, scalping or another approach. By analyzing the SMC indicator, you gain valuable information about potential market trends, entry and exit points, and overall market sentiment.
Steps:
Identify Trading Style: Determine whether you are a swing trader, scalper, or long-term investor. This will influence how you use the indicator.
Analyze Market Trends: Use the SMC indicator to observe market trends and identify potential entry and exit points.
Adapt Strategies: Adjust your strategies based on the market dynamics revealed by the SMC indicator, such as changes in order flow or market structure.
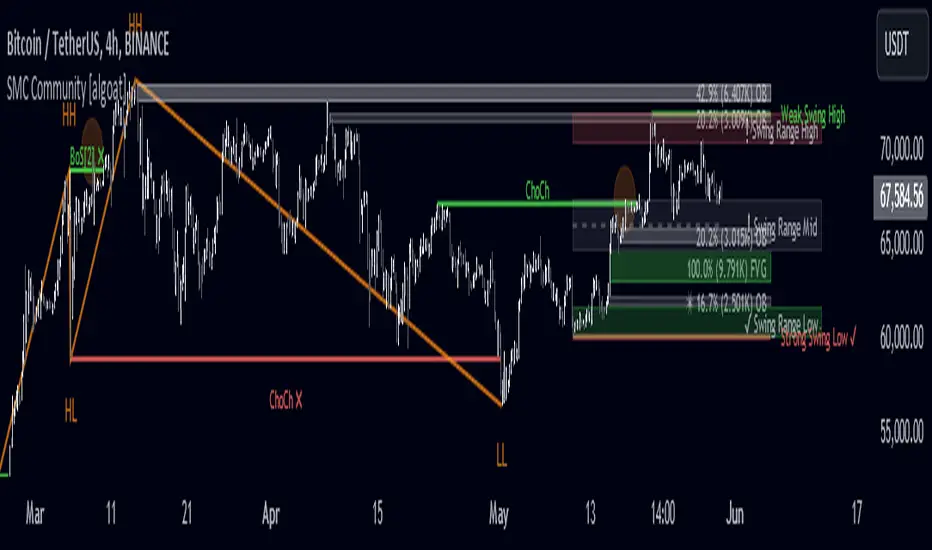
👉 Example of usage
In the following chart, you'll notice how we've utilized the indicator to formulate a strategic trading approach. We've employed Order Blocks equipped with volume parameters to identify crucial market zones. Simultaneously, we've leveraged swing/internal market structures to gain insights into potential long- and short-term market turnarounds. Lastly, we've examined trend line liquidity zones to pinpoint probable impulses and breakouts within ongoing trends.
Now we can see how the price descended to the order block with the highest volume, which we had previously marked as our point of interest for an entry. As the price closed below the median Order Block, we noted its mitigation. After an internal CHoCH, it's directing us towards the main Order Block as a target.
══════════════════
🧠 General advice
Trading effectively requires a range of techniques, experience, and expertise. From technical analysis to market fundamentals, traders must navigate multiple factors, including market sentiment and economic conditions. However, traders often find themselves overwhelmed by market noise, making it challenging to filter out distractions and make informed decisions. By integrating multiple analytical approaches, traders can tailor their strategies to fit their unique trading styles and objectives.
Confirming signals with other indicators
As with all technical indicators, it is important to confirm potential signals with other analytical tools, such as support and resistance levels, as well as indicators like RSI, MACD, and volume. This helps increase the probability of a successful trade.
Use proper risk management
When using this or any other indicator, it is crucial to have proper risk management in place. Consider implementing stop-loss levels and thoughtful position sizing.
Combining with other technical indicators
Integrate this indicator with other technical indicators to develop a comprehensive trading strategy and provide additional confirmation.
Conduct Thorough Research and Backtesting
Ensure a solid understanding of the indicator and its behavior through thorough research and backtesting before making trading decisions. Consider incorporating fundamental analysis and market sentiment into your trading approach.
══════════════════
⭐ Conclusion
We hold the view that the true path to success is the synergy between the trader and the tool, contrary to the common belief that the tool itself is the sole determinant of profitability. The actual scenario is more nuanced than such an oversimplification. A word to the wise is enough: developed by traders, for traders — pioneering innovations for the modern era.
Risk Notice
Everything provided by algoat — from scripts, tools, and articles to educational materials — is intended solely for educational and informational purposes. Past performance does not assure future returns.
Volume Breaker Blocks [UAlgo]The "Volume Breaker Blocks " indicator is designed to identify breaker blocks in the market based on volume and price action. It is a concept that emerges when an order block fails, leading to a change in market structure. It signifies a pivotal point where the market shifts direction, offering traders opportunities to enter trades based on anticipated trend continuation.
🔶 Key Features
Identifying Breaker Blocks: The indicator identifies breaker blocks by detecting pivot points in price action and corresponding volume spikes.
Breaker Block Sensitivity: Traders can adjust breaker block detection sensitivity, length to be used to find pivot points.
Mitigation Method (Close or Wick): Traders can choose between "Close" and "Wick" as the mitigation method. This choice determines whether the indicator considers closing prices or wicks in identifying breaker blocks. Selecting "Close" implies that breaker blocks will be considered broken when the closing price violates the block, while selecting "Wick" implies that the wick of the candle must violate the block for it to be considered broken.
Show Last X Breaker Blocks: Users can specify how many of the most recent breaker blocks to display on the chart.
Visualization: Volume breaker blocks are visually represented on the chart with customizable colors and text labels, allowing for easy interpretation of market conditions. Each breaker block is accompanied by informational text, including whether it's bullish or bearish and the corresponding volume, aiding traders in understanding the significance of each block.
🔶 Disclaimer
Educational Purpose: The "Volume Breaker Blocks " indicator is provided for educational and informational purposes only. It does not constitute financial advice or a recommendation to engage in trading activities.
Risk of Loss: Trading in financial markets involves inherent risks, including the risk of loss of capital. Users should carefully consider their financial situation, risk tolerance, and investment objectives before engaging in trading activities.
Accuracy Not Guaranteed: While the indicator aims to identify potential reversal points in the market, its accuracy and effectiveness may vary. Users should conduct thorough testing and analysis before relying solely on the indicator for trading decisions.
Past Performance: Past performance is not indicative of future results. Historical data and backtesting results may not accurately reflect actual market conditions or future performance.

Order Block Drawing [TradingFinder]🔵 Introduction
Perhaps one of the most challenging tasks for Pine script developers (especially beginners) is properly drawing order blocks. While utilizing the latest technical analysis methods for "Price Action," beginners heavily rely on accurately plotting "Supply" and "Demand" zones, following concepts like "Smart Money Concept" and "ICT".
However, drawing "Order Blocks" may pose a challenge for developers. Therefore, to minimize bugs, increase accuracy, and speed up the process of coding order blocks, we have released the "Order Block Drawing" library.
Below, you can read more details about how to use this library.
Important :
This library has direct and indirect outputs. The indirect output includes the ranges of order blocks plotted on the chart. However, the direct output is a "Boolean" value that becomes "true" only when the price touches an order block, colloquially termed as "Mitigate." You can use this output for setting up alerts.
🔵 How to Use
First, you can add the library to your code as shown in the example below.
import TFlab/OrderBlockDrawing_TradingFinder/1
🟣Parameters
OBDrawing(OBType, TriggerCondition, DistalPrice, ProximalPrice, Index, OBValidDis, Show, ColorZone) =>
Parameters:
• OBType (string)
• TriggerCondition (bool)
• DistalPrice (float)
• ProximalPrice (float)
• Index (int)
• OBValidDis (int)
• Show (bool)
• ColorZone (color)
OBType : All order blocks are summarized into two types: "Supply" and "Demand." You should input your order block type in this parameter. Enter "Demand" for drawing demand zones and "Supply" for drawing supply zones.
TriggerCondition : Input the condition under which you want the order block to be drawn in this parameter.
DistalPrice : Generally, if each zone is formed by two lines, the farthest line from the price is termed "Distal." This input receives the price of the "Distal" line.
ProximalPrice : Generally, if each zone is formed by two lines, the nearest line to the price is termed "Proximal" line.
Index : This input receives the value of the "bar_index" at the beginning of the order block. You should store the "bar_index" value at the occurrence of the condition for the order block to be drawn and input it here.
OBValidDis : Order blocks continue to be drawn until a new order block is drawn or the order block is "Mitigate." You can specify how many candles after their initiation order blocks should continue. If you want no limitation, enter the number 4998.
Show : You may need to manage whether to display or hide order blocks. When this input is "On", order blocks are displayed, and when it's "Off", order blocks are not displayed.
ColorZone : You can input your preferred color for drawing order blocks.
🔵 Function Outputs
This function has only one output. This output is of type "Boolean" and becomes "true" only when the price touches an order block. Each order block can be touched only once and then loses its validity. You can use this output for alerts.
= Drawing.OBDrawing('Demand', Condition, Distal, Proximal, Index, 4998, true, Color)

Smart Money Setup 06 [TradingFinder] Liquidity Sweeps + OB Swing🔵 Introduction
Smart Money, managed by large investors, injects significant capital into financial markets by entering real capital markets.
Capital entering the market by this group of individuals is called smart money. Traders can profit from financial markets by following such individuals.
Therefore, smart money can be considered one of the effective methods for analyzing financial markets.
Sometimes, before a market movement, fluctuation movements that create price movement cause many traders' "Stop Loss" to be triggered. These movements are created in various patterns.
One of these patterns is similar to an "Expanding Triangle", which touches the stop loss of individuals who have placed their stop loss in the cash area in the form of 5 consecutive openings.
To better understand this setup, pay attention to the images below.
Bullish Setup Details :
Bearish Setup Details :
🔵 How to Use
After adding the indicator to the chart, wait for trading opportunities to appear. By changing the "Time Frame" and "Pivot Period", you can see different trading positions.
In general, the smaller the "Time Frame" and "Pivot Period", the more likely trading opportunities will appear.
Bullish Setup Details on Chart :
Bearish Setup Details on Chart :
🔵 Settings
You have access to "Pivot Period", "Order Block Refine", and "Refine Mode" through settings.
By changing the "Pivot Period", you can change the range of zigzag that identifies the setup.
Through "Order Block Refine", you can specify whether you want to refine the width of the order blocks or not. It is set to "On" by default.
Through "Refine Mode", you can specify how to improve order blocks.
If you are "risk-averse", you should set it to "Defensive" mode because in this mode, the width of the order blocks decreases, the number of your trades decreases, and the "reward-to-risk ratio "increases.
If you are on the opposite side and are "risk-taker", you can set it to "Aggressive" mode. In this mode, the width of the order blocks increases, and the likelihood of losing positions decreases.

MTF OB Supply Demand ZonesHello everyone,
This exceptional indicator provides you with visual representations of bullish and bearish order blocks or supply and demand zones across multiple timeframes. In simple terms, bullish order blocks are represented by a small red candle followed by a large red candle, while bearish order blocks are depicted as a small green candle followed by a large red candle. Supply and demand zones are drawn by using order blocks.
Features:
Display order blocks from up to three different timeframes.
Customize the maximum number of boxes shown and the colors of the zones.
Choose from three different modes: OB (Order Block), Extended OB, and Supply/Demand.
Mode Descriptions:
OB: Includes the body of the candle.
Extended OB: Encompasses the body and wick of the candle.
Supply/Demand: Covers the body, wick, and half the body of the large candle.
Usage:
Ensure that charts 2 and 3 are set to a higher timeframe. For modes 2 and 3, it’s recommended to reduce the maximum number of boxes shown. The zones or boxes are transparent, allowing for overlap. This feature aids in identifying reversal zones or confirmed zones. The more intense the color, the stronger the confirmation. If a green zone overlaps a red zone (or vice versa), it signifies a reversal zone.
Thank you for checking out this indicator!
---
Additional Information:
Order blocks refer to specific price areas where large market participants, such as institutional traders, have previously placed significant buy or sell orders. These clusters of orders can impact price movement, liquidity, and market sentiment.
Order blocks are a strategic approach to identifying key levels of support and resistance based on the behavior of institutional traders. These key levels are then utilized as entry or exit points for trades.
An order block is an area where there has been a large concentration of limit orders awaiting execution. These blocks are identified on a chart by observing previous price action and pinpointing areas where the price experienced significant movement or abrupt changes in direction.
Order blocks are used in the following popular trading philosophies:
Smart Money Concepts (SMC)
Inner Circle Trading (ICT)
Price Action
---
Credits to: @AGFXTRADING

Smart Money Setup 03 [TradingFinder] Minor OB & Trend Proof🔵 Introduction
The "Smart Money Concept" transcends mere technical trading strategies; it embodies a comprehensive philosophy elucidating market dynamics. Central to this concept is the acknowledgment that influential market participants manipulate price actions, presenting challenges for retail traders.
As a "retail trader", aligning your strategy with the behavior of "Smart Money," primarily market makers, is paramount. Understanding their trading patterns, which revolve around supply, demand, and market structure, forms the cornerstone of your approach. Consequently, decisions to enter trades should be informed by these considerations.
🟣 Important Note
In this setup, pattern formation revolves around the robustness of the "Stop Hunt" targeting retail traders.
When this stop hunt occurs, if the price tests below the minor pivot or above the minor pivot, a "Minor Order Block" is formed.
Similarly, if the price tests below the major pivot or above the major pivot, a "Major Order Block" is formed.
Since the price hasn't successfully broken the major pivots before breaking the Top or Bottom, it can be inferred that the minor pivots formed within a leg of price movement exhibit a "Range" structure.
For a deeper comprehension of this setup, refer to the accompanying visual aids below.
Bullish Setup Details :
Bearish Setup Details :
🔵 How to Use
Upon integrating the indicator into your chart, exercise patience as you await the evolution of the trading setup.
Experiment with different trading positions by adjusting both the "Time Frame" and "Pivot Period". Typically, setups materializing over longer "Time Frames" and "Pivot Periods" carry heightened validity.
Bullish Setup Details on Chart :
Bearish Setup Details on Chart :
Within the settings, you possess the flexibility to modify the "Pivot Period" input to tailor the indicator to your preferences.

Order Blocks Indicator [TradingFinder] Lightning|CHOCH |OB | BOS🔵 Introduction
In "Price Action," an "Order Block" is essentially an area on the price chart where significant players such as institutional traders have executed their moves by placing noteworthy orders. These points often indicate areas where price either attempts to break through (resistance) or returns when it reaches there (support).
Therefore, when discussing the identification of order blocks, we typically refer to finding points where the price has stalled for a while and has accumulated strength before making a significant move in one direction.
Essentially, order blocks assist traders in understanding where large players with "smart money" have likely placed their bulk orders in the market. Traders use these order blocks as part of their overall analysis to identify probable levels where price may change direction.
This version of the order block indicator is designed for traders, adding many indicators to their charts. The minimal design helps minimize disruptions to user focus.
🔵 Identification of Order Blocks
To identify order blocks, first, a "Level Break" must occur. To identify a "Demand Zone," a "High Level Break" is required, and to identify a "Supply Zone," a "Low Level Break" is needed.
Demand Zone :
Supply Zone :
🔵 "Change of Character" or "Market Shift Structure"
"ChoCh" or "MSS" is the "Break Level" that is contrary to the previous trend. For example, if a "Bearish Level" is established in the market and consecutive "Low Levels" are being broken, the price turns upward, breaking a "High Level." This break is called "ChoCh" or "MSS."
🔵 "Break of Structure"
"Break of Structure," or "BoS" for short, is the "Break Level" in the direction of the current trend. For example, if a "Bullish Level" is established in the market, when the price breaks a "High Level," a "BoS" has occurred.
🔵 Features
🟣 Major Level
This feature helps you easily identify major levels. These levels form when the price breaks another major level.
🟣 Refine Order Block
The "Refinement" feature allows you to adjust the width of the order block based on your strategy. There are two modes, "Aggressive" and "Defensive," in Order Block Refine. The difference between "Aggressive" and "Defensive" lies in the width of the order block. For "Risk Averse" traders, the "Defensive" mode is suitable because it provides smaller stop losses and larger reward-to-risk ratios. For "Risk Taker" traders, the "Aggressive" mode is more suitable. These traders prefer to enter trades at higher prices and this mode, where the width of the order block is greater, is more suitable for this group of individuals.
🔵 How to Use
After adding the indicator to your chart, you will see a visual similar to the image below. Green order blocks are "Demand Zones" and red order blocks are "Supply Zones." The midpoint of the order blocks also indicates 50% of it.
Refine Order Block is defaulted to On and refines the order blocks. If you want the order blocks to remain original, you should set it to Off.
Refine is defaulted to "Defensive" mode. If you want it to be in "Aggressive" mode, you should change its mode through Refine Type.
Displaying "Major Levels" is turned off by default and to display them, you should set "Show High Level" and "Show Low Level" to "Yes." You can use these lines to identify liquidity or determine stop loss and take profit levels.

Breaker Blocks Screener | Flux Charts💎 GENERAL OVERVIEW
Introducing our new Breaker Blocks Screener! This screener can provide information about the latest breaker blocks in up to 5 tickers. You can also customize the algorithm that finds the breaker blocks and the styling of the screener.
Features of the new Breaker Blocks Screener :
Find Latest Breaker Blocks Accross 5 Tickers
Latest Status, Restests & Volume
Customizable Algoritm / Styling
📌 HOW DOES IT WORK ?
Breaker blocks form when an order block fails, or "breaks". It is often associated with market going in the opposite direction of the broken order block, and they can be spotted by following order blocks and finding the point they get broken, ie. price goes below a bullish order block.
The volume of a breaker block is simply the total volume of the bar that the original order block is broken. Often the higher the breaking bar's volume, the stronger the breaker block is.
This screener then finds breaker blocks accross 5 different tickers, and shows the latest information about them.
Status ->
Far -> The current price is far away from the breaker block.
Approaching ⬆️/⬇️ -> The current price is approaching the breaker block, and the direction it's approaching from.
Inside -> The price is currently inside the breaker block.
Retests -> Retest means the price to invalidate the breaker block, but failed to do so. Here you can see how many times the price retested the breaker block.
For the volume, check the top of the "How Does It Work" section.
🚩UNIQUENESS
This screener can detect latest breaker blocks and give information about them for up to 5 tickers. This saves the user time by showing them all in a dashboard at the same time. The screener shows the number of the retests of the breaker block as an unique trait. Another unique ability of the screener is that it shows the latest valid breaker block's volume in the dashboard.
⚙️SETTINGS
1. Tickers
You can set up to 5 tickers for the screener to scan breaker blocks here. You can also enable / disable them and set their individual timeframes.
2. General Configuration
Zone Invalidations -> Select between Wick & Close price for Order & Breaker Block Invalidation.
Swing Length -> Swing length is used when finding order block formations. Smaller values will result in finding smaller order blocks.

Order Blocks Screener | Flux Charts💎 GENERAL OVERVIEW
Introducing our new Order Blocks Screener! This screener can provide information about the latest order blocks in up to 5 tickers. You can also customize the algorithm that finds the order blocks and the styling of the screener.
Features of the new Order Blocks Screener :
Find Latest Order Blocks Accross 5 Tickers
Latest Status, Restests, Bullish & Bearish Volume
Customizable Algoritm / Styling
📌 HOW DOES IT WORK ?
Order blocks occur when there is a high amount of market orders exist on a price range. It is possible to find order blocks using specific formations on the chart.
The high & low volume of order blocks should be taken into consideration while determining their strengths. The determination of the high & low volume of order blocks are similar to FVGs, in a bullish order block, the high volume is the last 2 bars' total volume, while the low volume is the oldest bar's volume. In a bearish order block scenerio, the low volume becomes the last 2 bars' total volume.
This screener then finds order blocks accross 5 different tickers, and shows the latest information about them.
Status ->
Far -> The current price is far away from the order block.
Approaching ⬆️/⬇️ -> The current price is approaching the order block, and the direction it's approaching from.
Inside -> The price is currently inside the order block.
Retests -> Retest means the price to invalidate the order block, but failed to do so. Here you can see how many times the price retested the order block.
For the bullish / bearish volume, check the "How Does It Work" section.
🚩UNIQUENESS
This screener can detect latest order blocks and give information about them for up to 5 tickers. This saves the user time by showing them all in a dashboard at the same time. The screener shows the number of the retests of the order block as an unique trait. Another unique ability of the screener is that it shows the latest valid order block's bullish and bearish volume in the dashboard.
⚙️SETTINGS
1. Tickers
You can set up to 5 tickers for the screener to scan order blocks here. You can also enable / disable them and set their individual timeframes.
2. General Configuration
Zone Invalidation -> Select between Wick & Close price for Order Block Invalidation.
Swing Length -> Swing length is used when finding order block formations. Smaller values will result in finding smaller order blocks.

FVG Detector LibraryLibrary "FVG Detector Library"
🔵 Introduction
To save time and improve accuracy in your scripts for identifying Fair Value Gaps (FVGs), you can utilize this library. Apart from detecting and plotting FVGs, one of the most significant advantages of this script is the ability to filter FVGs, which you'll learn more about below. Additionally, the plotting of each FVG continues until either a new FVG occurs or the current FVG is mitigated.
🔵 Definition
Fair Value Gap (FVG) refers to a situation where three consecutive candlesticks do not overlap. Based on this definition, the minimum conditions for detecting a fair gap in the ascending scenario are that the minimum price of the last candlestick should be greater than the maximum price of the third candlestick, and in the descending scenario, the maximum price of the last candlestick should be smaller than the minimum price of the third candlestick.
If the filter is turned off, all FVGs that meet at least the minimum conditions are identified. This mode is simplistic and results in a high number of identified FVGs.
If the filter is turned on, you have four options to filter FVGs :
1. Very Aggressive : In addition to the initial condition, another condition is added. For ascending FVGs, the maximum price of the last candlestick should be greater than the maximum price of the middle candlestick. Similarly, for descending FVGs, the minimum price of the last candlestick should be smaller than the minimum price of the middle candlestick. In this mode, a very small number of FVGs are eliminated.
2. Aggressive : In addition to the conditions of the Very Aggressive mode, in this mode, the size of the middle candlestick should not be small. This mode eliminates more FVGs compared to the Very Aggressive mode.
3. Defensive : In addition to the conditions of the Very Aggressive mode, in this mode, the size of the middle candlestick should be relatively large, and most of it should consist of the body. Also, for identifying ascending FVGs, the second and third candlesticks must be positive, and for identifying descending FVGs, the second and third candlesticks must be negative. In this mode, a significant number of FVGs are eliminated, and the remaining FVGs have a decent quality.
4. Very Defensive : In addition to the conditions of the Defensive mode, the first and third candlesticks should not resemble very small-bodied doji candlesticks. In this mode, the majority of FVGs are filtered out, and the remaining ones are of higher quality.
By default, we recommend using the Defensive mode.
🔵 How to Use
🟣 Parameters
To utilize this library, you need to provide four input parameters to the function.
"FVGFilter" determines whether you wish to apply a filter on FVGs or not. The possible inputs for this parameter are "On" and "Off", provided as strings.
"FVGFilterType" determines the type of filter to be applied to the found FVGs. These filters include four modes: "Very Defensive", "Defensive", "Aggressive", and "Very Aggressive", respectively exhibiting decreasing sensitivity and indicating a higher number of Fair Value Gaps (FVG).
The parameter "ShowDeFVG" is a Boolean value defined as either "true" or "false". If this value is "true", FVGs are shown during the Bullish Trend; however, if it is "false", they are not displayed.
The parameter "ShowSuFVG" is a Boolean value defined as either "true" or "false". If this value is "true", FVGs are displayed during the Bearish Trend; however, if it is "false", they are not displayed.
FVGDetector(FVGFilter, FVGFilterType, ShowDeFVG, ShowSuFVG)
Parameters:
FVGFilter (string)
FVGFilterType (string)
ShowDeFVG (bool)
ShowSuFVG (bool)
🟣 Import Library
You can use the "FVG Detector" library in your script using the following expression:
import TFlab/FVGDetectorLibrary/1 as FVG
🟣 Input Parameters
The descriptions related to the input parameters were provided in the "Parameter" section. In this section, for your convenience, the code related to the inputs is also included, and you can copy and paste it into your script.
PFVGFilter = input.string('On', 'FVG Filter', )
PFVGFilterType = input.string('Defensive', 'FVG Filter Type', )
PShowDeFVG = input.bool(true, ' Show Demand FVG')
PShowSuFVG = input.bool(true, ' Show Supply FVG')
🟣 Call Function
You can copy the following code into your script to call the FVG function. This code is based on the naming conventions provided in the "Input Parameter" section, so if you want to use exactly this code, you should have similar parameter names or have copied the "Input Parameter" values.
FVG.FVGDetector(PFVGFilter, PFVGFilterType, PShowDeFVG, PShowSuFVG)

Order Blocks Finder [TradingFinder] Major OB | Supply and Demand🔵 Introduction
Drawing all order blocks on the path, especially in range-bound or channeling markets, fills the chart with lines, making it confusing rather than providing the trader with the best entry and exit points.
🔵 Reason for Indicator Creation
For traders familiar with market structure and only need to know the main accumulation points (best entry or exit points), and primary order blocks that act as strong sources of power.
🟣 Important Note
All order blocks, both ascending and descending, are identified and displayed on the chart when the structure of "BOS" or "CHOCH" is broken, which can also be identified with "MSS."
🔵 How to Use
When the indicator is installed, it plots all order blocks (active order blocks) and continues until the price reaches them. This continuation happens in boxes to have a better view in the TradingView chart.
Green Range : Ascending order blocks where we expect a price increase in these areas.
Red Range : Descending order blocks where we expect a price decrease in these areas.
🔵 Settings
Order block refine setting : When Order block refine is off, the supply and demand zones are the entire length of the order block (Low to High) in their standard state and cannot be improved. If you turn on Order block refine, supply and demand zones will improve using the error correction algorithm.
Refine type setting : Improving order blocks using the error correction algorithm can be done in two ways: Defensive and Aggressive. In the Aggressive method, the largest possible range is considered for order blocks.
🟣 Important
The main advantage of the Aggressive method is minimizing the loss of stops, but due to the widening of the supply or demand zone, the reward-to-risk ratio decreases significantly. The Aggressive method is suitable for individuals who take high-risk trades.
In the Defensive method, the range of order blocks is minimized to their standard state. In this case, fewer stops are triggered, and the reward-to-risk ratio is maximized in its optimal state. It is recommended for individuals who trade with low risk.
Show high level setting : If you want to display major high levels, set show high level to Yes.
Show low level setting : If you want to display major low levels, set show low level to Yes.
🔵 How to Use
The general view of this indicator is as follows.
When the price approaches the range, wait for the price reaction to confirm it, such as a pin bar or divergence.
If the price passes with a strong candle (spike), especially after a long-range or at the beginning of sessions, a powerful event is happening, and it is outside the credibility level.
An Example of a Valid Zone
An Example of Breakout and Invalid Zone. (My suggestion is not to use pending orders, especially when the market is highly volatile or before and after news.)
After reaching this zone, expect the price to move by at least the minimum candle that confirmed it or a price ceiling or floor.
🟣 Important : These factors can be more accurately measured with other trend finder indicators provided.
🔵 Auxiliary Tools
There is much talk about not using trend lines, candlesticks, Fibonacci, etc., in the web space. However, our suggestion is to create and use tools that can help you profit from this market.
• Fibonacci Retracement
• Trading Sessions
• Candlesticks
🔵 Advantages
• Plotting main OBs without additional lines;
• Suitable for timeframes M1, M5, M15, H1, and H4;
• Effective in Tokyo, Sydney, and London sessions;
• Plotting the main ceiling and floor to help identify the trend.
