Oscillatori

stochastic supper trendstocastic supper trend channel based on sk trading system with dynamic od os lines changing color

Average Directional Index infoAverage Directional Index (ADX) is a technical indicator created by J. Welles Wilder that measures trend strength (not direction!). Values range from 0 to 100.
This indicator is a supplementary tool for assessing whether trend strategies are worthwhile, monitoring changes in trend strength and avoiding weak, choppy movements
Value Interpretation:
0-25: Weak trend or sideways market
25-50: Moderate to strong trend
50-75: Very strong trend
75-100: Extremely strong trend (rare)
Important: ADX does not indicate trend direction (up/down), only its strength!
This script indicator includes additional features:
1. ADX Plot (purple line)
Basic ADX value showing current trend strength.
2. ADX Trend Analysis (arrows)
The script compares current ADX with its 10-period moving average with ±5% tolerance:
↑ (green): ADX rising → trend strengthening
↓ (red): ADX falling → trend weakening
⮆ (gray): ADX stable → trend strength unchanged
3. Information Table
Displays current ADX value with trend arrow in the top-right corner.
Parameters to Configure
Smoothing (default: 14) - Indicator smoothing period
Lower values (e.g., 7): more sensitive, more signals
Higher values (e.g., 21): more stable, less noise
Indicator Length (default: 14) - Period for calculating directional movement (+DI/-DI)
Wilder's standard value is 14
Trend Length (default: 10) - Period for moving average to analyze ADX dynamics
Determines how quickly changes in trend strength are detected
Practical Application
✅ Strategy 1: Trend Strength Filter
1. ADX > 25 → look for positions aligned with the trend
2. ADX < 25 → avoid trend strategies, consider oscillators
✅ Strategy 2: Entries on Strengthening Trend
1. ADX crosses above 25 + arrow ↑ → trend gaining momentum
2. Combine with other indicators (e.g., EMA) for direction confirmation
✅ Strategy 3: Exhaustion Warning
1. ADX > 50 + arrow ↓ → strong trend may be exhausting
2. Consider profit protection or trailing stop

SwPremiumThis indicator is a comprehensive technical analysis tool designed to identify high-probability trend reversal and continuation setups using a Multi-Factor Confluence system. It combines six powerful classic indicators into a unified logic engine to filter out market noise and provide actionable signals.
The logic is built around a unique "Hook & Trigger" mechanism, which prevents premature entries by requiring a setup phase before a confirmation phase.
How It Works (The Logic)
The script monitors the market in two distinct stages:
1. The "Hook" Phase (Setup): Before looking for an entry, the script waits for a specific number of conditions to be met simultaneously (user-defined count, e.g., 4 out of 6). This indicates that the market is primed for a move.
Stoch RSI: Checks for overbought/oversold extremes (Custom thresholds).
RSI: Monitors relative strength against lower/upper bounds.
CCI: Analyzes momentum deviations.
TRIX: Identifies trend direction changes.
MACD: Looks for bullish/bearish crosses or convergence patterns.
Bollinger Bands: Checks price position relative to the bands (Mean Reversion logic).
2. The "Full Entry" Phase (Trigger): Once the "Hook" is established, the script enters a "Waiting Mode" for a user-defined period (Timeout Bars). During this window, if a secondary set of confirmation conditions ("Full Entry" criteria) is met, a final signal is generated.
This ensures that we don't just catch a falling knife but wait for momentum confirmation within the setup window.
Features & Indicators Used
RSI & Stochastic RSI: Dual momentum filtering to gauge exhaustion points.
CCI (Commodity Channel Index): With smoothing options (SMA, EMA, WMA) to detect cyclical trends.
MACD: Includes both crossover logic and histogram convergence detection.
TRIX: A triple exponentially smoothed moving average to filter insignificant price movements.
Bollinger Bands: Used to determine relative high/low price levels.
Dashboard & Visuals
Live Information Table: A panel displayed on the top-right corner shows the real-time status of every single indicator (RSI, Stoch, CCI, etc.), the current trend bias (Long/Short), and the status of the "Hook" mechanism.
Labels & Alerts:
Yellow Triangle/Labels: Indicates a "Hook" (Setup) has formed.
Green/Red Arrows: Indicates a confirmed "Long" or "Short" entry signal.
Alerts: Fully compatible with TradingView alerts for automation.
Settings
Signal Settings: Customize how many conditions are needed for a "Hook" vs. a "Full Entry".
Indicator Parameters: Full control over periods, lengths, and source types for RSI, CCI, MACD, and BB.
Visuals: Toggle the dashboard, labels, and arrows on/off according to your chart preference.
Disclaimer: This tool is for educational purposes and technical analysis assistance. It does not guarantee profits. Always use proper risk management.

Quant RSIQuant RSI MTF - Professional Multi-Timeframe RSI Analysis
A sophisticated RSI indicator built for serious traders who need more than basic overbought and oversold levels. This tool combines advanced filtering techniques with multi-timeframe analysis to give you a clearer picture of momentum across different time horizons.
What Makes This Different
Most RSI indicators use simple moving averages that lag behind price action. This version uses Laguerre filtering, which is a mathematical technique that reduces lag while maintaining smooth signals. The result is an RSI that responds faster to genuine momentum shifts without getting whipped around by noise.
The system monitors five different timeframes simultaneously, checking whether momentum is aligned or diverging across short-term, medium-term, and long-term perspectives. When all timeframes agree on direction, you have significantly higher probability setups. When they disagree, you know to be cautious.
Core Features
The indicator calculates three separate RSI values using different lookback periods - short, medium, and long term. Each one serves a specific purpose. The short-term catches quick reversals, the medium-term identifies swing trading opportunities, and the long-term keeps you aware of the bigger trend.
Dynamic threshold adjustment is built in based on ATR volatility measurements. During high volatility periods, the overbought and oversold levels automatically expand because extreme readings become more common. During low volatility, the thresholds tighten up. This prevents you from getting false signals just because market conditions changed.
Volume confirmation is integrated into every signal. The system analyzes volume delta to determine whether price movements are supported by actual buying or selling pressure. A divergence between RSI and volume often signals weak momentum that is likely to reverse.
Advanced divergence detection goes beyond basic hidden and regular divergences. The system calculates divergence strength as a percentage, so you know which setups have the most potential. A weak divergence barely worth noting gets scored low, while a major divergence with significant price-RSI separation scores high.
Signal Intelligence
Every potential signal gets assigned a confidence score from 0 to 100. This score factors in trend strength, momentum, volume confirmation, divergence presence, ADX readings, and timeframe alignment. A score above 70 means all the pieces are in place. Below 40 means something important is missing.
The indicator calculates ADX automatically to measure trend strength. Even if RSI shows oversold conditions, a weak ADX reading suggests the market is ranging and mean reversion might not work. Strong ADX with extreme RSI readings often produces the best setups.
Market condition classification tells you whether you are in a strong bull trend, bear trend, pullback, sideways chop, or volatility expansion phase. Each condition requires different trading approaches, and the indicator adapts its signals accordingly.
Volatility Analysis
Real-time volatility state monitoring shows you whether volatility is exploding, expanding, stable, or contracting. Contracting volatility often precedes big moves. Exploding volatility suggests you should reduce position size or stay out entirely.
The system compares current volatility to historical levels using percentile rankings. If current ATR is in the 90th percentile, you know volatility is unusually high even if you have not traded this asset before.
Volume profile approximation analyzes where volume is accumulating at different price levels. While not as detailed as true market profile software, it gives you insight into support and resistance zones based on actual trading activity.
What This Indicator Does Well
The Laguerre filtering genuinely reduces lag compared to standard RSI. You will notice signals forming 1-3 bars earlier than traditional RSI implementations, which can make a significant difference in fast-moving markets.
Multi-timeframe confluence is calculated automatically instead of forcing you to manually switch between charts. When all five timeframes align, the visual confirmation is immediate and the probability of success increases dramatically.
Dynamic threshold adjustment based on volatility is something most RSI indicators lack entirely. This prevents you from taking low-probability trades just because RSI hit 30 or 70 during unusual market conditions.
Volume integration with every signal helps filter out weak setups. RSI might show oversold, but if volume delta is negative and selling pressure continues, the indicator knows not to generate a buy signal.
Divergence strength calculation goes beyond just marking divergences with arrows. Knowing that a divergence has 75% strength versus 20% strength completely changes how you should trade it.
The ADX integration prevents you from trying to trade reversals in ranging markets where mean reversion strategies fail. ADX below 20 with extreme RSI readings typically results in continued chop rather than reversals.
What This Indicator Does Not Do Well
The multi-timeframe data requests can cause slight delays on lower-end computers or slow internet connections. If you are running multiple indicators simultaneously, you might notice brief calculation lags.
Divergence detection requires at least 10-15 bars of history to identify pivot points accurately. On brand new charts or immediately after timeframe changes, divergence signals may be absent for several bars.
The Laguerre filtering, while reducing lag, can occasionally produce false signals during extreme volatility spikes like news releases or market opens. The smoothing cannot completely eliminate noise during truly chaotic conditions.
Dynamic thresholds work well most of the time but can occasionally adapt too slowly during rapid volatility regime changes. If ATR suddenly doubles, it might take 5-10 bars for the thresholds to fully adjust.
The indicator uses significant processing power with five timeframe requests plus all the calculations for volatility, volume analysis, divergences, and signal scoring. On very low timeframes like 1-second or tick charts, this could cause performance issues.
There is no built-in backtesting functionality. You can see historical signals on the chart, but you cannot generate statistical performance reports without exporting data and analyzing it separately.
Best Use Cases
This indicator excels for scalpers and day traders who need fast, reliable RSI signals with proper context. The reduced lag from Laguerre filtering combined with volume confirmation catches reversals quickly enough to matter on 1-5 minute charts.
Swing traders benefit from the multi-timeframe alignment feature. Before entering a multi-day position, you can verify that momentum is aligned across your entry timeframe, swing timeframe, and position timeframe. This significantly improves win rates.
Range traders can use the dynamic thresholds and volatility analysis to identify when markets are coiling up for breakout moves. Contracting volatility with neutral RSI readings often precedes the best trending moves.
The divergence detection with strength calculations makes this valuable for reversal traders. Instead of taking every divergence, you can filter for only high-strength divergences above 60% for better risk-reward setups.
What This Is Not
This is not a standalone trading system. It provides momentum analysis and signal quality scoring, but you still need proper risk management, position sizing, and confluence with price action or other technical factors.
This is not a high-frequency trading tool. While the Laguerre filtering reduces lag, it is not designed for sub-second timeframes or algorithmic trading where microseconds matter.
This is not a volatility prediction system. It measures current and recent volatility states, but it cannot forecast whether volatility will expand or contract in the future beyond basic statistical tendencies.
This is not a replacement for understanding market structure. RSI divergences and extreme readings mean different things at major support and resistance versus in the middle of nowhere. You need context.
Technical Details Worth Knowing
The Laguerre filter uses a gamma parameter that you can adjust. Higher gamma values (0.8-0.9) produce smoother lines with more lag. Lower values (0.5-0.6) respond faster but with more noise. The default of 0.7 balances both reasonably well.
The three RSI lengths serve different purposes. The 5-period catches very short-term momentum for scalping. The 14-period is standard for swing trading. The 21-period keeps you aligned with longer-term trends. You can adjust these based on your trading timeframe.
ATR normalization divides current ATR by a 50-period moving average of ATR. This creates a volatility factor that adjusts thresholds dynamically. When volatility doubles, overbought might move from 70 to 85 automatically.
Volume delta is calculated as volume times the percentage where price closed within the bar's range. An up-close at the high gets full positive delta. A down-close at the low gets full negative delta. This approximates buying and selling pressure without tick data.
Signal strength scoring uses weighted factors. Trend direction gets 30% weight, momentum gets 20%, volume confirmation 15%, divergence presence 15%, ADX strength 10%, and timeframe alignment 10%. This creates a 0-100 composite score.
ADX calculation uses the standard Wilder smoothing method with directional movement indicators. The trend classification shows whether bulls or bears have control, while the strength rating (weak, moderate, strong, extreme) tells you how much conviction is behind the move.
Final Assessment
This is a well-designed RSI indicator that adds genuine value beyond what basic RSI provides. The Laguerre filtering works as advertised for lag reduction. The multi-timeframe analysis saves time and provides clarity. The dynamic thresholds adapt intelligently to changing volatility.
The signal scoring system is particularly useful because it prevents you from chasing low-quality setups. A 35% confidence score tells you immediately that something is wrong with the trade even if RSI looks tempting.
However, this is definitely not a beginner indicator. There are a lot of moving parts and the learning curve is real. You need to understand RSI basics, divergences, volume analysis, and volatility regimes to use this effectively. Someone new to trading would be overwhelmed.
For experienced traders who already understand momentum indicators and want more sophisticated analysis, this is legitimately valuable. The combination of features is not commonly found in free indicators, and the implementation quality is solid.
The main limitation is that it is still just an RSI indicator at its core. No amount of filtering, multi-timeframe analysis, or scoring can overcome the fundamental limitations of oscillator-based trading. You need confluence with price action, support and resistance, and proper market context.
If you trade primarily based on momentum and reversals, this indicator provides most of what you would need in one package. If you are a pure price action trader or trend follower, this probably would not change your approach significantly.
Overall, this is a 7.5 out of 10 indicator. It does what it claims to do well, adds meaningful improvements over basic RSI, and provides useful analysis tools. It is not revolutionary, but it is a solid professional-grade tool for the right type of trader.

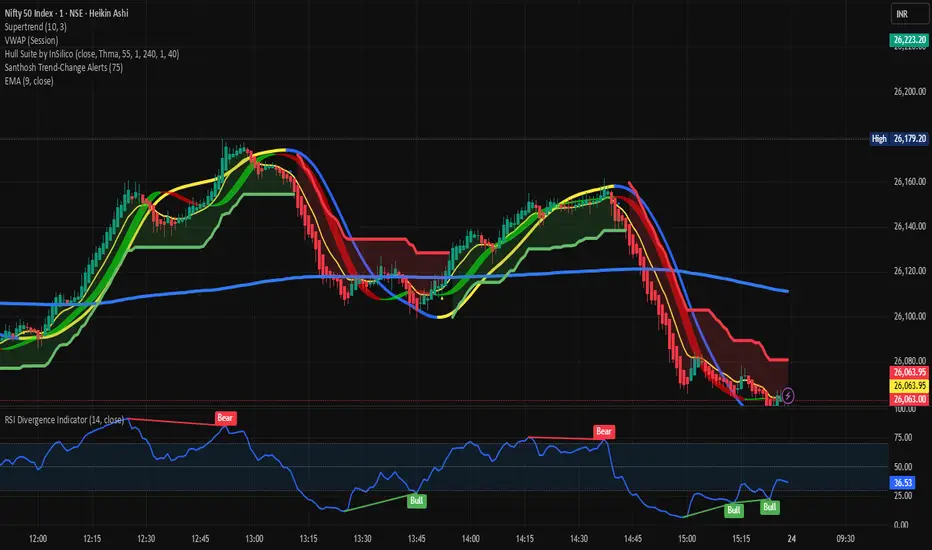
Santhosh Trend-Change AlertsSanthosh Trend-Change Alerts : This indicator identifies potential trend change in market. i would suggest to use 1Min time frame with 75 Period ( Input). To have more accuracy on trading , add RSI Divergence (14) and Super trend (10,3)
[CASH] Crypto And Stocks Helper (MultiPack w. Alerts)ATTENTION! I'm not a good scripter. I have just learned a little basics for this project, stolen code from other public scripts and modified it, and gotten help from AI LLM's.
If you want recognition from stolen code please tell me to give you the credit you deserve.
The script is not completely finished yet and contains alot of errors but my friends and family wants access so I made it public.
_________________________________________________________________________________
CASH has multiple indicators (a true all-in-one multipack), guides and alerts to help you make better trades/investments. It has:
- Bitcoin Bull Market Support Band
- Dollar Volume
- 5 SMA and 5 EMA
- HODL Trend (a.k.a SuperTrend) indicator
- RSI, Volume and Divergence indicators w. alerts
More to come as well, like Backburner and a POC line from Volume Profile.
Everything is fully customizable, appearance and off/on etc.
More information and explainations along with my guides you can find in settings under "Input" and "Style".

Quantum Flux Institutional Oscillator Quantum Flux Institutional Oscillator
This script is available by invitation only.
Author: blntdmn | 2025
What is it?
Quantum Flux Institutional Oscillator
In shortly Quantum Flux is a multi-layered institutional decision support oscillator engineered to detect high-probability regime shifts and momentum continuations with precision. It integrates advanced analytical engines that dissect market dynamics (structure, momentum asymmetry, institutional confluence, regime intelligence, and volatility rhythm) to overcome the limitations of isolated indicators. Buy/sell signals emerge solely from a rigorous multi-engine consensus, ensuring alignment across all layers.
This is not a "strategy," but a sophisticated signal-generating oscillator. As such, it does not deliver backtest metrics (e.g., profit/loss, drawdown) via TradingView's strategy tester. Its core value lies in enhancing real-time decision clarity for disciplined traders.
What Does It Promise, and What Does It Not Promise?
• What Does It Promise:
o Institutional-Grade Noise Suppression: Dramatically cuts false signals in choppy, low-volume, or manipulative environments.
o Regime-Aware High-Probability Detection: Employs neural intelligence to identify and validate setups only in aligned market states (bullish, bearish, or consolidation).
o Dynamic Adaptation to Market Flux: Automatically recalibrates thresholds and sensitivities based on real-time volatility and structural shifts.
o Seamless Automation Integration: Delivers precise, JSON-formatted alerts with dynamic risk parameters for hands-free execution.
• What It Doesn't Promise:
o Guaranteed Profits: No tool can assure future gains; Quantum Flux amplifies probabilities, not certainties.
o Effortless Riches: Optimal results demand sound risk protocols, market intuition, and consistent application.
o Historical Backtests: As an oscillator, it focuses on forward-looking analysis, not retrospective simulations.
Which Well-Known Indicators Are Used For What Purpose?
Quantum Flux crafts a proprietary consensus framework, drawing on established technical elements as foundational inputs and qualifiers—never as standalone signal generators. These components feed into the author's unique hybrid engine for processing:
• ADX and DMI: Employed to gauge trend dominance and directional bias. Quantum Flux uses them strictly as regime qualifiers to validate sufficient momentum before consensus formation.
• Moving Averages (EMA and SMA): Serve as smoothing baselines for price direction and volatility normalization. Their derivatives are fused into the core flux engine alongside proprietary filters.
• ATR (Average True Range): Powers dynamic scaling and risk adjustment without direct signaling. It informs the oscillator's volatility-adaptive smoothing, tailoring sensitivity to current market breath.
• RSI (Relative Strength Index): Acts as a momentum asymmetry probe. Integrated subtly to detect divergences and overextensions, feeding the neural regime layer without overriding the consensus.
Original Methodology and Proprietary Logic
This oscillator stands independent of any public or open-source codebases, including the author's prior AMF PG Strategy 2.3 (a publicly available trend-following framework). Quantum Flux introduces an entirely original hybrid core: a Heikin-Ashi-derived flux momentum oscillator, neural-weighted regime memory (attention-like scoring across 8 market factors), institutional confluence validator (blending structural shifts with liquidity dynamics), and a 0–100 layered scoring matrix with adaptive boosting. The regime-shifting logic—dynamically recalibrating filters via volatility-normalized thresholds and multi-engine veto power—represents the author's protected innovation. Source code preservation is vital to safeguard this intellectual edge.
What Problems Does It Solve?
Problem 1: Fragmented Signals and Over-Reliance on Single Inputs
o Quantum Flux Solution: Multi-Engine Consensus Protocol. Signals require unanimous agreement from flux momentum, structural validation, and regime intelligence—no isolated triggers allowed. This eradicates noise-driven whipsaws, prioritizing only converged, high-conviction opportunities.
Problem 2: Blindness to Evolving Market Regimes
o Quantum Flux Solution: Neural Regime Intelligence. The system continuously profiles the market's state (trend persistence vs. consolidation traps) using weighted historical memory and factor fusion, auto-tuning filters like a vigilant sentinel to match the prevailing rhythm.
Problem 3: Static Thresholds Leading to Performance Drift
o Quantum Flux Solution: Volatility-Normalized Adaptation. All parameters (from scoring weights to confirmation windows) self-adjust in real-time, countering decay in fixed setups and ensuring resilience across bull runs, bear traps, or sideways grinds.
Automation Ready: Customizable Webhook Alerts
Quantum Flux transcends visual cues, empowering full-spectrum automation. It dispatches configurable JSON payloads for long/short entries, embedding ticker, entry price, ATR-derived TP/SL levels, and regime context. Effortlessly sync with platforms like 3Commas, PineConnector, Alertatron, or bespoke bots for 24/7, rule-based execution—freeing you from screen time while upholding the edge.
Why Released "By Invitation Only"?
• Safeguarding Original Intellectual Property: Born from extensive 2024–2025 R&D, its neural fusion, hybrid consensus, and institutional validators are one-of-a-kind. Public exposure would erode this proprietary advantage.
• Preserving Signal Integrity: Limits misuse, signal farming, or unauthorized resale, ensuring the tool remains untainted for genuine users.
• Sustainable Ecosystem: Invite-only access funds perpetual enhancements, dedicated support, and an exclusive community for verified traders committed to the methodology.
This indicator is for educational purposes only. Past performance does not guarantee future results. Always practice appropriate risk management and protect your capital.

Trend Cross Filter by Pooja⭐ Trend Cross Filter by Pooja
Trend Cross Filter by Pooja is a clean and efficient crossover-based entry tool designed to help traders identify momentum shifts with clarity. This indicator combines a fast RSI and a smoothed RSI-MA baseline with optional trend and volatility filters, allowing users to focus on higher-quality crossover signals.
The goal of this tool is to offer structured, easy-to-read entries without clutter or complexity. All signals appear directly on the chart using markers, making it suitable for intraday and short-term decision-making.
⭐ Key Features
🔶 1. RSI–MA Crossover Signals
Generates BUY/SELL signals when RSI crosses above or below its moving average.
Clean visual markers help highlight potential momentum changes.
🔶 2. Trend Strength Filter (Optional)
Uses a custom ADX calculation to allow signals only when trend strength meets the selected threshold.
🔶 3. Volatility Filter (ATR-Based)
An optional ATR/Price filter helps avoid signals during extremely low-volatility or flat periods.
🔶 4. RSI-MA Slope Filter
Allows users to accept only those signals where the slope of the RSI-MA indicates meaningful directional strength.
🔶 5. Minimum Bars Between Signals
Prevents back-to-back signals in noisy or sideways conditions.
🔶 6. Chart-Based Visual Signals
Signals appear directly on the price chart:
BUY markers for upward crossover
SELL markers for downward crossover
Users can choose between triangle or label-style signals.
🔶 7. Alert + Webhook Compatible
Built-in alert conditions for BUY and SELL signals.
Users can connect alerts to webhooks or automation tools if they wish.
🔶 8. Flexible Customization
All filters, thresholds, colors, and label styles can be adjusted easily based on personal preference.
⭐ How to Use
Add the indicator to your chart.
Choose your preferred signal style (Label / Triangle).
Enable or disable the ADX, ATR, or slope filters as needed.
Create TradingView alerts using the built-in BUY and SELL alert conditions if automation or notifications are required.
Combine signals with your own risk management and market analysis.
⭐ Notes
Works across multiple timeframes and different instruments.
Filtering options help reduce noise, but users should test settings based on their trading approach.
⚠️ Disclaimer
This indicator is a technical analysis tool created for educational and chart-analysis purposes.
It does not provide financial advice, does not guarantee profits, and should not be used as the sole basis for trading decisions.
Market conditions vary, and users are fully responsible for their own trades, risk management, and results.
Always test any tool or strategy on historical data or a demo environment before using in live markets.

Day Trading Astra by Pooja📌 Day Trading Astra by Pooja
Day Trading Astra by Pooja is specily designed for F&O Traders, a clean and fast momentum-shift indicator designed to support day traders with clear entry signals and structured filtering.
It uses a refined RSI–MA crossover engine, allowing traders to visualize momentum transitions directly on the price chart with minimal clutter.
✨ Key Features
🔶 1. RSI–MA Crossover Engine
Identifies potential momentum shifts using a fast RSI and smoothed RSI-MA baseline.
🔶 2. Clean BUY/SELL Chart Signals
Markers appear directly on the candle chart—easy to read, no extra panes.
🔶 3. Smart Filtering System (Optional)
To help reduce low-quality signals in uncertain conditions:
ADX trend-strength filter
ATR volatility check
Slope validation
Minimum bars between two signals
🔶 4. Alert + Webhook Ready
Supports TradingView alerts and webhook integration for automation tools.
Each alert includes symbol, direction, price, timestamp, unique ID, and an optional secret key for secure execution.
🔶 5. Multi-Timeframe Flexible
Works across all timeframes; users can apply it according to their day-trading style.
📝 How to Use
Add indicator to chart.
Select your preferred filters or use default settings.
Enable alerts if automated notifications are needed.
Combine with your own risk management and trading framework.
This tool is meant to support analysis, not replace personal judgment.
⚠️ Disclaimer
This script is a technical analysis tool and not financial advice.
Results vary depending on market conditions and user settings.
No indicator can guarantee profits or eliminate risk.
Always test settings before applying them in live markets.
The user is fully responsible for all trading decisions.
⭐ Summary
A clean, fast, and structured momentum-entry tool designed to help day traders identify potential intraday shifts with clarity and alert support.

TCP DMITCP DMI - Advanced Technical Indicator
This advanced DMI (Directional Movement Index) indicator enhances the traditional DMI by adding intelligent dynamic support and resistance levels based on historical price action analysis.
KEY FEATURES:
1. Standard DMI Components:
- DI+ (Directional Indicator Positive): Measures upward price movement
- DI- (Directional Indicator Negative): Measures downward price movement
- ADX (Average Directional Index): Measures trend strength
- Middle line at 20 for reference
2. Dynamic Support & Resistance Levels:
The indicator automatically identifies the most significant support and resistance levels by analyzing the last 400 candles (customizable) and detecting where DI lines have been rejected most frequently.
TWO TIERS OF LEVELS:
A) Normal Levels (Solid Lines):
- Support: Below 15
- Resistance: Above 25
- Style: Solid lines with 60% transparency
- These represent moderate support/resistance zones
B) Strong Levels (Dashed Lines):
- Strong Support: Below 10
- Strong Resistance: Above 30
- Style: Dashed lines with 40% transparency (more visible)
- These represent critical support/resistance zones
3. Intelligent Display Logic:
- When DI is ABOVE 20: Shows resistance levels (where price might face selling pressure)
- When DI is BELOW 20: Shows support levels (where price might find buying support)
- Each DI line (+ and -) has its own color-coded support/resistance levels for easy identification
4. Color Coding:
- DI+ levels use GREEN (customizable)
- DI- levels use RED/ORANGE (customizable)
- Support/Resistance lines match their respective DI colors but with reduced opacity
- This makes it instantly clear which DI the support/resistance belongs to
5. Rejection Detection Algorithm:
The indicator scans historical data to find peaks and troughs at specific levels, counting how many times price was rejected at each level. The level with the most rejections becomes the displayed support or resistance.
CUSTOMIZABLE PARAMETERS:
- ADX Smoothing: Default 14
- DI Length: Default 14
- Lookback Period: 400 candles (range: 50-500)
- Line Length: 15 candles forward + 15 candles back = 30 candle span
- DI+ Color: Customizable (default green)
- DI- Color: Customizable (default red)
- ADX Color: Customizable (default blue)
- Normal S/R Transparency: Default 60%
- Strong S/R Transparency: Default 40%
HOW TO USE:
1. Trend Identification:
- When DI+ crosses above DI-: Potential uptrend
- When DI- crosses above DI+: Potential downtrend
- ADX above 25: Strong trend
- ADX below 20: Weak trend or ranging market
2. Support/Resistance Trading:
- Watch for price reaction when DI approaches displayed support/resistance levels
- Solid lines = moderate levels
- Dashed lines = strong levels (more significant)
- The more rejections at a level, the more significant it becomes
3. Entry/Exit Signals:
- Entry: When DI bounces off support (below 20) or resistance (above 20)
- Exit: When DI breaks through major support/resistance levels
- Strong levels (dashed) are more reliable for major decisions
ADVANTAGES:
✓ Reduces chart clutter by only showing relevant levels based on current DI position
✓ Automatically adapts to changing market conditions
✓ Color-coded for instant visual recognition
✓ Two-tier system helps prioritize trading decisions
✓ Historical rejection analysis provides data-backed levels
✓ Fully customizable to match any trading style
BEST USED FOR:
- Swing trading
- Trend following
- Support/resistance trading strategies
- Identifying potential reversal zones
- Confirming breakout validity
- Risk management (stop-loss placement)
This indicator combines the power of traditional DMI with smart support/resistance detection, giving traders a comprehensive tool for technical analysis without overwhelming the chart with excessive information.

Momentum Tide [Alpha Extract]A sophisticated momentum-based trend identification system that measures normalized price deviation from an EMA baseline using ATR scaling and hyperbolic tangent smoothing for precise trend state classification. Utilizing advanced signal processing with configurable neutral bands and slope sensitivity adjustments, this indicator delivers institutional-grade momentum analysis with continuous strength measurement and visual trend confirmation. The system's three-state classification (bullish, bearish, neutral) combined with dynamic color intensity scaling provides comprehensive market momentum assessment across varying volatility conditions.
🔶 Advanced Baseline Deviation Framework
Implements EMA-based baseline calculation with ATR-normalized deviation measurement to create volatility-adjusted momentum signals. The system calculates raw price deviation from the baseline, scales by ATR and slope sensitivity factor, then applies exponential smoothing for stable signal generation with reduced noise and false transitions.
// Core Momentum Calculation
Baseline = ta.ema(close, Baseline_Length)
ATR_Value = ta.atr(ATR_Length)
Raw_Deviation = (close - Baseline) / (ATR_Value * Slope_Scaler)
Signal = ta.ema(Raw_Deviation, Signal_Smoothing)
🔶 Hyperbolic Tangent Normalization Engine
Features sophisticated tanh transformation that clamps raw deviation signals into normalized -1 to +1 range for consistent interpretation across all market conditions. The system applies safe exponential calculations with value capping to prevent overflow while maintaining signal sensitivity, creating bounded momentum readings suitable for systematic threshold analysis.
// Tanh Normalization
Clamped_Signal = tanh(Signal) // Bounded to
Strength = abs(Clamped_Signal) // Momentum intensity
🔶 Three-State Classification System
Implements intelligent trend state determination using configurable neutral band thresholds to reduce whipsaw signals during ranging conditions. The system classifies market as bullish (+1) when momentum exceeds upper neutral band, bearish (-1) below lower neutral band, and neutral (0) within the band, providing clear directional bias with built-in consolidation recognition.
🔶 Dynamic Color Intensity Architecture
Provides advanced visual feedback through momentum strength-based color intensity modulation, where stronger trends display more opaque colors and weaker trends show increased transparency. The system dynamically adjusts color alpha values based on absolute momentum strength, creating intuitive visual representation of trend conviction across baseline, candles, and bars.
🔶 Trend Strength Meter Visualization
Features innovative horizontal gradient meter displaying real-time momentum position across bear-to-bull spectrum with 24-segment resolution. The system creates smooth color transitions from bearish red through neutral gray to bullish green, with arrow indicator showing precise momentum location for instant trend strength assessment without cluttering the price chart.
🔶 Intelligent Flip Detection System
Generates transition markers when trend state changes from neutral/bearish to bullish or neutral/bullish to bearish, with duplicate signal suppression to prevent marker clustering. The system tracks previous signal states and only plots new markers on genuine trend reversals, providing clean entry signal visualization for systematic trading approaches.
snapshot
🔶 Configurable Neutral Band Framework
Implements adjustable neutral zone width using ATR percentage parameters to optimize signal frequency for different trading styles and market conditions. Wider bands reduce flip frequency for position trading while tighter bands increase sensitivity for active trading strategies, enabling customization without code modification.
🔶 Slope Sensitivity Adjustment
Features slope scaler parameter that modulates ATR normalization factor, controlling signal smoothness versus responsiveness trade-off. Higher values create smoother momentum readings with fewer transitions while lower values increase snappiness for faster reaction to price changes, allowing optimization across different volatility regimes and timeframes.
🔶 Comprehensive Visual Integration
Provides multi-dimensional trend visualization through color-coded baseline overlay, momentum-synchronized candle coloring, and bar color modification with configurable display toggles. The system includes optional flip markers and strength meter with position control for complete chart integration without visual overload.
🔶 Performance Optimization Framework
Utilizes efficient calculation methods with optimized table management for strength meter updates and minimal computational overhead for real-time momentum processing. The system includes intelligent state tracking and safe mathematical operations to prevent errors during extreme market conditions while maintaining consistent performance.
🔶 Why Choose Momentum Tide ?
This indicator delivers sophisticated momentum-based trend analysis through normalized deviation measurement and intelligent three-state classification. Unlike traditional momentum oscillators that operate in separate windows, Momentum Tide integrates directly with price action through baseline overlay and candle coloring while providing the analytical depth of bounded momentum measurement. The system's combination of tanh normalization, configurable neutral bands, dynamic color intensity, and innovative strength meter makes it essential for traders seeking adaptive trend-following approaches with clear visual feedback across cryptocurrency, forex, and equity markets. The three-state system naturally filters ranging periods while the momentum strength measurement enables position sizing and confidence assessment for systematic trading strategies.

HTF BIAS FILTER🧭HTF Bias Filter Indicator: 5 in 1 indicator
Technical Overview
The Bias Filter is a comprehensive multi-timeframe tool designed to confirm directional bias using five key indicators before entering a trade. It plots higher-timeframe Moving Averages directly on the chart and provides an immediate status summary via a static dashboard.
The more confluence on the dashboard, the greater the probability of the direction of the trade.
1. 📊 Display Components
A. Plotted Lines
The indicator uses the request.security function to draw Moving Averages from higher timeframes onto your current chart:
1H EMA 21 (Purple): The 21-period Exponential Moving Average calculated on the 1-Hour (60 min) chart. Plotted using a step-line style.
4H EMA 50 (Red): The 50-period Exponential Moving Average calculated on the 4-Hour (240 min) chart. Plotted using a step-line style.
B. Directional Dashboard
A fixed-position summary table is anchored to the bottom-right corner of the chart, providing a quick glance at the current status of all five filters.
2. 🎨 Colour Logic
Each of the five indicators is assigned a colour based on its current directional signal. The more indicators that show the same colour (confluence), the stronger the signal and the higher the likelihood of a high-probability trade.
🟢 Green indicators are signaling UP/BUY (Bullish momentum or trend).
🔴 Red indicators are signaling DOWN/SELL (Bearish momentum or trend).
⚫ Gray indicators are signaling Mixed or flat directions (neutral or undecided).
Note: The dashboard's main header color is determined by a strict confluence logic (All four 4H filters must align for Green/Red), while individual indicator colors follow the simple rules above.
3. 📋 Indicator Breakdown and Logic
The dashboard provides the direction of five different filters.
3.1. Higher-Timeframe (HTF) Trend Indicators
These two signals determine the immediate slope and direction of the primary Moving Averages:
4H EMA 50:
Timeframe: 4-Hour (240 min)
Logic: Compares the current EMA value to the value two bars ago on the 4H chart.
Output: UP ↑, DOWN ↓, or FLAT ⏸
1H EMA 21:
Timeframe: 1-Hour (60 min)
Logic: Compares the current EMA value to the value two bars ago on the 1H chart.
Output: UP ↑, DOWN ↓, or FLAT ⏸
3.2. 4-Hour Confluence Filters
These three indicators provide supplementary confirmation on Volume, Price Position, and Momentum, all calculated on the 4-Hour (240 min) chart:
4H OBV (Smoothed):
Timeframe: 4-Hour (240 min)
Logic: Direction is based on the current value of the 21-bar smoothed On-Balance Volume (OBV) compared to its value nine bars ago.
Output: UP ↑, DOWN ↓, or FLAT ⏸
4H ATR DIR (EMA Proxy):
Timeframe: 4-Hour (240 min)
Logic: Determines the price position by comparing the current Close price against the 4H EMA 50.
Output: BUY 🟢 (Close > EMA 50), SELL 🔴 (Close < EMA 50), or FLAT ⏸️ (Close = EMA 50).
4H RSI (14):
Timeframe: 4-Hour (240 min)
Logic: Momentum check comparing the 14-period Relative Strength Index (RSI) value against the 50 level.
Output: BUY 🟢 (RSI > 50), SELL 🔴 (RSI < 50), or FLAT ⏸️ (RSI = 50).

ACE SqueezeACE Squeeze - Advanced Momentum Oscillator with Squeeze Detection
WHAT IT DOES
This is my take on a squeeze momentum indicator that I've been refining over time. At its core, it detects periods when volatility contracts (the squeeze) and measures momentum direction when the market breaks out. Think of it like a coiled spring - when price compresses into a tight range, it often leads to explosive moves once it breaks free.
The indicator plots a histogram oscillator that ranges from -100 to +100, with several visual elements to help you gauge signal strength and market conditions.
KEY FEATURES
Market Regime Detection - The indicator automatically adjusts its sensitivity based on whether the market is trending, ranging, choppy, or volatile. This helps reduce false signals in different market environments.
Hilbert Transform - Uses advanced cycle detection to identify the dominant market rhythm. You can toggle this on/off if you prefer the simpler calculation method.
Volume Analysis - Incorporates volume delta and footprint analysis to confirm momentum signals. Strong moves with volume confirmation get priority.
Statistical Filtering - Filters out low-quality signals by analyzing signal persistence and deviation from the mean. This helps focus on the high-probability setups.
Visual Enhancements - Three-tier glow system shows building momentum, heat maps at extreme levels, and cycle phase indicator to track market rhythm.
HOW TO USE IT
The Squeeze - When you see the purple background, that's a squeeze condition. The market is compressing and building energy. Wait for the squeeze to release (background disappears) and watch which direction the histogram breaks.
Histogram Direction - Green bars mean bullish momentum, red bars mean bearish momentum. The stronger the color and the larger the glow effect, the stronger the signal.
Zero Line - Think of this as the battleground. When the histogram crosses above zero with strong momentum, that's a buy signal. When it crosses below with conviction, that's a sell signal.
Extreme Levels - The +90/-90 zones are overbought/oversold areas. The heat map bands intensify as the signal reaches these extremes, warning you that a reversal or consolidation might be coming.
Signal Quality - The indicator has built-in quality filtering. The alerts are set to only fire when signal quality is high (above 70-80%), which helps avoid the junk trades.
BEST PRACTICES
Don't trade every signal. Wait for the high-quality setups where multiple factors align - squeeze release, strong momentum, volume confirmation, and good signal quality.
Use higher timeframes for confirmation. A squeeze on the 1-hour chart hitting at the same time as the daily chart is much more powerful than isolated signals.
Pay attention to the cycle phase line. When momentum aligns with the cycle direction, the move tends to have more follow-through.
The glow effects are your friend. When you see the tier 3 extreme glow, the market is really moving - consider trailing stops or scaling out.
PROS
Highly customizable - You can adjust almost everything from sensitivity to visual appearance.
Multi-faceted analysis - Combines volatility, momentum, volume, and cycle analysis in one indicator.
Smart filtering - The regime detection and statistical filtering help adapt to different market conditions.
Visual clarity - The glow effects and color gradients make it easy to see signal strength at a glance.
Good alert system - Alerts are filtered for quality, so you're not getting pinged on every minor wiggle.
CONS
Can be complex for beginners - There are a lot of settings and concepts to understand. Start with defaults and adjust gradually.
Lags on fast markets - Like any indicator, it's based on past data. In extremely fast-moving markets, you might get late entries.
Works best in volatile markets - In super tight, low-volatility ranges, you might see fewer signals. That's by design, but it means patience is required.
Computational load - With all the enhancements turned on, it's doing a lot of calculations. On lower-end devices, you might notice some lag.
Not a holy grail - No indicator is. This is a tool to help you make better decisions, not a replacement for proper risk management and trading discipline.
SETTINGS BREAKDOWN
Core Settings - Adjust the base cycle length (10 is good for most timeframes) and sensitivity (0.65 is balanced, lower for fewer signals, higher for more).
Enhancement Settings - Toggle the advanced features. If you're getting too many signals, try turning off RRED. If you want cleaner signals, keep statistical filtering on.
Visual Settings - Customize the appearance. The glow effects look cool but you can disable them if you prefer a cleaner chart.
Elite Settings - Market regime detection is powerful but you can disable it if you want consistent behavior across all market conditions.
TIPS FROM MY TESTING
The indicator shines best on the 15-minute to 4-hour timeframes. It works on lower timeframes but expect more noise.
Use it alongside support/resistance or supply/demand zones. When a squeeze fires near a key level, the probability increases significantly.
Don't ignore the small signals in trending markets. Sometimes the modest +30 to +40 readings in a strong uptrend are your best continuation entries.
The squeeze can last longer than you expect. Don't try to predict when it will fire - let the indicator tell you.
This indicator represents a lot of testing and refinement. It's not perfect, but it's been useful in my trading. I hope it helps you spot better setups and avoid some of the false signals that plague simpler momentum indicators.

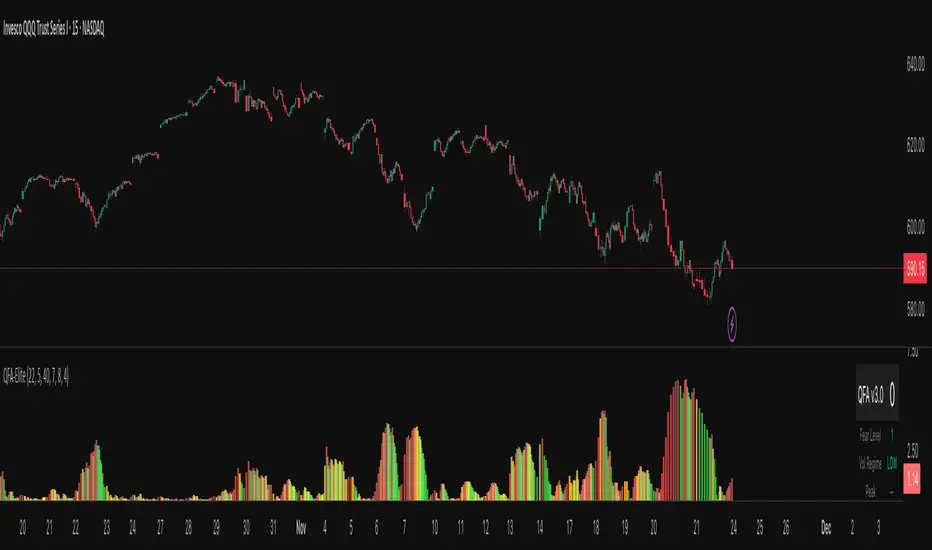
QFA Volatility MeterQFA Volatility Meter
This is a technical indicator I built to measure market fear and identify potential bottom reversal setups in liquid ETFs and stocks. It combines multiple technical factors into a single scoring system. This is a new indicator with limited real-world testing so treat it as experimental.
What It Actually Does
The indicator calculates a fear index based on how far price has dropped from the highest close over the past 14 bars. It then applies zero lag EMA smoothing with a 5-period setting to reduce noise. The fear reading gets adjusted based on ATR percentile rank with the theory being that high volatility drops should register as more significant than low volatility drops.
On top of this base fear calculation, the indicator checks for five additional factors: momentum peaks where fear stops accelerating upward, RSI divergence using a 7-period RSI, support levels that have been tested multiple times in the past 50 bars, volume patterns including spikes and rejection wicks, and point of control using a 30-bar volume profile calculation. Each factor that triggers adds points to a score from 0 to 100.
The histogram bars change color based on whether fear is rising or falling. Red means fear is increasing, green means decreasing. Gold colors appear when the score crosses certain thresholds: bright gold for scores above 40, orange for scores above 30, pale gold for scores above 20. There is a table in the upper right showing the current score, raw fear level, volatility regime, and which components are active.
The Core Problem You Need To Know
This indicator has a fundamental lag issue that I have not yet solved. Because it measures price drops over a 14 bar lookback period, it is calculating what already happened rather than what is happening right now. During fast selloffs you will often see the fear level reading very low like 5 or 10 even though price is clearly crashing in real time. The reading catches up eventually but by then you have missed the entry by 10 to 20 bars.
I attempted to fix this with ATR normalization and faster smoothing but the lookback period remains the main bottleneck. The indicator works better at identifying areas where fear has already peaked and is starting to decline than at catching the exact moment of peak fear. This makes it more useful for confirmation than for timing entries.
What Works
The multi-component scoring system does a decent job of filtering out low quality setups. When you get a high score above 50 or 60 with multiple components firing like divergence plus support plus volume, those tend to be legitimate reversal zones worth paying attention to. The color coding is intuitive and easy to read at a glance. The real-time table helps you understand what is triggering without having to decode the chart.
The volume climax detection catches some extreme bottoms where you see three or more bars of increasing volume combined with panic selling. These can mark capitulation points. The multi-touch support logic does add value by distinguishing between random price levels and actual tested support zones.
The indicator handles changes in volatility reasonably well. During low volatility periods it lowers the threshold so you still get some signals. During high volatility it raises the threshold to filter noise. This dynamic adjustment is better than using a fixed threshold across all market conditions.
What Does Not Work
The lag issue means you will frequently see obvious selloffs where the indicator shows nothing. Fear level of 5 during a 3 percent drop is not useful information. This happens because the lookback window is too long and the smoothing further delays the reading.
The gold signals that are supposed to mark high conviction bottoms often do not trigger when you expect them to. Looking at recent price action you can point to clear bottoms where the indicator stayed gray or showed low scores. This is partly the lag and partly because the scoring system requires multiple components to align which does not always happen at actual bottoms.
The indicator has only been tested on 15 minute QQQ charts during a few weeks of data. I do not know how it performs on other timeframes, other instruments, or during different market regimes like strong trends versus ranges. It may work very differently on individual stocks versus ETFs or on 5 minute versus 1 hour charts.
There is no formal backtest data showing win rate, average gain, maximum drawdown, or any other performance metrics. The scoring thresholds and component weights were set based on visual inspection and intuition rather than systematic optimization. They might be completely wrong.
Real Risks If You Use This
If you trade based on gold signals alone you will get caught in falling knives. The indicator does not know the difference between a normal pullback in an uptrend versus a breakdown that keeps going. You need your own analysis of market structure, key levels, and trend direction.
The lag means you will often be late to entries. By the time a gold signal appears price may have already bounced 1 to 2 percent off the low. This eats into your risk reward ratio. You might be buying near resistance when you think you are buying near support.
False signals happen regularly especially during choppy sideways action. You will see early and building signals that never develop into actual reversals. If you take every signal you will get chopped up.
The indicator can give conflicting information where the histogram shows green bars indicating fear is falling but the score is still low. Or red bars with a high score. This happens because color tracks momentum direction while score tracks absolute conditions. It is confusing in real time.
The volume profile calculations reset every 30 bars so the POC level jumps around. This can cause the POC component to trigger at seemingly random times. The value area high and low have similar issues.
Honest Pros and Cons
Pros: Combines multiple factors instead of relying on one signal. Color coded for quick visual assessment. Shows component breakdown so you understand why score is high or low. Includes volatility regime context. Free and customizable. Works in TradingView.
Cons: Significant lag during fast moves. No proven track record or backtest results. Complex with many moving parts that can conflict. Requires additional analysis to use effectively. Will produce false signals and missed opportunities. Thresholds and weights are arbitrary. Only tested on limited data.
How Someone Might Actually Use This
If you wanted to use this indicator despite its limitations here is a realistic approach. Keep it on your chart as one input among several. When price drops to a logical support level that you have identified independently, check if the indicator is showing elevated fear and building score. If fear level is above 60 and score is above 30 and you like the price action, that adds a bit of confirmation to your setup.
Do not take trades based solely on gold signals. Do not expect it to call exact bottoms. Do not use it in isolation. Think of it like a momentum oscillator that has some additional context baked in. It might help you avoid buying when there is no fear which means no panic to fade. But it will not tell you when to buy with any precision.
You would need to set your stop losses based on price structure not based on the indicator. Manage position size appropriately because this tool does not reduce risk. Keep records of which signals worked and which failed so you can learn its actual behavior rather than what you hope it does.
Settings Guidance
The default threshold of 40 seems reasonable for 15 minute charts in normal volatility. Going lower will increase signals but also increase noise. Going higher will reduce signals and may cause you to miss opportunities. I do not have data to recommend optimal settings.
The smoothing period of 5 is a compromise between responsiveness and stability. Lower numbers like 3 will be jumpier. Higher numbers like 7 will be smoother but slower. Again no data on what works best.
You can disable components if you want simpler scoring. For example if you only care about divergence and support you can turn off volume and POC. This will make scores lower overall but more focused on specific patterns.
Development Status
This indicator was built in a few hours as an experiment. It has not gone through rigorous testing or optimization. There are known issues that need fixing particularly the lag problem. I may continue developing it or I may abandon it. No guarantees on updates or support.
The code is provided as is. If you modify it or break it that is on you. The calculations could have bugs I have not found. The logic might be flawed in ways I have not realized.
Bottom Line
This is an experimental multi-factor fear indicator with significant limitations including lag, untested performance, and complexity. It might provide some useful context when combined with solid price action analysis and risk management. It will not make you money by itself. It will produce false signals and miss real opportunities. Use it as supplementary information at best and do not rely on it for trading decisions without your own analysis. If you use it, track results carefully and be skeptical of what it tells you until you have proven to yourself that it adds value to your process.
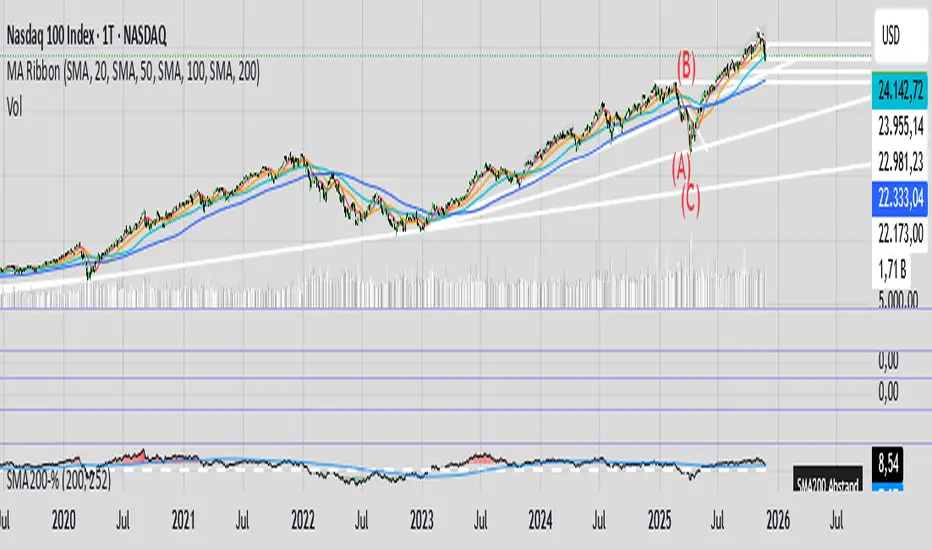
200SMA Distance OscillatorThe oscillator measures the percentage deviation of closing price x from SMA200.
The idea behind the oscillator was preceded by an analysis of how often MAs in the index hold/bounce or are broken through.
Basically, the idea was about index analysis, i.e., the macro picture of a market.
Who wants to buy individual stocks when the overall market is plummeting ;-)
Or in other words: How long are you long in a market? When is it time to take profits?
After the analysis of the stability of SMAs in the index was rather modest (ratio of just under 6:4 for bounce to breakout – overall in 20, 50, 100, and 200 frames from 2020 to 2025), it was noticeable that the percentage over- or underperformance was scalable, especially in indices.
And since indices generally move upwards, there were fixed limits for over- and underestimations – especially in the longer term (SMA200) – unlike with individual stocks.
It is therefore more a question of macro trends and less of short-term movements, e.g., in day trading.
It was now interesting to see at what percentage range counter-movements were likely – particularly in the positive range for profit-taking, but of course also in the negative range for entry into sold-off markets.
If, for example, closing prices around +25% above SMA200 were reached in the NDX, the probability is very high that the market has overreacted and an interim correction will follow – so the theory goes.
On the other hand, continuous levels of +5 to +10% are a product of healthy positive development in a bull market and do not necessarily require action.
The oscillator was specifically designed for the NDX, but can also be used for the SPX and others.
The style was based on the RSI, so that the color level rises from 10% to 20% (overbought/oversold principle).
Based on manually examined movements, the criteria were set as follows:
+/-10% = flow / no color background
> +/-10% = border areas / color background
The center line represents the 252 average of the percentage deviations and could also be used as a trigger, provided it has been historically examined and is valid.
The oscillator is very interesting because it behaves completely differently from one financial instrument to another and, as a result, also in the timeframes (4h, D, W).
It would probably make sense to change the flow and border levels in the code when using it outside of indices.
The fact is that the oscillator must be “adjusted” to each instrument in order to achieve its goal of providing the best possible prediction. “Adjusting” refers to the analysis of the levels at which an instrument/asset usually reacts.
As with all indicators and oscillators, it is advisable to take other indicators and, in particular, macro news into account when analyzing this development.
If I find any substantial correlations with other indicators, I will be happy to provide an update.
The idea came from me, the code from Grok.
The code is not 100% perfect, but the data (percentage deviation, color background) is correct according to initial analysis.
In the settings, you can make the lines of the plots invisible. This makes the oscillator clearer. You can also adjust the settings for the average line.
Flux-Tensor Singularity [FTS]Flux-Tensor Singularity - Multi-Factor Market Pressure Indicator
The Flux-Tensor Singularity (FTS) is an advanced multi-factor oscillator that combines volume analysis, momentum tracking, and volatility-weighted normalization to identify critical market inflection points. Unlike traditional single-factor indicators, FTS synthesizes price velocity, volume mass, and volatility context into a unified framework that adapts to changing market regimes.
This indicator identifies extreme market conditions (termed "singularities") where multiple confirming factors converge, then uses a sophisticated scoring system to determine directional bias. It is designed for traders seeking high-probability setups with built-in confluence requirements.
THEORETICAL FOUNDATION
The indicator is built on the premise that market time is not constant - different market conditions contain varying levels of information density. A 1-minute bar during a major news event contains far more actionable information than a 1-minute bar during overnight low-volume trading. Traditional indicators treat all bars equally; FTS does not.
The theoretical framework draws conceptual parallels to physics (purely as a mental model, not literal physics):
Volume as Mass: Large volume represents significant market participation and "weight" behind price moves. Just as massive objects have stronger gravitational effects, high-volume moves carry more significance.
Price Change as Velocity: The rate of price movement through price space represents momentum and directional force.
Volatility as Time Dilation: When volatility is high relative to its historical norm, the "information density" of each bar increases. The indicator weights these periods more heavily, similar to how time dilates near massive objects in physics.
This is a pedagogical metaphor to create a coherent mental model - the underlying mathematics are standard financial calculations combined in a novel way.
MATHEMATICAL FRAMEWORK
The indicator calculates a composite singularity value through four distinct steps:
Step 1: Raw Singularity Calculation
S_raw = (ΔP × V) × γ²
Where:
ΔP = Price Velocity = close - close
V = Volume Mass = log(volume + 1)
γ² = Time Dilation Factor = (ATR_local / ATR_global)²
Volume Transformation: Volume is log-transformed because raw volume can have extreme outliers (10x-100x normal). The logarithm compresses these spikes while preserving their significance. This is standard practice in volume analysis.
Volatility Weighting: The ratio of short-term ATR (5 periods) to long-term ATR (user-defined lookback) is squared to create a volatility amplification factor. When local volatility exceeds global volatility, this ratio increases, amplifying the raw singularity value. This makes the indicator regime-aware.
Step 2: Normalization
The raw singularity values are normalized to a 0-100 scale using a stochastic-style calculation:
S_normalized = ((S_raw - S_min) / (S_max - S_min)) × 100
Where S_min and S_max are the lowest and highest raw singularity values over the lookback period.
Step 3: Epsilon Compression
S_compressed = 50 + ((S_normalized - 50) / ε)
This is the critical innovation that makes the sensitivity control functional. By applying compression AFTER normalization, the epsilon parameter actually affects the final output:
ε < 1.0: Expands range (more signals)
ε = 1.0: No change (default)
ε > 1.0: Compresses toward 50 (fewer, higher-quality signals)
For example, with ε = 2.0, a normalized value of 90 becomes 70, making threshold breaches rarer and more significant.
Step 4: Smoothing
S_final = EMA(S_compressed, smoothing_period)
An exponential moving average removes high-frequency noise while preserving trend.
SIGNAL GENERATION LOGIC
When the tensor crosses above the upper threshold (default 90) or below the lower threshold (default 10), an extreme event is detected. However, the indicator does NOT immediately generate a buy or sell signal. Instead, it analyzes market context through a multi-factor scoring system:
Scoring Components:
Price Structure (+1 point): Current bar bullish/bearish
Momentum (+1 point): Price higher/lower than N bars ago
Trend Context (+2 points): Fast EMA above/below slow EMA (weighted heavier)
Acceleration (+1 point): Rate of change increasing/decreasing
Volume Multiplier (×1.5): If volume > average, multiply score
The highest score (bullish vs bearish) determines signal direction. This prevents the common indicator failure mode of "overbought can stay overbought" by requiring directional confirmation.
Signal Conditions:
A BUY signal requires:
Extreme event detection (tensor crosses threshold)
Bullish score > Bearish score
Price confirmation: Bullish candle (optional, user-controlled)
Volume confirmation: Volume > average (optional, user-controlled)
Momentum confirmation: Positive momentum (optional, user-controlled)
A SELL signal requires the inverse conditions.
INPUTS EXPLAINED - Core Parameters:
Global Horizon (Context): Default 20. Lookback period for normalization and volatility comparison. Higher values = smoother but less responsive. Lower values = more signals but potentially more noise.
Tensor Smoothing: Default 3. EMA period applied to final output. Removes "quantum foam" (high-frequency noise). Range 1-20.
Singularity Threshold: Default 90. Values above this (or below 100-threshold) trigger extreme event detection. Higher = rarer, stronger signals.
Signal Sensitivity (Epsilon): Default 1.0. Post-normalization compression factor. This is the key innovation - it actually works because it's applied AFTER normalization. Range 0.1-5.0.
Signal Interpreter Toggles:
Require Price Confirmation: Default ON. Only generates buy signals on bullish candles, sell signals on bearish candles. Reduces false signals but may delay entry.
Require Volume Confirmation: Default ON. Only signals when volume > average. Critical for stocks/crypto, less important for forex (unreliable volume data).
Use Momentum Filter: Default ON. Requires momentum agreement with signal direction. Prevents counter-trend signals.
Momentum Lookback: Default 5. Number of bars for momentum calculation. Shorter = more responsive, longer = trend-following bias.
Visual Controls:
Colors: Customizable colors for bullish flux, bearish flux, background, and event horizon.
Visual Transparency: Default 85. Master control for all visual elements (accretion disk, field lines, particles, etc.). Range 50-99. Signals and dashboard have separate controls.
Visibility Toggles: Individual on/off switches for:
Gravitational field lines (trend EMAs)
Field reversals (trend crossovers)
Accretion disk (background gradient)
Singularity diamonds (neutral extreme events)
Energy particles (volume bursts)
Event horizon flash (extreme event background)
Signal background flash
Signal Size: Tiny/Small/Normal triangle size
Signal Offsets: Separate controls for buy and sell signal vertical positioning (percentage of price)
Dashboard Settings:
Show Dashboard: Toggle on/off
Position: 9 placement options (all corners, centers, middles)
Text Size: Tiny/Small/Normal/Large
Background Transparency: 0-50, separate from visual transparency
VISUAL ELEMENTS EXPLAINED
1. Accretion Disk (Background Gradient):
A three-layer gradient background that intensifies as the tensor approaches extremes. The outer disk appears at any non-neutral reading, the inner disk activates above 70 or below 30, and the core layer appears above 85 or below 15. Color indicates direction (cyan = bullish, red = bearish). This provides instant visual feedback on market pressure intensity.
2. Gravitational Field Lines (EMAs):
Two trend-following EMAs (10 and 30 period) visualized as colored lines. These represent the "curvature" of market trend - when they diverge, trend is strong; when they converge, trend is weakening. Crossovers mark potential trend reversals.
3. Field Reversals (Circles):
Small circles appear when the fast EMA crosses the slow EMA, indicating a potential trend change. These are distinct from extreme events and appear at normal market structure shifts.
4. Singularity Diamonds:
Small diamond shapes appear when the tensor reaches extreme levels (>90 or <10) but doesn't meet the full signal criteria. These are "watch" events - extreme pressure exists but directional confirmation is lacking.
5. Energy Particles (Dots):
Tiny dots appear when volume exceeds 2× average, indicating significant participation. Color matches bar direction. These highlight genuine high-conviction moves versus low-volume drifts.
6. Event Horizon Flash:
A golden background flash appears the instant any extreme threshold is breached, before directional analysis. This alerts you to pay attention.
7. Signal Background Flash:
When a full buy/sell signal is confirmed, the background flashes cyan (buy) or red (sell). This is your primary alert that all conditions are met.
8. Signal Triangles:
The actual buy (▲) and sell (▼) markers. These only appear when ALL selected confirmation criteria are satisfied. Position is offset from bars to avoid overlap with other indicators.
DASHBOARD METRICS EXPLAINED
The dashboard displays real-time calculated values:
Event Density: Current tensor value (0-100). Above 90 or below 10 = critical. Icon changes: 🔥 (extreme high), ❄️ (extreme low), ○ (neutral).
Time Dilation (γ): Current volatility ratio squared. Values >2.0 indicate extreme volatility environments. >1.5 = elevated, >1.0 = above average. Icon: ⚡ (extreme), ⚠ (elevated), ○ (normal).
Mass (Vol): Log-transformed volume value. Compared to volume ratio (current/average). Icon: ● (>2× avg), ◐ (>1× avg), ○ (below avg).
Velocity (ΔP): Raw price change. Direction arrow indicates momentum direction. Shows the actual price delta value.
Bullish Flux: Current bullish context score. Displayed as both a bar chart (visual) and numeric value. Brighter when bullish score dominates.
Bearish Flux: Current bearish context score. Same visualization as bullish flux. These scores compete - the winner determines signal direction.
Field: Trend direction based on EMA relationship. "Repulsive" (uptrend), "Attractive" (downtrend), "Neutral" (ranging). Icon: ⬆⬇↔
State: Current market condition:
🚀 EJECTION: Buy signal active
💥 COLLAPSE: Sell signal active
⚠ CRITICAL: Extreme event, no directional confirmation
● STABLE: Normal market conditions
HOW TO USE THE INDICATOR
1. Wait for Extreme Events:
The indicator is designed to be selective. Don't trade every fluctuation - wait for tensor to reach >90 or <10. This alone is not a signal.
2. Check Context Scores:
Look at the Bullish Flux vs Bearish Flux in the dashboard. If scores are close (within 1-2 points), the market is indecisive - skip the trade.
3. Confirm with Signals:
Only act when a full triangle signal appears (▲ or ▼). This means ALL your selected confirmation criteria have been met.
4. Use with Price Structure:
Combine with support/resistance levels. A buy signal AT support is higher probability than a buy signal in the middle of nowhere.
5. Respect the Dashboard State:
When State shows "CRITICAL" (⚠), it means extreme pressure exists but direction is unclear. These are the most dangerous moments - wait for resolution.
6. Volume Matters:
Energy particles (dots) and the Mass metric tell you if institutions are participating. Signals without volume confirmation are lower probability.
MARKET AND TIMEFRAME RECOMMENDATIONS
Scalping (1m-5m):
Lookback: 10-14
Smoothing: 5-7
Threshold: 85
Epsilon: 0.5-0.7
Note: Expect more noise. Confirm with Level 2 data. Best on highly liquid instruments.
Intraday (15m-1h):
Lookback: 20-30 (default settings work well)
Smoothing: 3-5
Threshold: 90
Epsilon: 1.0
Note: Sweet spot for the indicator. High win rate on liquid stocks, forex majors, and crypto.
Swing Trading (4h-1D):
Lookback: 30-50
Smoothing: 3
Threshold: 90-95
Epsilon: 1.5-2.0
Note: Signals are rare but high conviction. Combine with higher timeframe trend analysis.
Position Trading (1D-1W):
Lookback: 50-100
Smoothing: 5-7
Threshold: 95
Epsilon: 2.0-3.0
Note: Extremely rare signals. Only trade the most extreme events. Expect massive moves.
Market-Specific Settings:
Forex (EUR/USD, GBP/USD, etc.):
Volume data is unreliable (spot forex has no centralized volume)
Disable "Require Volume Confirmation"
Focus on momentum and trend filters
News events create extreme singularities
Best on 15m-1h timeframes
Stocks (High-Volume Equities):
Volume confirmation is CRITICAL - keep it ON
Works excellently on AAPL, TSLA, SPY, etc.
Morning session (9:30-11:00 ET) shows highest event density
Earnings announcements create guaranteed extreme events
Best on 5m-1h for day trading, 1D for swing trading
Crypto (BTC, ETH, major alts):
Reduce threshold to 85 (crypto has constant high volatility)
Volume spikes are THE primary signal - keep volume confirmation ON
Works exceptionally well due to 24/7 trading and high volatility
Epsilon can be reduced to 0.7-0.8 for more signals
Best on 15m-4h timeframes
Commodities (Gold, Oil, etc.):
Gold responds to macro events (Fed announcements, geopolitical events)
Oil responds to supply shocks
Use daily timeframe minimum
Increase lookback to 50+
These are slow-moving markets - be patient
Indices (SPX, NDX, etc.):
Institutional volume matters - keep volume confirmation ON
Opening hour (9:30-10:30 ET) = highest singularity probability
Strong correlation with VIX - high VIX = more extreme events
Best on 15m-1h for day trading
WHAT MAKES THIS INDICATOR UNIQUE
1. Post-Normalization Sensitivity Control:
Unlike most oscillators where sensitivity controls don't actually work (they're applied before normalization, which then rescales everything), FTS applies epsilon compression AFTER normalization. This means the sensitivity parameter genuinely affects signal frequency. This is a novel implementation not found in standard oscillators.
2. Multi-Factor Confluence Requirement:
The indicator doesn't just detect "overbought" or "oversold" - it detects extreme conditions AND THEN analyzes context through five separate factors (price structure, momentum, trend, acceleration, volume). Most indicators are single-factor; FTS requires confluence.
3. Volatility-Weighted Normalization:
By squaring the ATR ratio (local/global), the indicator adapts to changing market regimes. A 1% move in a low-volatility environment is treated differently than a 1% move in a high-volatility environment. Traditional indicators treat all moves equally regardless of context.
4. Volume Integration at the Core:
Volume isn't an afterthought or optional filter - it's baked into the fundamental equation as "mass." The log transformation handles outliers elegantly while preserving significance. Most price-based indicators completely ignore volume.
5. Adaptive Scoring System:
Rather than fixed buy/sell rules ("RSI >70 = sell"), FTS uses competitive scoring where bullish and bearish evidence compete. The winner determines direction. This solves the classic problem of "overbought markets can stay overbought during strong uptrends."
6. Comprehensive Visual Feedback:
The multi-layer visualization system (accretion disk, field lines, particles, flashes) provides instant intuitive feedback on market state without requiring dashboard reading. You can see pressure building before extreme thresholds are hit.
7. Separate Extreme Detection and Signal Generation:
"Singularity diamonds" show extreme events that don't meet full criteria, while "signal triangles" only appear when ALL conditions are met. This distinction helps traders understand when pressure exists versus when it's actionable.
COMPARISON TO EXISTING INDICATORS
vs. RSI/Stochastic:
These normalize price relative to recent range. FTS normalizes (price change × log volume × volatility ratio) - a composite metric, not just price position.
vs. Chaikin Money Flow:
CMF combines price and volume but lacks volatility context and doesn't use adaptive normalization or post-normalization compression.
vs. Bollinger Bands + Volume:
Bollinger Bands show volatility but don't integrate volume or create a unified oscillator. They're separate components, not synthesized.
vs. MACD:
MACD is pure momentum. FTS combines momentum with volume weighting and volatility context, plus provides a normalized 0-100 scale.
The specific combination of log-volume weighting, squared volatility amplification, post-normalization epsilon compression, and multi-factor directional scoring is unique to this indicator.
LIMITATIONS AND PROPER DISCLOSURE
Not a Holy Grail:
No indicator is perfect. This tool identifies high-probability setups but cannot predict the future. Losses will occur. Use proper risk management.
Requires Confirmation:
Best used in conjunction with price action analysis, support/resistance levels, and higher timeframe trend. Don't trade signals blindly.
Volume Data Dependency:
On forex (spot) and some low-volume instruments, volume data is unreliable or tick-volume only. Disable volume confirmation in these cases.
Lagging Components:
The EMA smoothing and trend filters are inherently lagging. In extremely fast moves, signals may appear after the initial thrust.
Extreme Event Rarity:
With conservative settings (high threshold, high epsilon), signals can be rare. This is by design - quality over quantity. If you need more frequent signals, reduce threshold to 85 and epsilon to 0.7.
Not Financial Advice:
This indicator is an analytical tool. All trading decisions and their consequences are solely your responsibility. Past performance does not guarantee future results.
BEST PRACTICES
Don't trade every singularity - wait for context confirmation
Higher timeframes = higher reliability
Combine with support/resistance for entry refinement
Volume confirmation is CRITICAL for stocks/crypto (toggle off only for forex)
During major news events, singularities are inevitable but direction may be uncertain - use wider stops
When bullish and bearish flux scores are close, skip the trade
Test settings on your specific instrument/timeframe before live trading
Use the dashboard actively - it contains critical diagnostic information
Taking you to school. — Dskyz, Trade with insight. Trade with anticipation.

Digital Credit Market ValueDigital Credit Frontier
Script for tracking total notional value and total market value for the Digital Credit Market. Needs be manually updated. You can open it twice to get the total value in one pane and the oscillator in the other pane.
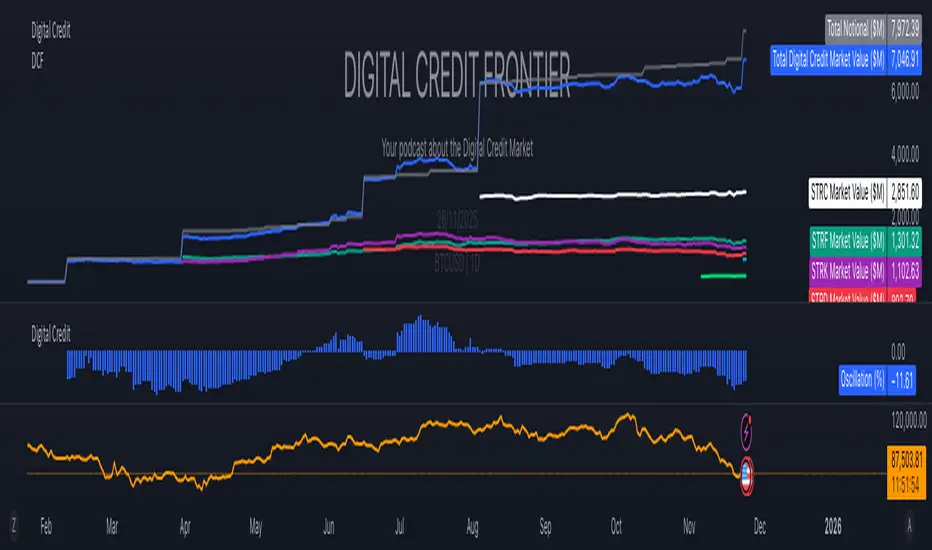
Amiya's Nifty 50 Doji Buy Sell IndicatorDoji Candle to be identified and coloured as Yellow.
Only such Doji candle is to be coloured as yellow, that fulfils the following criteria and both conditions must be met simultaneously
1. The candle's total range (high - low) must be greater than 10 points AND less than 21.5 points.
2. The combined length of upper and lower shadows must be at least 2 times the body size. This means the body should be relatively small compared to the shadows.
The key characteristic is that the body is small relative to the total candle range, indicating indecision in the market, with the total candle size being within a specific point range (10-21.5 points) - likely designed for index trading like NIFTY or BANKNIFTY.
Long Entry alert to be given when both the below conditions are met simultaneously:
1. When LTP crosses above the high of the Doji Candle
2. RSI is > 60
Long Entry SL should be when LTP goes 2 points below the low of the Doji Candle. Draw a red dotted line at that level.
Long Entry Take Profit level should be the ( Long Entry price + Doji candle's total range (high - low) X 5). Draw a green dotted line at that level.
For Sort entry alert, to be given when both the below conditions are met simultaneously:
1. When LTP crosses below the low of the Doji Candle
2. RSI is < 40
Short Entry SL should be when LTP goes 2 points above the high of the Doji Candle. Draw a red dotted line at that level.
Long Entry Take Profit level should be the ( Short Entry price - Doji candle's total range (high - low) X 5). Draw a green dotted line at that level.
Universal Exit should be suggested at 3:25 PM.

Hishyar 1Buy/Sell Kesek o Sor
Indicator for short, intermediate, and long term trend analysis with entry and exit indicator.
Works on all INDICIES, FOREX, CRYPTO, STOCKS, BONDS etc.

True Market MeanTrue Market Mean (Optimized) - User Guide
📋 Overview
The True Market Mean (TMM) indicator is a sophisticated multi-timeframe market analysis tool that approximates the "true" market equilibrium price by combining perspectives from different market participants. It helps identify potential support/resistance levels and trend direction changes.
🎯 Concept
The TMM calculates a weighted average of four key market perspectives:
Realized Price - Long-term cost basis (350-period SMA)
Long-Term Holder Proxy - Very long-term perspective (1400-period EMA)
Short-Term Holder Proxy - Recent market activity (50-period WMA)
Momentum Proxy - Market sentiment and trend strength
⚙️ Input Parameters
Time Periods
Realized Price Period (350): Long-term cost basis calculation
Long-term Holder Period (1400): Very long-term market perspective
Short-term Holder Period (50): Recent price action
Momentum Period (200): Trend strength measurement
Weighting System
Base Weight Realized Price (0.35): Primary long-term anchor
Base Weight LTH (0.30): Long-term trend component
Base Weight STH (0.25): Short-term market activity
Base Weight Momentum (0.10): Trend strength influence
Features
Use Dynamic Weighting: Automatically adjusts weights based on market volatility
Show Information Table: Displays real-time data table
Show Alternative TMM: Shows secondary calculation method
📊 Interpretation
Primary Signals
Bullish Signal (Green Triangle ↑): Price crosses above TMM
Bearish Signal (Red Triangle ↓): Price crosses below TMM
Strong Signals: Solid colored triangles (strong conviction)
Weak Signals: Light colored triangles (weaker conviction)
Market States
Green Background: Price above TMM (bullish regime)
Red Background: Price below TMM (bearish regime)
Information Table
The table (top-right) shows:
Primary and Alternative TMM values
Current market status (BULLISH/BEARISH)
Price deviation from TMM (%)
TMM trend direction (RISING/FALLING)
Market volatility level (LOW/MEDIUM/HIGH)
🎨 Visual Elements
Lines
Orange Line: Primary TMM calculation
Purple Line: Alternative TMM calculation (if enabled)
Background
Light green: Bullish territory (price > TMM)
Light red: Bearish territory (price < TMM)
💡 Trading Applications
Trend Identification
Bullish Trend: Price consistently above rising TMM
Bearish Trend: Price consistently below falling TMM
Range-bound: Price oscillating around flat TMM
Support/Resistance
TMM often acts as dynamic support/resistance
Significant deviations from TMM may indicate overbought/oversold conditions
Entry/Exit Signals
Long Entry: Strong bullish signal with price above TMM
Short Entry: Strong bearish signal with price below TMM
Exit/Stop: Price crossing back below/above TMM
⚠️ Risk Management
Use TMM in conjunction with other indicators
Consider volatility levels when interpreting signals
Strong signals in high volatility may be more significant
Always use proper stop-losses
🔧 Customization Tips
For Day Trading
Reduce all periods (e.g., 50, 200, 20, 50)
Increase STH weight for more sensitivity
For Swing Trading
Use default periods
Balanced weights work well
For Long-term Investing
Increase LTH and Realized Price periods
Give more weight to long-term components
Volatility Adjustments
In high volatility markets, dynamic weighting automatically emphasizes momentum
In low volatility, long-term components dominate
📈 Performance Tips
Best Timeframes: 4H, Daily, Weekly for reliable signals
Asset Classes: Works well with stocks, crypto, forex
Market Conditions: Effective in both trending and ranging markets
Confirmation: Combine with volume analysis for stronger signals
🚀 Advanced Features
Dynamic Weighting
When enabled, the indicator automatically:
Increases momentum weight during high volatility
Emphasizes long-term components in stable markets
Adapts to changing market conditions
Alternative TMM
The purple line uses price deviation instead of momentum rate-of-change, providing:
Different sensitivity to market moves
Additional confirmation of primary signals
Alternative perspective on market equilibrium
❗❗❗ Limitations❗❗❗
Lagging indicator (based on moving averages)
Works best in conjunction with other tools
May give false signals during low-volume periods
Requires parameter optimization for different assets
🔄 Optimization
Experiment with:
Period lengths based on your trading style
Weight distributions for different market conditions
Enabling/disabling alternative TMM based on preference
Table display based on screen space

Dual MACD With Pilot Background + + Stoch RSI Alert HELL 2macd 1 chart time macd 2 4x chart time with over bought and over sold stoc rsi alerts
God Mode1m buy / sell indicator that uses timing, candlestick analysis, volume, trend, and volatility across multiple time frames. Best used on 1m but can be used on 3m/5m charts.
