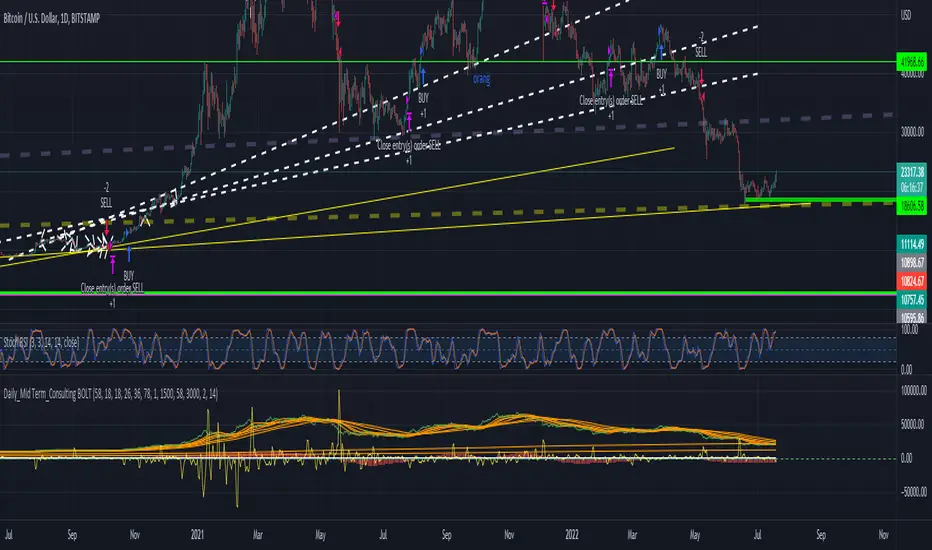
Daily_Mid Term_Consulting BOLTDaily Mid Term Consulting BOLT es una estrategia a mediano y largo plazo creada para detectar los cambios tendenciales en zonas de tiempo diarias. se basa en el análisis de los cambios porcentuales que sufre el precio contra las distintas medias móviles simples definidas en la estrategia. el uso de osciladores como el MACD , RSI y EFI apoyan la decisión de entrada a la estrategia.
actualmente esta en construcción la colocación de stop losses para aumentar la eectividad de la misma.
Oscillatori
Inverse MACD + DMI Scalping with Volatility Stop (By Coinrule)This script is focused on shorting during downtrends and utilises two strength based indicators to provide confluence that the start of a short-term downtrend has occurred - catching the opportunity as soon as possible.
This script can work well on coins you are planning to hodl for long-term and works especially well whilst using an automated bot that can execute your trades for you. It allows you to hedge your investment by allocating a % of your coins to trade with, whilst not risking your entire holding. This mitigates unrealised losses from hodling as it provides additional cash from the profits made. You can then choose to hodl this cash, or use it to reinvest when the market reaches attractive buying levels.
Alternatively, you can use this when trading contracts on futures markets where there is no need to already own the underlying asset prior to shorting it.
ENTRY
The trading system uses the Momentum Average Convergence Divergence (MACD) indicator and the Directional Movement Index (DMI) indicator to confirm when the best time is for selling. Combining these two indicators prevents trading during uptrends and reduces the likelihood of getting stuck in a market with low volatility.
The MACD is a trend following momentum indicator and provides identification of short-term trend direction. In this variation it utilises the 12-period as the fast and 26-period as the slow length EMAs, with signal smoothing set at 9.
The DMI indicates what way price is trending and compares prior lows and highs with two lines drawn between each - the positive directional movement line (+DI) and the negative directional movement line (-DI). The trend can be interpreted by comparing the two lines and what line is greater. When the negative DMI is greater than the positive DMI, there are more chances that the asset is trading in a sustained downtrend, and vice versa.
The system will enter trades when two conditions are met:
1) The MACD histogram turns bearish.
2) When the negative DMI is greater than the positive DMI.
EXIT
The strategy comes with a fixed take profit combined with a volatility stop, which acts as a trailing stop to adapt to the trend's strength. Depending on your long-term confidence in the asset, you can edit the fixed take profit to be more conservative or aggressive.
The position is closed when:
Take-Profit Exit: +8% price decrease from entry price.
OR
Stop-Loss Exit: Price crosses above the volatility stop.
In general, this approach suits medium to long term strategies. The backtesting for this strategy begins on 1 April 2022 to 18 July 2022 in order to demonstrate its results in a bear market. Back testing it further from the beginning of 2022 onwards further also produces good returns.
Pairs that produce very strong results include SOLUSDT on the 45m timeframe, MATICUSDT on the 2h timeframe, and AVAUSDT on the 1h timeframe. Generally, the back testing suggests that it works best on the 45m/1h timeframe across most pairs.
A trading fee of 0.1% is also taken into account and is aligned to the base fee applied on Binance.

Rajiv Patel Strategy with ATR RSI CCI MACD EMA IchimokuRajiv Patel Strategy with alerts helps to identify entry and exit levels based on following Indicators.
1. ATR Trailing Stoploss
2. RSI
3. CCI
4. MACD
5. EMA
6. SMA
7. Ichimoku
This Strategy is fully customizable as per your trading style. Below are some examples of how once can use the Strategy.
Options Based on Each Indicator Individually.
1. ATR Trailing Stoploss – When price is above ATR Trailing Stoploss line its in buy zone and when below its in sell zone. The setting of ATR Trailing Stoploss are customizable like ATR Periods and ATR Multiplier. Suggest increasing ATR Multiplier with lower timeframe. Aggressive buyers can decrease ATR Period in higher timeframe as per trade plan.
2. RSI – RSI above EMA Length is buy zone and below is sell zone. Conservative buyers can increase the RSI & EMA Length period while aggressive and reduce. Higher the timeframe gives better results.
3. CCI – Similar to RSI the buy zone is when CCI crosses above EMA Length. Again CCI & EMA Length can be customised as per trade plan. Higher timeframe is advised.
4. MACD – MACD parameters default settings are based on trying to get early entry. One can change to 26, 13 and 9 in lower timeframe. When MACD crosses above Signal line its buy zone and when below its sell zone.
5. EMA – 5 EMA lines and 2 SMA lines can be plotted. The settings of both EMA lines and SMA lines can be adjusted based on timeframe and trade plan.
6. EMA – EMA line 1 and 2 can be used as buy when EMA1 crosses above EMA2 and sell when below. The length of EMA1 & 2 is adjustable. Suggest modifying based on timeframe and trade plan.
7. SMA – SMA1 can also be used as solo indicator. If price is below SMA1 then its no buy area and if above, then in buy area. SMA2 can be used to identify if trend is upward or downward based on user settings.
8. Ichimoku – It predicts price movements bit like moving averages. Offers a unique perspective of support and resistance levels.
Conversion Line (Tenkan Sen)
- Measures Short Term Trend
- Signals an area of minor support and resistance
Base Line (Kijun Sen)
- Measures Medium term trend
- Used as Trailing Stop Level
Lagging Span (Chikou Span)
- Used for confirmation of signals
- Can also serve as Support and Resistance Level
Kumo Cloud
- Formed of two lines: Senkou Span A (Green Line) and Senkou Span B (Red Line)
- Dynamic Support and Resistance
HOW TO READ ICHIMOKU INDICATOR
Conversion Line (Tenkan Sen)
- If Price is above the Conversion Line = Short term upward movement
- If Price is below the Conversion Line = Short term downward movement
- Increasing Conversion Line = Short term uptrend
- Decreasing Conversion Line = Short term downtrend
Base Line (Kijun Sen)
- If Price is above the baseline = Medium term uptrend
- If the Market price is below the baseline = Medium term downtrend
- Increasing Base Line = Medium term uptrend
- Decreasing Base Line = Medium term downtrend
Lagging Span
- The Evolution of the current price action in relation to previous price action
- If the Lagging span is above the current price = Bullish Bias
- If the Lagging span is below the current price = Bearish Bias
- Lagging span near the current price = Trading range
Kumo Cloud
- Dynamic Support and Resistance based upon price action.
- The longer the price stays below/above the Kumo cloud, stronger the trend
- When the cloud is wide, the expected support or resistance is strong
- When the cloud is thin, the expected support or resistance is weak
- Never trade when price is inside Kumo Cloud
HOW TO TRADE WITH ICHIMOKU CLOUD
1. Baseline and conversion Line crossover (Lagging Span as a Filter)
crossover (conversion line, baseline) = Buy
crossunder (conversion line, baseline) = Sell
FILTER
Crossover (conversion line, baseline) and lagging span is Bullish (i.e above the price) = Buy
Crossunder (conversion line, baseline) and lagging span is Bearish (i.e below the price) = Sell
2. Baseline - Conversion line crossover (Kumo cloud Filter)
Crossover (conversion line, baseline) above the Kumo Cloud = Strong Buy
Crossover (conversion line, baseline) below the Kumo cloud = Weak Buy
Crossunder (conversion line, baseline) below the Kumo Cloud = Strong Sell
Crossunder (conversion line, baseline) above the Kumo Cloud = Weak Sell
3. Kumo Cloud Breakout
When the price enters the Kumo Cloud, and breaks its Upper wall upward = Bullish Signal
When the price enters the Kumo Cloud, and breaks its Lower wall downward = Bearish Signal
4. Kumo Cloud Crossover
When Span A crosses the Span B from below to the upside and prices are positioned above the Kumo Cloud = Strong Buy Signal
When Span A crosses the Span B from upside to the bottom and the prices are positioned below the Kumo Cloud = Strong Sell
When Span A crosses Span B from bottom to the upside and prices are positioned below the Kumo Cloud = Weak Buy Signal
When Span A crosses Span B from the upside to the bottom and the prices are positioned above the Kumo Cloud = Weak Sell Signal
Options Based on Combining Multiple Indicators.
One can select and combine multiple conditions based on above understanding of individual indicator to create a strong Long Entry, Short Entry, Long Exit and Short Exit. This Strategy also provides Alert signal for all entry and exit based on the combinations of conditions selected.
Since this is a strategy one can use STRATEGY TESTER to understand how the strategy has performed over the selected time span. This however does not guarantee similar results in present or future trades.
Please enter commission or total charges charged by your broker in “Properties” Tab of the strategy. Modify all parameters of “Properties” Tab as needed. Note, this can affect the performance results of the strategy.
Need to be very careful in selecting conditions as it becomes very complex with many options available.
Note:
Triangles at the top and bottom indicates the zone. Can be turned on / off using condition “Show Conditions Visually”.
1. Red triangle at top pointing down with ‘S’ indicates in Long Exit zone.
2. Red triangle at top pointing down with ‘EnS’ indicates in Enter Short zone.
3. Green triangle at bottom pointing up with ‘B’ indicates in Long Entry zone.
4. Green triangle at bottom pointing up with ‘ExS’ indicates in Exit Short zone.
5. When the is no triangle either at top or bottom means there is no zone.
Send me your suggestions, will try to incorporate the same in next revision.

TASC 2022.08 Trading The Fear Index█ OVERVIEW
TASC's August 2022 edition of Traders' Tips includes an article by Markos Katsanos titled "Trading The Fear Index". This script implements a trading strategy called the “daily long/short trading system for volatility ETFs” presented in this article.
█ CONCEPTS
This long-term strategy aims to capitalize on stock market volatility by using exchange-traded funds (ETFs or ETNs) linked to the VIX index.
The strategy rules (see below) are based on a combination of the movement of the Cboe VIX index, the readings of the stochastic oscillator applied to the SPY ETF relative to the VIX, and a custom indicator presented in the article and called the correlation trend . Thus, they are not based on the price movement of the traded ETF itself, but rather on the movement of the VIX and of the S&P 500 index. This allows the strategy to capture most of the spikes in volatility while profiting from the long-term time decay of the traded ETFs.
█ STRATEGY RULES
Long rules
Rising volatility: The VIX should rise by more than 50% in the last 6 days.
Trend: The correlation trend of the VIX should be 0.8 or higher and also higher than yesterday's value.
VIX-SPY relative position: The 25-day and 10-day VIX stochastics should be above the 25-day and 10-day SPY stochastics respectively. In addition, the 10-day stochastic of the VIX should be above its yesterday's value.
Long positions are closed if the 10-day stochastic of the SPY rises above the 10-day stochastic of the VIX or falls below the yesterday's value.
Short rules
Declining volatility: The VIX should drop over 20% in the last 6 days and should be down during the last 3 days.
VIX threshold: The VIX should spend less than 35% of time below 15.
VIX-SPY relative position: The 10-day VIX stochastic should be below the 10-day SPY stochastic. In addition, the 10-day SPY stochastic should be higher than the yesterday's value.
Long positions are closed if the first two Long rules are triggered (Rising volatility and Trend).
The script allows you to display the readings of the indicators used in the strategy rules in the form of oscillator time series (as in the preview chart) and/or in the form of a table.

Combo 2/20 EMA & Bull PowerThis is combo strategies for get a cumulative signal.
First strategy
This indicator plots 2/20 exponential moving average. For the Mov
Avg X 2/20 Indicator, the EMA bar will be painted when the Alert criteria is met.
Second strategy
Bull Power Indicator
To get more information please see "Bull And Bear Balance Indicator"
by Vadim Gimelfarb.
WARNING:
- For purpose educate only
- This script to change bars colors.

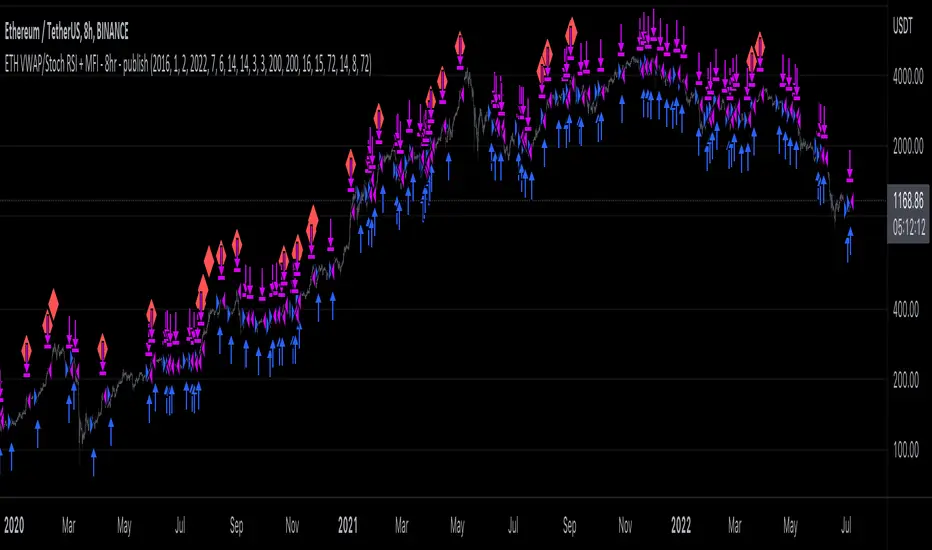
ETH long bot - 8hrThis is a high-latency algorithm, safely running on the Ethereum 8hr chart where it can execute trades on a multi-day timeframe, making it easy to enter and exit large positions and without incurring excessive commission fees.
As a long bot, this script should be ran in markets that are trending upwards. Nonetheless, the operator can be at ease knowing that the script can safely run autonomously during these extended periods. It is shown here performing full-time over a 46 month period, from January 2019 through October 2021, steadily increasing the available capital despite the asset's fluctuations. While the buy and hold return over this time was 714%, the algorithm produced a net profit 4,060%, outperforming the market by over 5.5x. This equates to a 40x return on investment in 4 years.
The strategy behind this algorithm is to always capitalize on significant jumps in the market. This is accomplished by using a simple combination of RSIs:
- One RSI uses VWAP as a source, which is primarily responsible for entering growth trends whenever they begin
- The other is a Stochastic RSI , which is primarily responsible for identifying exhausted periods of growth
These calculations are calibrated so that the bot can jump in and out of trades to improve its position when there isn't significant price action one way or the other, but is then able to remain in positions during uptrends that are backed by volume to achieve maximum gains. This strategy is reflected by the fact that while profitable trades are almost 3 times larger than losing trades, on average, they also last for an average of 6 days, whereas losing trades usually last about 2.
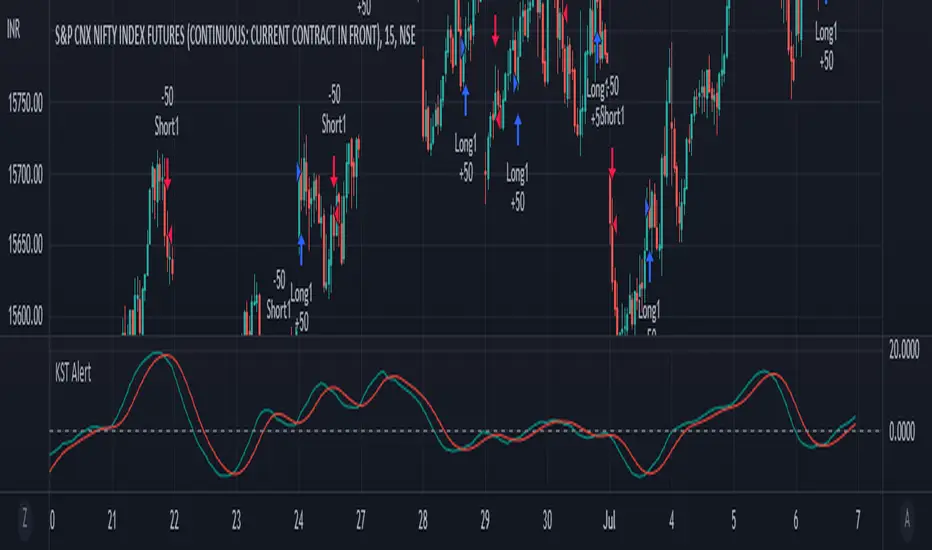
KST AlertJust added Alert condition to the default indicator
Default timeframe is set to 15m
Buy signal initiates when kst line crosses over signal line
Sell Signal initiates when kst line crosses under signal line
3ngine Global BoilerplateABOUT THE BOILERPLATE
This strategy is designed to bring consistency to your strategies. It includes a macro EMA filter for filtering out countertrend trades,
an ADX filter to help filter out chop, a session filter to filter out trades outside of desired timeframe, alert messages setup for automation,
laddering in/out of trades (up to 6 rungs), trailing take profit , and beautiful visuals for each entry. There are comments throughout the
strategy that provide further instructions on how to use the boilerplate strategy. This strategy uses `threengine_global_automation_library`
throughout and must be included at the top of the strategy using `import as bot`. This allows you to use dot notation
to access functions in the library - EX: `bot.orderCurrentlyExists(orderID)`.
HOW TO USE THIS STRATEGY
1. Add your inputs
There is a section dedicated for adding your own inputs near the top of the strategy, just above the boilerplate inputs
2. Add your calculations
If your strategy requires calculations, place them in the `Strategy Specific Calculations` section
3. Add your entry criteria
Add your criteria to strategySpecificLongConditions (this gets combined with boilerplate conditions in longConditionsMet)
Add your criteria to strategySpecificShortConditions (this gets combined with boilerplate conditions in shortConditionsMet)
Set your desired entry price (calculated on every bar unless stored as a static variable) to longEntryPrice and shortEntryPrice. ( This will be the FIRST ladder if using laddering capabilities. If you pick 1 for "Ladder In Rungs" this will be the only entry. )
4. Plot anything you want to overlay on the chart in addition to the boilerplate plots and labels. Included in boilerplate:
Average entry price
Stop loss
Trailing stop
Profit target
Ladder rungs

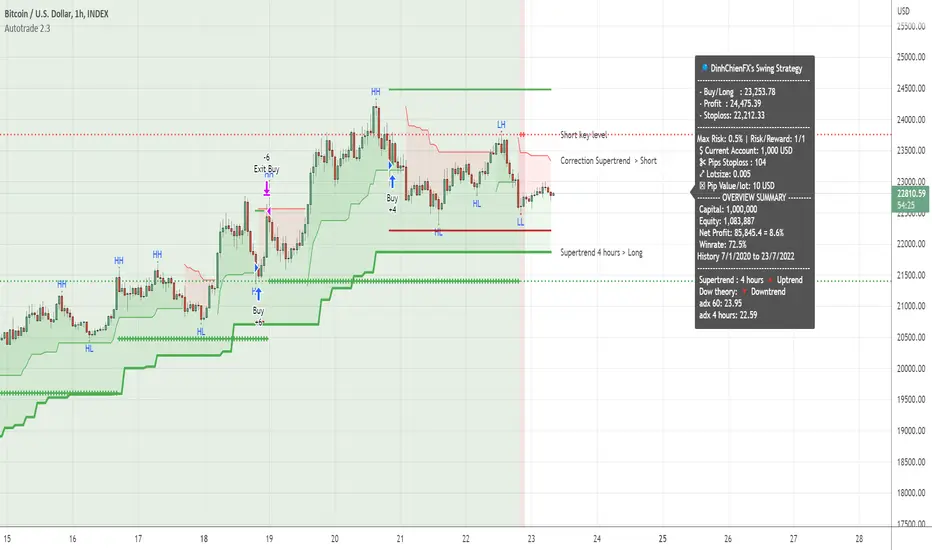
[Crypto] Autotrade 2.3* Commission: 0.06% = Binance future fee.
1. HIGH/LOW PIVOT:
- Pivot Left: 10
- Pivot Right: 10
Long trend identification:
- Higher High occurs after Higher Low.
Short trend identification:
- Lower Low occurs after Lower High.
2. ADX INDICATOR: 1h & 4h timeframe have a strong strength for open trade.
- ADX smoothing: 14.
- DI length: 14.
- ADX STRONG > 25.
3. SUPERTREND INDICATOR:
- Long trend when closes candle is above the green line.
- Short trend when closes candle is below the red line.
4. OPEN POSITION RULE:
- BUY/LONG: reject to Supertrend at current timeframe.
- SELL/SHORT: reject to Supertrend at current timeframe.
5. AUTOTRADE BINANCE FUTURE WITH MONEY MANAGERMENT: requires Pro, Pro +, Premium Tradingview & Webhook service.
6. BACKTEST RESULT:
- Deep backtest: 08 OCT 2010 - 3 JUL 2022:
- Backtest 129 Binance Future pairs: 78 pairs with winrate > 52% | 51 pairs with winrate < 52%
[Pt] Premarket Breakout StrategyThis is a 1 trade per day strategy for trading SPY or QQQ index. By default, this is designed for 1 min time frame. This was an experimental script that seems to be profitable at the time of publication.
How it works:
Pre-market high and low is defined per trading day between 9:00 to 9:30 EST.
Then we looking for the first breakout on either PM high or PM low.
- Breakout high = long trade
- Breakout low = short trade
If long trade, we wait until Stochastic RSI D signal line to hit a lower threshold (18 by default). Then we enter long when K crosses above D line.
If short trade, we wait until Stochastic RSI D signal line to hit an upper threshold (82 by default). Then we enter short when K crosses below D line.
Stop loss for long
- set to PM low if entry is above PM high + %ATR buffer
- or set to PM range + %ATR buffer
Stop loss for short
- set to PM high if entry is below PM low + %ATR buffer
- or set to PM range + %ATR buffer
Profit target is set to 2x the risk by default.
*Note: Different Stochastic RSI lengths should be used if trading 5 min time frame. See tooltip.
Happy trading~~!

Crypto_Troll_Turtle_StrategyTurtle Strategy for high marketcap cryptocurrencies
I'm glad to launch my strategy which is based on
moving averages / bollinger bands / RSI and volume
It's basically made for scalping with an interesting return over the last two years and a perspectively low drawdown
if you're interested in the strategy and you want to use it for futures trading you can contact me for a money & risk management rules that you can use and prevent you from a huge loss !! it's for free don't worry xD you can find my contact in the author's instructions' label
The optimal timeframe to use is 1H
I'll be trying to launch telegram signals for this strategy as soon as possible for the following pairs: BTCUSDT ETHUSDT BNBUSDT timeframe: 1H
I'm open to all reviews ! thanks !

Fib and RSI Strategy PineconnectorUse on 1m only For best results
strategy check for RSI overbought or oversold when key Fib levels are hit
Optimisez to use with Pineconnector using alerts with {{strategy.order.alert_message}}
Feel free to comment or DM if you want to improve
Enjoy

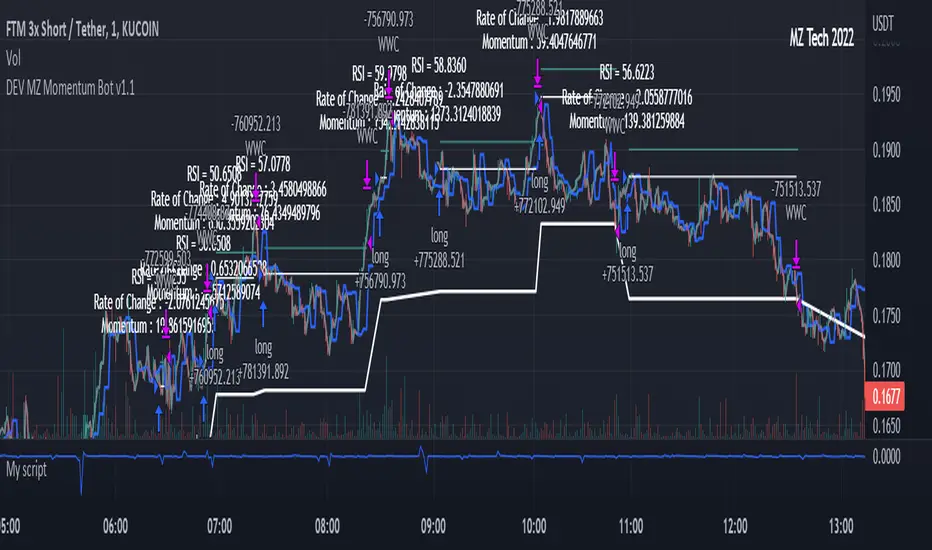
MZ HTF HFT ROCit Bot - Non Repainting Scalper v1.2 ADX RSI MOM This is a new iteration based on my Momentum trading bot.
This is an original script meant to be a high frequency trader that works on higher time frame calculations.
I came up with the idea that using calculus I can figure out the actual rate of change and momentum with different calculations than the momentum indicator that is provided by trading view. Once momentum is shifted on a small time frame, it will provide an entry signal. The script is meant to be used on an algorithmic trading system for scalping purposes. It should be run on a one minute time frame. Unfortunately due to various plotting constraints in Pinescript, you cannot plot the rate of change and momentum and price in the same pane. To counter this, I have a showdata toggle to give you values of the indicators at each entry.
This version has two main entry settings toggled with a checkbox. There is the ROC (rate of change) version and the MOM (momentum) entry signals.
The rate of change version is meant to take a look at your moving average and try to trigger when it hits a certain rate of change point. This can be helpful if you rather play it safer. I have noticed that you can get slightly better entry points but also does not give you as many entries. The momentum algorithm will give you faster entry points and might work best with a slight offset (use your back test to help you figure it out).
I have started to add tooltips to help you along. If you have suggestions please let me know.
How does it work?
Let's just assume that you are looking at a one minute chart. I recommend using the one minute for bots because it will give you the fastest execution for entries. Pinescript has an issue where the signal is not usually sent until the end of the bar/beginning of next bar. If the signal was triggered at the beginning of a 15 minute bar, it might not actually send the signal until the following 15 minute bar. If you are trading on small time frames, this can make all the difference. If you are using an algo platform that trailing stops, stop losse, take profits, etc. I would recommend you use that platform to close your trade. The close trade message will work, but pinescript does not know the exact entry price you received, so if you are trying to collect small profits, it is best that intermediary platform does that calculation for you. If you are dealing with larger moves, instead of small 1-3% scalps, you are probably fine to use the close message setting from pinescript.
Ok, so to take an example. I like to use the 3L and 3S tokens on Kucoin. This gives you a lot of volatility to work with compared to other tokens and coins. However, it can also meas that you are likely taking a higher risk. However, there are some things that can help with that (more on that later).
So we have a token we want to run, and have it on the 1m chart.
First, be sure that all of your filters are OFF when you start playing with the back test. This allows you to see how to best optimize the bot.
Use the show data to show you additional data when you are backtesting. This can allow you to try to filter out results or market conditions that do not work. I typically work with the RSI and use the 30 minute and 15 minute RSIs. I make sure that it is trading within a certain band - about 40-75. You can try the inverse and only buy during really low RSI's as well.
www.dropbox.com
Find the source of your data with the variant drop down. You can use any time frame, open, close. high, low, olc4. Open is pretty much guaranteed to not have any repainting issues - although all the other calcs use a custom isbarconfirmed security repaint calculation. I have been finding that Open and SMA work well, but feel free to explore. If you use a source like open, close, high, low, etc - the interval will not change anything further. If you use a variant such as an sma, you should try to find an interval that works well for that token. For instance, try an sma of 8-11 minutes and see which gives you the best backtest result without changing anything else. Offset ALMA/LSMA parameters are only used for those specific variants. These specific parameters will also affect the ALMA and LSMA if you use that variant in the trend filter. In other words, you can skip these if you are not using those types of moving averages.
www.dropbox.com
Configure the ROC and MOM intervals. If you are using a source such as open, close, etc- this is where you set the interval for your change. So consider using OHLC4 or a interval of 5 thru 15 and see what works best. The Momentum inverval usually works best in the 2-5 bars. There is a custom calculation I added in to try to filter out false entries as momentum is waning. This calculation works best in 2-5 bar interval.
Configure the trigger point and offset. If you are using rate of change, the best settings will likely be between -1 to 0.5. If you are using momentum, you will likely want -20 to 10. This is where you will notice the entries will shift a bit. Try to find a balance between your backtest settings and actually finding what you thin will be the best entries based on a slight delay from trading view, to algo, to your trading platform. This can likely be a minute (maybe even) or so- so be sure to not get too caught up between the backtest results and be sure to finesse the entries to actually fit nicely - maybe a bar earlier than you would likely think. If your entries are coming in too early, you can use the offset to delay your entry by a few bars. This is both science and an art form- don't get too caught up on the back test results as that is based on having all the data tha already transpired, it's not based on how it will actually perform during deployment.
Take profit and stop loss. This should be self explanatory. This script can toggle between static take profit and a trailing profit. For scalping, you will likely want to limit it below 2% to get a good win ratio. Stop loss should be at least 5-6% for these types of 3L/3S tokens to give the strategy some room to move (if the token goes down 2% before it shoots back up, the price will go down 6%). This does not yield the best R/R ratio from a traditional trader perspective, but the statistical probabilities are in your favor for these events will happen. If you have better ideas for how to set this all up, feel free to contribute your ideas in the comments as we can all learn from each other. You can definitely set a much tighter stop loss with a larger take profit to get a lower win rate but in turn might get much better returns. It's all up to you.
FILTERS www.dropbox.com
These filters require you to know a bit about each indicator and how you want to use them. I will only go over the general idea.
Variant Filter - this is especially useful if you want to trade above a moving average. Say for instance you only want to take trades when we are over the 100 Day moving average. Or above a 30 minute, 30 bar EMA, etc. Although originally ported over from my other scripts, this is not a filter that I use often in conjunction with this script.
RSI - perhaps you want to buy when we are below the 30 line on the 30 minute RSI, or we want only want to have the strategy work when we are above the 50 RSI, this can all be configured here. I typically like to try a few different rationales here.
Now with brand NEW ADX filter - this is a brand new idea that seems to work rather well. Based on your ADX settings you can also turn on the "only uptrend" which will try to calculate if you are in an uptrend based on your ADX config. Please keep in mind that uptrend is based relatively on the ADX settings.
- There is a sprinkle of RSI magic in the entry signal to make sure that rsi is not declining in the calculation, so this can affect how many entries you get.
Some other tips:
Forward test.
Set up your algo bot on a one minute interval.
Set up take profit and stop loss on your algo trading platform.
Don't use the exact settings as your backtest, maybe try a slightly more conservative approach from the algo trading platform to make sure you are within range of triggering your events with a slight delay from signal to execution. If you have a 1.6% take profit, perhaps try 1.5% on your platform first.
By using these scripts you agree that you are trading at your own risk. I make no guarantees of returns or results. I just provide tools to help you trade better. However, I hope this ROCit will take you to the moon. And if it does, be sure to give me a shout as well as some tips of your own.
Send me a message with any questions or suggestions.

MZ Momentum Non Repainting HTF HFT Scalper BotThis is an original script meant to be a high frequency trader that works on higher time frame calculations. I came up with the idea that using calculus I can figure out the actual rate of change and momentum with different calculations than the momentum indicator that is provided by trading view. Once momentum is shifted on a small time frame, it will provide an entry signal. The script is meant to be used on an algorithmic trading system for scalping purposes. It should be run on a one minute time frame.
Set it up on a one minute chart - setup your bot on a one minute interval.
Find the source of your data. You can use any time frame, open, close. high, low, olc4. Open is pretty much guaranteed to not have any repainting issues - although all the other calcs use a custom isbarconfirmed security repaint calculation.
Set your rate of change period - typically I use a one minute time frame for this as well - but set my length fairly long (30-40).
Then set your period for momentum calculation. This will sample the rate of change data to figure out your momentum. I typically try a setting of 6-8. If that doesn't work, try setting it about the same as the rate of change period and add or subtract a few from there.
Unfortunately due to various plotting constraints in Pinescript, you cannot plot the rate of change and momentum and price in the same.
Set your trigger point. I try values -30, -20, -10, 0, 1. Then finesse to get an earlier entry signal. You should account for a slight delay from the signal to the actual entry. Your backtest should test well, but please note that does not gaurantee results. In my findings, I have seen that there is a slight minimal delay between signal to entry and that can make the difference whether your trade is profitable or not.
Use the show data to show you additional data when you are backtesting. This can allow you to try to filter out results or market conditions that do not work. I typically work with the RSI and use the 30 minute and 15 minute RSIs. I make sure that it is trading within a certain band - about 40-75. You can try the inverse and only buy during really low RSI's as well.
Use the enter and close messages to setup your webhook messages. But I recommend to allow the algo trading platform to close the trade for you based on their calcs since that platform knows the actual price level and when it has become profitable.
Filters have been setup for
Moving Average Variants - any time frame, any length.
RSI - Any time frame, any length,
Future Plans: ATR Filter so you can filter out low volatility periods.
Send me a message with any suggestions.
Nifty-15mins-Trend-followerThis script is developed for Nifty on 15mins timeframe intervals. It is purely developed on CCI, RSI and SR (Support and Resistance)
Don't use this script results for trading purpose. Use this as an study purpose

Road To DubaiROAD TO DUBAI
Useful for daily trading over all type of asset, from Stock to Crypto, Forex and Commodities. It works best with 5min to 1hr graphs, if you are a intraday trader.
This is not a simple mashup of indicators, because you can add them as your own.
This script is more like a tool to understand price action based on indicators position . Thanks to cross call based on MACD , RSI with EMA applied and few index realtime mapping, this tool will let you reduce time effort for graph analysis .
As extra feature it will let you to try different strategies , all fully customizable.
I've tried my best to keep it readble, and easy to use. The best way to learn to use it, is to disable all features from configuration and try one by one.
CONFIGURATION TIPS : Click "Settings Gear" in the Upper Right Corner and disable "Indicator Arguments"
HOW TO PROPER SETUP
Road to Dubai 3 is semiautomatic on finding best Long and Short areas, and plot on the chart.
From configuration menu you can set a Backtrace period and sensibility for RSI EMA10, RSI EMA80 and MACD on your Timeframe, 5min, 30min, 60min.
Usually when configured, those parameters works fine on almost every asset.
You only need to start understanding signals.
STANDARD FEATURES
VWAP : Green/Red line. It will reset everyday at 00.00.
EMA80 : White Line
BLUELINES : Positive and negative overextend value from VWap . This is based on a range of bar and it will extend on the opposite side the lower or higher candle. Useful for understading where price can arrive, expecially if a spike will appear.
Those indicators are quite useful for understading trends, price positions and maximum price range.
RSI EMA10 OVERBOUGHT / OVERSOLD
Yellow arrow marks where RSI arrived at his Top or Bottom. If on different timeframes (5min, 30min and 60min) something similar happen area is filled with Red or Green.
This is base on EMA10 applied to RSI (I usually refer at it as Yellow Line on my indicator HighFreq Trader)
To find good values please try High Freq Trader 1.3
RSI EMA80 CALL
Red Cross or Green Square advice for a really potential inversion of trend. When a Silver bar appear, this means the same call was triggered on different Timeframe in the sametime.
This is based on EMA80 applied to RSI (I usually refer at it as Blue Line on my indicator HighFreq Trader).
To find good values please try High Freq Trader 1.3
MACD CALL
Based on MACD with standard settings. When triggered, a lime Triangle appears. Differents size based on timeframe (5min smaller, 60min bigger). If the same call is triggered on the same place a Lime Bar appear on the opposite side of trend (this is a graphical contents, bacause with all enabled, standard use, can be difficult to read signals).
In Menu Settings you will be able to set your best parameter for your asset.
MACD FIBONACCI EXTRA FEATURE
If you want you can enable a Fibonacci draw based on MACD . This works at his best (on my opinion) with 30min MACD
EXAMPLE
NATURAL GAS
In this chart 30min you can see all calls triggered for a Short. Yellow RSI Arrow, Red Cross, Macd Triangle and Colored Red, Lime and Silver Bars are all calling for Short.
In this way you can see in notime if this can be a perfect moment for take position
VIX VXN DXY CALLS
If VIX , VXN is triggered a small Green Dot will appear. If both are in the same time a bigger Dot appear. Very useful to find trend inversion.
If DXY is triggered a Red Dot will appear (only on Daily Chart ). Very Useful to understand trend inversion on whole market.
VOLUMES REMINDERS
Find if there was an High Volume traded (HV) or Low Volume Traded (LV) in the near past. Useful to understand if some tricky situation could happen (like a sudden sell, an accumulation or distribution)

Directional Movement IndexADX is an oscillating indicator, displayed as a single line, ranging from 0 to 100, it only indicates the strength of the trend and does not indicate its direction. In other words, the ADX is non-directional, meaning that it measures the strength of a trend, but doesn’t distinguish between uptrend and downtrends. So, during a strong uptrend, the ADX rises and during a strong downtrend, the ADX also rises.
Here is how you correctly read what ADX is saying about the market. Here are 5 aspects regarding the interpretation of the ADX:
1- When ADX is above 25, trend strength is strong. Usually, once the ADX gets above 25 this signals the beginning of a trend. Big moves (upwards or downwards) tend to happen when ADX is right around this number. You can experiment with this number, some traders that want faster signals, tend to use a 20 threshold when trading with the ADX.
2- When ADX is below 25, traders must avoid trend trading strategies as the market is in accumulation or distribution phase. So, when we see the ADX line below 20 or 25 level, we forget about trend following strategies and we apply strategies suitable for a ranging market.
3- When ADX is above 25 and Positive Directional Movement Indicator (+DMI) is above the Negative Directional Movement Indicator (-DMI). ADX measures the strength of an uptrend. The crossover between the 2 Directional Movement Indicator, as the ADX line is well above 25 can result in an excellent bullish move.
4- The Positive Directional Movement Indicator (+DMI) should be above the Negative Directional Movement and the ADX should be above 25 signals for a strong upward trend for long opportunities. When ADX is above 25 and Positive Directional Movement Indicator is below the Negative Directional Movement Indicator, ADX measures the strength of a downtrend and short opportunities.
5- Values over 50 of the ADX indicate a very strong trend
There are pros and cons of ADX.
So, why is the ADX useful for traders: First, is excellent at quantifying trend strength. Also, it allows traders to see the strength of bulls and bears at the same time. It is good at filtering out trades, during accumulation periods and is good at identifying trending conditions.
But the ADX also has its limitations. The most important disadvantage is the fact that ADX is a lagging indicator that follows the price, so we must be very careful when we apply this indicator, because we might miss the inception of the trend and join it when it’s nearly over.
Also, it offers many false signals when used on shorter time frames, so it’s advisable to trade it on higher time frames Also, the ADX does not contain all of the data necessary a for proper analysis of price action, so it must be used in combination with other tools or indicators.
Now that we fully covered the good and the bad regarding ADX, let’s see how it is used in a trading strategy.
The trading strategy involves a DMI crossover, confirmed by ADX above consolidation threshold. If +DMI crossover, we take long position and if -DMI crosses over, we take a short position.
Candles are re-colored for easy demonstration of uptrend, downtrend and consolidation periods.
Green candles – ADX > Consolidation Threshold and +DMI > -DMI
Red candles – ADX > Consolidation Threshold and +DMI < -DMI
Black candles – ADX < Consolidation Threshold
Repaint – This is a non-repainting strategy - All the signals are generated at candle closing. All the calculations are made on previous candle’s open, high, low, close. No request security function is used. No data is being used from higher time frame. Trade exit uses close function instead of exit to avoid limit orders. Only one long trade at a time (no pyramiding) is allowed.
Strategy Time frame – D (To filter out false signals, higher time frame is recommended)
Strategy For – Swing Traders
Assets – Cryptocurrencies + Stocks

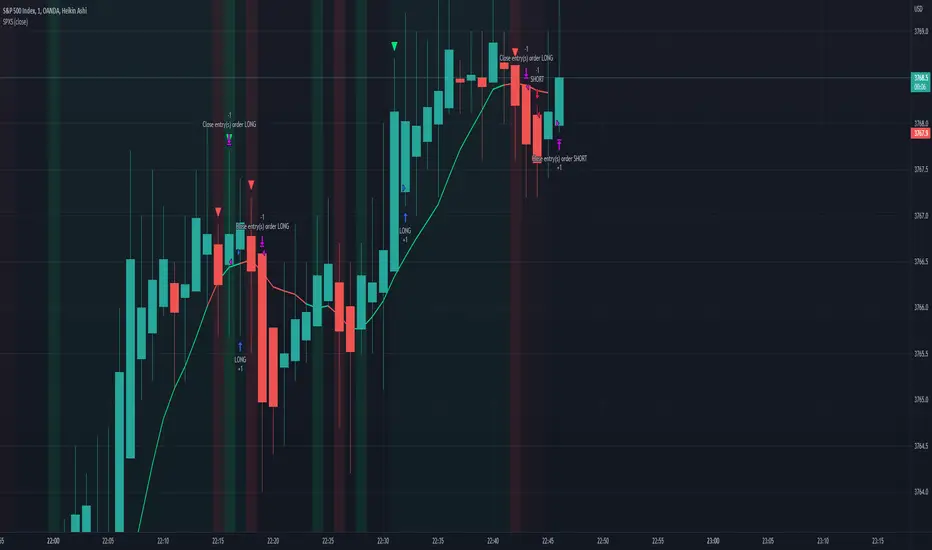
SPX Scalping StrategyThis strategy points out good entries and exits to go with the direction of SPY
Used with:
Ticker: SPX 500 USD
Heiken Ashi Candles
1, 3, 5 min timeframe
Rainbow Oscillator [Strategy]Strategy based on Rainbow Oscillator
.:: Features ::.
Takes and Stops in percent
Configurable indicator iside
.:: Long condition ::.
Indicator line is green (mean uptrend) and crossing averages generated from oscillograph signal fast is go up and crossing slow
.:: Short condition ::.
Indicator line is red (mean downtrend) and crossing averages generated from oscillograph signal fast is go down and crossing slow

Sig30MALICEHello everyone
Bot is optimalized BINANCE:ALICEUSDTPERP BOT, which select leverage betwen 2x and 4x
TimeFrame : 30min
TP : 80 point
SL : 120 point
the bot works as follows:
the way he opens a position consists of two conditions
1) Moving average (crossovers)
2) RSI
Backtesting is set for counting as 13 contrat, this bot can get more with 50% of equity.
I think this is really solid 30min bot, which is already really important to make something solid on 30min
However keep in mind this is scalper and optimalization scalpers are really hard and have to be set from time to time
This bot is also great for other optimalizations .
.
.
.
.
.
.
Enjoy

Cheat Code- Example 1; Short-Term; Follow the Trend BINANCE:BTCUSDT ; BINANCE:ETHUSDT ; BINANCE:FILUSDT ;
This strategy is simple and easy to read and takes advantage of conditional signs of trend reversals. It works best in 10-minute time frames for most large and mid-cap crypto. This code is a tutorial for creating a profitable yet easy strategy, and hopefully, it can be put to good use :)
Aroon Backtest (Simple) [Loxx]Simple backtest for Bears Bulls Impulse found here:
What this backtest includes:
-Customization of inputs for Aroon calculation
-Take profit 1 (TP1), and Stop-loss (SL), calculated using standard RMA-smoothed true range
-Activation of TP1 after entry candle closes
-Long and short signal cross entries
-Continuation long and shorts entries calculated by lagged same-signal cross-ups and cross-downs
Happy trading!

5 Minute Scalping StrategyTaking entrys based on the 1 minute timeframe MACD
only taking longs when all emas are in the correct order and there is a bigger than usual MACD downtick and the RSI is above 51
only taking shorts when all emas are in the opposite order and there is a bigger than usual uptick on the MACD and the RSI is bellow 49
bigger than usual ticks are defined by bollinger bands around the Macd and the ticks have to be higher than 35 and lower than -10
you can change whatever setting you like to make the strategy more profitible. pls share when you find a more profitible setting than me
the stoploss doesnt work correct if it would be hit in the same candle you enter the trade. pls share when you have a solution for this
the stratagy is profitible when i backtested it for the last month, but i dont know how it will play out in the future, so you enter the signals at your own risk
