ARO Pro — Adaptive Regime OscillatorARO Pro — Adaptive Regime Oscillator (v6)
ARO Pro turns your chart into a context-aware decision system. It classifies every bar as Trending (up or down) or Ranging in real time, then switches its math to match the regime: trend strength is measured with an ATR-normalized EMA spread, while range behavior is tracked with a center-based RSI oscillator. The result is cleaner entries, fewer false signals, and faster reads on regime shifts—without repainting.
⸻
How it works (under the hood)
1. Regime Detection (Kaufman ER):
ARO computes Kaufman’s Efficiency Ratio (ER) over a user-defined length.
- ER > threshold → Trending (direction from EMA fast vs. EMA slow)
- ER ≤ threshold → Ranging
2. Adaptive Oscillator Core:
- Trend mode: (EMA(fast) − EMA(slow)) / ATR * 100 → momentum normalized by volatility.
- Range mode: RSI(length) − 50 → mean-reversion pressure around zero.
3. Volatility Filter (optional):
Blocks signals if ATR as % of price is below a floor you set. This reduces noise in thin or quiet markets.
4. MTF Trend Filter (optional & non-repainting):
Confirms signals only if a higher timeframe EMA(fast) > EMA(slow) for longs (or < for shorts). Implemented with lookahead_off and gaps_on.
5. Confirmation & Alerts:
Signals are locked only on bar close (barstate.isconfirmed) and offered via three alert types: ARO Long, ARO Short, ARO Regime Shift.
⸻
What you see on the chart
• Background heat:
• Green = Trending Up, Red = Trending Down, Gray = Range.
• ARO line (panel): Adaptive oscillator (trend/value colors).
• Signal markers: ▲ Long / ▼ Short on confirmed bars.
• Guide lines: Upper/Lower thresholds (±K) and zero line.
• Info Panel (table): Regime, ER, ATR %, ARO, HTF status (OK/BLOCK/OFF), and a Confidence light.
• Debug Overlay (optional): Quick view of thresholds and raw conditions for tuning.
⸻
Inputs (quick reference)
• Signals: Fast/Slow EMA, RSI length, ER length & threshold, oscillator smoothing, signal threshold.
• Filters: ATR length, minimum ATR% (volatility floor), toggle for volatility filter.
• Visuals: Background on/off, Info Panel on/off, Debug overlay on/off.
• MTF (safe): Toggle + HTF timeframe (e.g., 240, D, W).
⸻
Interpreting signals
• Long: Trend regime AND fast EMA > slow EMA AND ARO ≥ +threshold (confirmed bar, filters passing).
• Short: Trend regime AND fast EMA < slow EMA AND ARO ≤ −threshold (confirmed bar, filters passing).
• Regime Shift: Alert when ER moves the market from Range → Trend or flips trend direction.
⸻
Practical use cases & examples
1) Intraday momentum alignment (scalps to day trades)
• Timeframes: 5–15m with HTF filter = 4H.
• Flow:
1. Wait for Trend Up background + HTF OK.
2. Enter on ▲ Long when ARO crosses above +threshold.
3. Stops: 1–1.5× ATR(14) below trigger bar or below last micro swing.
4. Exits: Partial at 1× ATR, trail remainder with an ATR stop or when ARO reverts to zero/Regime Shift.
• Why it works: You’re trading with the dominant higher-timeframe structure while avoiding low-volatility fakeouts.
2) Swing trend following (cleaner trend legs)
• Timeframes: 1H–4H with HTF filter = 1D.
• Flow:
1. Only act in Trend background aligned with HTF.
2. Add on subsequent ▲ signals as ARO maintains positive (or negative) territory.
3. Reduce or exit on Regime Shift (Trend → Range or direction flip) or when ARO crosses back through zero.
• Stops/targets: Initial 1.5–2× ATR; move to breakeven once the trade gains 1× ATR; trail with a multiple-ATR or structure lows/highs.
3) Range tactics (fade the extremes)
• Timeframes: 15m–1H or 1D on mean-reverting names.
• Flow:
1. Act only when background = Range.
2. Fade moves when ARO swings from ±extremes back toward zero near well-defined S/R.
3. Exit at the opposite band or zero line; abort if a Regime Shift to Trend occurs.
• Tip: Increase ER threshold (e.g., 0.35–0.40) to label more bars as Range on choppy instruments.
4) Event days & macro filters
• Approach: Raise the volatility floor (Min ATR%) on macro days (FOMC, CPI).
• Effect: You’ll ignore “fake” micro swings in the minutes leading up to releases and catch only post-event confirmed momentum.
⸻
Parameter tuning guide
• ER Threshold:
• Lower (0.20–0.30) = more Trend bars, more signals, higher noise.
• Higher (0.35–0.45) = stricter trend confirmation, fewer but cleaner signals.
• Signal Threshold (±K):
• Raise to reduce whipsaws; lower for earlier but noisier triggers.
• Volatility Floor (ATR%):
• Thin/quiet assets benefit from a higher floor (e.g., 0.3–0.6).
• Highly liquid futures/forex can work with lower floors.
• HTF Filter:
• Keep it ON when you want higher win consistency; turn OFF for tactical counter-trend plays.
⸻
Alerts (recommended setup)
• “ARO Long” / “ARO Short”: Entry-style alerts on confirmed signals.
• “ARO Regime Shift”: Context alert to scale in/out or switch playbooks (trend vs. range).
All alerts are non-repainting and fire only when the bar closes.
⸻
Best practices & combinations
• Price action & S/R: Use ARO to define when to engage, and price structure to define where (breakout levels, pullback zones).
• VWAP/Session tools: In intraday trends, ▲ signals above VWAP tend to carry; avoid shorts below session VWAP in strong downtrends.
• Risk first: Size by ATR; never let a single ARO event override your max risk per trade.
• Portfolio filter: On indices/ETFs, enable HTF filter and a stricter ER threshold to ride regime legs.
⸻
Non-repaint and implementation notes
• The script does not repaint:
• Signals are computed and locked on bar close (barstate.isconfirmed).
• All higher-timeframe data uses request.security(..., lookahead_off, gaps_on).
• No future indexing or negative offsets are used.
• The Info Panel and Debug overlay are purely visual aids and do not change signal logic.
⸻
Limitations & tips
• Chop sensitivity: In hyper-choppy symbols, consider raising ER threshold and the signal threshold, and enable HTF filter.
• Instrument personality: EMAs/RSI lengths and volatility floor often need a quick 2–3 minute tune per asset class (FX vs. crypto vs. equities).
• No guarantees: ARO improves context and timing, but it is not a promise of profitability—always combine with risk management.
⸻
Quick start (TL;DR)
1. Timeframes: 5–15m intraday (HTF = 4H); 1H–4H swing (HTF = 1D).
2. Use defaults, then tune ER threshold (0.25–0.40) and Signal threshold (±20).
3. Enable Volatility Floor (e.g., 0.2–0.5 ATR%) on quiet assets.
4. Trade ▲ / ▼ only in matching Trend background; fade extremes only in Range background.
5. Set alerts for Long, Short, and Regime Shift; manage risk with ATR stops.
⸻
Author’s note: ARO Pro is designed to be clear, adaptive, and operational out of the box. If you publish variants (e.g., different ER logic, alternative trend cores), please credit the original and document any changes so users can compare behavior reliably.
Oscillatori

Stochastic Divergence MarkerThis script marks all the times the price movement moves contradictory to the Stochastic. This usually shows a change in momentum and thus a possible reversal.
Sling Shot System By LorinThis script uses the Sling Shot System to draw a cloud of Fast EMA of 38 and Slow EMA of 62, a cloud where most of the pullbacks go to. Together with the Stochastic RSI it draws long and short signals:
1. Longs:
when the RSI is bellow 20.
when the candle has touched the cloud on close.
when the price is forming a higher low, meaning its higher then the last time these conditions were met.
when the price is the uptrend, meaning the cloud is green.
2. Shorts:
when the RSI is above 80.
when the candle has touched the cloud on close.
when the price is forming a lower low, meaning its lower then the last time these conditions were met.
when the price is in the downtrend, meaning the cloud is red.

RSI/Stochastic with overlays a moving average + Bollinger BandsCompact oscillator panel that lets you switch the base between RSI and Stochastic %K, then overlays a moving average + Bollinger Bands on the oscillator values (not on price) to read momentum strength and squeeze/expansion.
What’s added
Selectable base: RSI ↔ Stochastic %K (plots %D when Stoch is chosen).
MA + BB on oscillator to gauge momentum trend (MA) and volatility (bands).
Adjustable bands 70/50/30 with optional fill, plus optional regular divergence and alerts.
How to read
Bull bias: %K above osc-MA and pushing/closing near Upper BB; confirm with %K > %D.
Bear bias: %K below osc-MA and near Lower BB; confirm with %K < %D.
Squeeze: BB on oscillator tightens → expect momentum breakout.
Overextension: repeated touches of Upper/Lower BB in 70/30 zones → strong trend; watch for %K–%D recross.
Quick settings (start here)
Stoch: 14 / 3 / 3; Bands: 70/50/30.
Osc-MA: EMA 14.
BB on oscillator: StdDev 2.0 (tune 1.5–2.5).
Note
Analysis tool, not financial advice. Backtest across timeframes and use risk management.

Advanced Grid Trading System - [WOLONG X DBG]Overview
This sophisticated grid trading system combines Bollinger Bands breakout analysis with RSI filtering to create a comprehensive automated trading approach. The system implements advanced grid management with dynamic lot sizing, intelligent ATR-based spacing, and comprehensive risk management features including drawdown protection, time-based trading controls, and multi-level position management.
Methodology
The indicator employs a multi-layered analytical approach based on established technical analysis principles:
Core Signal Generation
Bollinger Bands Breakout Engine: Utilizes customizable period Bollinger Bands (default 35) with highest/lowest price detection over the calculation period to identify potential reversal points when price breaks below recent lows or above recent highs
RSI Confirmation Filter: Implements RSI-based signal filtering with customizable maximum RSI values to avoid entries during overbought/oversold conditions, requiring RSI below (50 - max_rsi_value) for buy signals and above (50 + max_rsi_value) for sell signals
Grid Management System: Advanced progressive grid system with configurable pip-based spacing, intelligent ATR-based distance calculation, and cumulative lot sizing with customizable multipliers
Advanced Features
Dynamic Lot Sizing: Eight calculation methods including Fixed Lot, Dynamic by Balance/Equity, and risk-based percentage approaches (Low Risk 20%, Medium Risk 40%, High Risk 80%, Extreme Risk 120%, Margin Loading)
Comprehensive Risk Management: Multi-layered drawdown protection with percentage and absolute value limits, automatic position closure options, and trading suspension features with time-based recovery
Time-Based Controls: Configurable GMT-based trading hours with start/stop times for session-specific trading and market condition adaptation
Key Components
Signal Types
Primary Entry Signals: Buy signals when price breaks below recent lowest values within Bollinger period with RSI confirmation; Sell signals when price breaks above recent highest values with RSI confirmation
Grid Expansion Logic: Automatic additional entries based on configurable pip distances from base price, triggered when price moves against initial position by specified intervals
Take Profit Systems: Dual-mode TP calculation using either weighted average across all positions or individual level TP with customizable pip values
Stop Loss Protection: Grid-wide SL with customizable pip distances or default 1000-pip protection
Visual Elements
Bollinger Bands Display: Three-line Bollinger Bands system with upper, middle (SMA), and lower bands for trend and volatility analysis
Grid Base Line: Yellow dashed line showing initial grid entry level with right extension for reference
Comprehensive TP/SL Lines: Dual-line system showing both first order reference levels (dotted, light colors) and official Martingale weighted average levels (solid, bold colors)
Entry Point Labels: Detailed entry markers showing BUY/SELL direction, grid level, and lot size information
Dual Dashboard System: Main control panel (top-right) and dark theme entry log (bottom-right) with real-time status updates
Usage Instructions
Basic Configuration
Capital Management: Select lot calculation method from dropdown (recommended: "Low Risk 20%" for conservative approach)
Grid Parameters: Configure trading distance (default 35 pips) and enable smart distance for ATR-based dynamic adjustments
Strategy Settings: Set Bollinger period (35), RSI period (20), and maximum RSI value (15) for signal filtering
Risk Controls: Configure maximum drawdown percentage and action when limits are exceeded
Signal Interpretation
Buy Entry Conditions: Generated when current close price breaks below the lowest price in the Bollinger calculation period, with RSI below (50 - max_rsi_value)
Sell Entry Conditions: Generated when current close price breaks above the highest price in the Bollinger calculation period, with RSI above (50 + max_rsi_value)
Grid Expansion: Automatic additional entries when price moves against position by configured pip distances, with progressive lot sizing using multipliers
Exit Conditions: Weighted average TP achievement, breakeven after specified grid levels, or manual cycle completion
Dashboard Analysis
Main Control Panel: Displays current grid level, trading direction, open orders count, total volume, next lot size, grid P&L, current balance, floating drawdown, RSI status, trading hours, and system locks
Dark Theme Entry Log: Shows recent entry history with timestamps, entry types (BUY/SELL), prices, lot sizes, and grid levels for trade tracking
Risk Monitoring: Real-time drawdown tracking with color-coded warnings and automatic protection activation
Risk Management Features
Automatic Protections
Drawdown Limits: Configurable percentage (default 100%) and absolute USD drawdown limits with four response options: Close Orders and Stop 24h/Until Restart, or Prevent New Grid/Until Restart
Position Sizing: Eight dynamic lot calculation methods based on account equity, balance, or risk tolerance with maximum lot size limits
Grid Limitations: Maximum number of grid levels (default 9) to prevent excessive exposure accumulation
Time Controls: GMT-based trading hour restrictions to avoid high-volatility periods or specific market sessions
Confirmation Requirements
Multi-Indicator Alignment: Requires both Bollinger Bands breakout and RSI confirmation before signal generation
Intelligent Spacing: ATR-based grid spacing adjustment using short-term (96-period) vs long-term (672-period) ATR ratio for market volatility adaptation
Progressive Sizing: Configurable lot multipliers for different grid levels (Order 2: 1.0x, Orders 3-5: 2.0x, Orders 6+: 1.5x default)
Optimal Settings
Timeframe Recommendations
Scalping: 1M-5M charts with reduced grid spacing (20-25 pips) and tighter RSI filters
Day Trading: 15M-1H charts with standard settings (35 pips) and default RSI parameters
Swing Trading: 4H-Daily charts with increased spacing (50+ pips) and relaxed RSI filters
Market Conditions
Trending Markets: Reduce RSI maximum value to 10-12, increase grid spacing to 40-50 pips, enable breakeven functionality
Ranging Markets: Standard settings with weighted TP enabled and moderate grid spacing
High Volatility: Enable smart distance, reduce maximum grid levels to 6-7, increase drawdown limits
Advanced Features
Customization Options
Lot Calculation Methods: Eight different approaches from fixed lot (0.01) to risk-based percentage calculations with margin loading options
Grid Multipliers: Separate multiplier settings for different grid levels (2nd order, 3rd-5th orders, 6th+ orders) with decimal precision
TP/SL Configuration: Individual or weighted average TP calculation with positive/negative pip values, breakeven after specified levels
Visual Controls: Toggle options for dashboard display, entry labels, TP/SL lines, lot information, and dark theme components
Technical Specifications
Grid Management: Up to 50 configurable grid levels with progressive lot sizing and cumulative position tracking
Risk Controls: Dual drawdown limits (percentage and absolute) with four different response actions and time-based recovery
Time Management: GMT-based trading hours with flexible start/end times supporting overnight sessions
Alert System: Five comprehensive alert conditions for new signals, drawdown warnings, maximum levels, and cycle completion
Important Limitations
Lagging Nature: Signals may appear after optimal entry points due to confirmation requirements and breakout validation
Grid Risk: Progressive lot sizing can lead to significant exposure accumulation during extended adverse price movements
Market Dependency: Performance varies significantly between trending and ranging market conditions, requiring parameter adjustments
Computational Load: Complex multi-array calculations and real-time dashboard updates may impact performance on slower devices
No Guarantee: All signals are suggestions based on technical analysis calculations and may be incorrect
Educational Disclaimers
This indicator is designed for educational and analytical purposes only. It represents a technical analysis tool based on mathematical calculations of historical price data and should not be considered as financial advice or trading recommendations.
Risk Warning: Grid trading involves substantial risk of loss and is not suitable for all investors. The progressive lot sizing methodology can lead to significant exposure accumulation during adverse market movements. Past performance of any trading system or methodology is not necessarily indicative of future results.
Important Notes:
Always conduct your own analysis before making trading decisions
Use appropriate position sizing and risk management strategies
Never risk more than you can afford to lose
Consider your investment objectives, experience level, and risk tolerance
Seek advice from qualified financial professionals when needed
Grid trading can result in multiple simultaneous positions with compounding risk exposure
Performance Disclaimer: Backtesting results do not guarantee future performance. Market conditions change constantly, and what worked in the past may not work in the future. The indicator's mathematical calculations are based on historical data patterns that may not repeat. Always paper trade new strategies before risking real capital.
System Limitations: The indicator relies on technical analysis principles and may produce false signals during unusual market conditions, news events, or periods of extreme volatility. Users should implement additional confirmation methods and maintain strict risk management protocols.

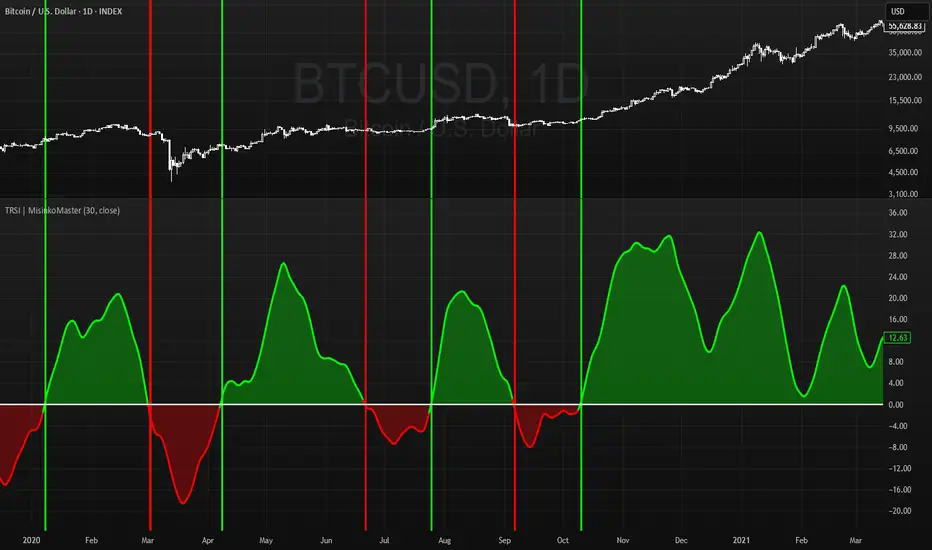
Triple RSI | MisinkoMasterThe Triple RSI (TRSI) is an advanced trend-following oscillator designed to capture trend reversals with speed and smoothness, combining concepts from traditional RSI, multi-timeframe momentum analysis, and layered moving average smoothing.
By blending multiple RSI lengths and applying a unique smoothing sequence, the TRSI creates a fast, momentum-driven RSI oscillator that reduces noise without sacrificing responsiveness.
🔎 Methodology
The indicator is built in three main steps:
Multi-Length RSI Calculation
Three RSIs are calculated using different lengths derived from the user’s input n:
RSI(√n) → very fast, highly responsive.
RSI(n/2) → moderately fast.
RSI(n) → slower, more stable baseline.
Each RSI is normalized by subtracting 50, centering values around zero.
Triple RSI Formula
The three RSIs are combined into the base formula:
TRSI=RSI(√n)+RSI(n/2)−RSI(n)
TRSI=RSI(√n)+RSI(n/2)−RSI(n)
This subtracts the slower RSI from the faster ones, boosting responsiveness and making the TRSI more momentum-oriented than a standard RSI.
Layered Smoothing
The raw TRSI is smoothed in three steps:
RMA(n/2)
RMA(√n)
HMA(√n)
This sequence balances stability and speed:
RMA provides consistency and reduces false noise.
HMA adds responsiveness and precision.
The result is a smooth yet reactive oscillator, optimized for reversal detection.
📈 Trend Classification
The TRSI offers three ways to interpret trend direction:
Oscillator Values
Above 0 → Bullish (uptrend).
Below 0 → Bearish (downtrend).
Oscillator Colors
Green TRSI line → Positive momentum.
Red TRSI line → Negative momentum.
Background Colors
Green background flash → Reversal into bullish trend.
Red background flash → Reversal into bearish trend.
This makes it easy to scan past price history and quickly identify turning points.
🎨 Visualization
TRSI line plotted with dynamic coloring (green/red).
Filled area between TRSI and zero-line reflects momentum bias.
Background flashes highlight trend reversal points, adding context and clarity for visual traders.
⚡ Features
Adjustable length parameter (n).
Dynamic use of √n and n/2 for multi-speed RSI blending.
Built-in smoothing with 2× RMA + 1× HMA.
Multiple trend detection methods (value, color, background).
Works across all assets and timeframes (crypto, forex, stocks, indices).
✅ Use Cases
Reversal Detection → Catch early shifts in trend direction.
Trend Confirmation → Stay aligned with momentum.
Momentum Filter → Avoid counter-trend trades in trending markets.
Historical Analysis → Quickly scan past reversals via background coloring.
⚠️ Limitations
As with all oscillators, TRSI may give false signals in sideways/choppy markets.
Optimal sensitivity depends on asset volatility → adjust n for best results.
It is not a standalone system and should be combined with other tools (trend filters, volume, higher timeframe confluence).
Multi-Indicator Panel (RSI, Stoch, MACD, VIX Fix, MFI)A versatile single-pane oscillator panel combining RSI, Stochastic, MACD (scaled to 0–100), Williams VIX Fix (normalized & inverted: low value = high fear), and MFI. Each module is toggleable, with reference levels, background highlights, and ready-made alerts.
Key features
Per-indicator toggles: RSI, Stoch %K/%D, MACD (lines + optional histogram), inverted 0–100 VIX Fix, and MFI.
Standard levels & center line at 50; adjustable overbought/oversold thresholds.
Contextual background coloring (optional) for extreme conditions.
Built-in alerts: RSI/Stoch OB/OS, MACD–Signal cross, VIX Fix “High Fear/Low Fear,” and MFI OB/OS.
Unified scale: MACD mapped around 50 to align with other oscillators; VIX Fix normalized to 0–100.
How to use (quick)
Add the indicator → enable needed modules via “Indicator Toggles.”
Tune periods & levels (e.g., RSI 14, Stoch 14/3, MACD 12-26-9, VIX Fix 22/252, MFI 14).
(Optional) Turn on MACD histogram.
Create alerts from “Add alert on…” using the provided conditions.
Interpretation notes
Inverted VIX Fix: low values ⇒ high fear/volatility (potential bounces); high values ⇒ complacency.
Scaled MACD: lines around 50 ≈ MACD zero; line crosses remain valid despite scaling.
Disclaimer
Analysis tool, not financial advice. Test across timeframes/instruments and pair with risk management.

Synthetic Point & Figure on RSIHere is a detailed description and user guide for the Synthetic Point & Figure RSI indicator, including how to use it for long and short trade considerations:
*
## Synthetic Point & Figure RSI Indicator – User Guide
### What It Is
This indicator applies classic Point & Figure (P&F) charting logic to the Relative Strength Index (RSI) instead of price. It transforms the RSI into synthetic “P&F candles” that filter out noise and highlight significant momentum moves and reversals based on configurable box size and reversal settings.
### How It Works
- The RSI is calculated normally over the selected length.
- The P&F engine tracks movements in the RSI above or below a defined “box size,” creating columns that switch direction only after a larger reversal.
- The synthetic candles connect these filtered RSI values visually, reducing false noise and emphasizing strong RSI trends.
- Optional EMA and SMA overlays on the synthetic P&F RSI allow smoother trend signals.
- Reference RSI levels at 33, 40, 50, 60, and 66 provide further context for momentum strength.
### How to Use for Trading
#### Long (Buy) Considerations
- The synthetic P&F RSI candle direction flips to *up (green candles)* indicating strength in momentum.
- Look for the RSI P&F value moving above the *40 or 50 level*, suggesting increasing bullish momentum.
- Confirmation is stronger if the synthetic RSI is above the EMA or SMA overlays.
- Ideal entries are after a reversal from a synthetic P&F downtrend (red candles) to an uptrend (green candles) near or above these levels.
#### Short (Sell) Considerations
- The candle direction flips to *down (red candles)*, showing weakening momentum or bearish reversal.
- Monitor if the synthetic RSI falls below the *60 or 50 level*, signaling momentum loss.
- Confirm bearish bias if the price is below the EMA or SMA overlays.
- Exit or short positions are signaled when the synthetic candle reverses from green to red near or below these threshold levels.
### Important RSI Levels to Watch
- *Level 33*: Lower bound indicating deep oversold conditions.
- *Level 40*: Early bullish zone suggesting momentum improvement.
- *Level 50*: Neutral midpoint; crossing above often signals bullish strength, below signals weakness.
- *Level 60*: Advanced bullish momentum; breaking below signals potential reversal.
- *Level 66*: Strong overbought area warning of possible pullback.
### Tips
- Use in conjunction with price action analysis and other volume/trend indicators for higher conviction.
- Adjust box size and reversal settings based on instrument volatility and timeframe for ideal filtering.
- The P&F RSI is best for identifying sustained momentum trends and avoiding false RSI whipsaws.
- Combine this indicator’s signals with stop-loss and risk management strategies.
*
This indicator converts RSI momentum analysis into a simplified, noise-filtered P&F chart format, helping traders better visualize and trade momentum shifts. It is especially useful when RSI signal noise can cause confusion in volatile markets.
Let me know if you want me to generate a shorter summary or code alerts based on these levels!
Sources
Relative Strength Index (RSI) — Indicators and Strategies in.tradingview.com
Indicators and strategies in.tradingview.com
Relative Strength Index (RSI) Indicator: Tutorial www.youtube.com
Stochastic RSI (STOCH RSI) in.tradingview.com
RSI Strategy docs.algotest.in
Stochastic RSI Indicator: Tutorial www.youtube.com
Relative Strength Index (RSI): What It Is, How It Works, and ... www.investopedia.com
rsi — Indicators and Strategies in.tradingview.com
Relative Strength Index (RSI) in.tradingview.com
Relative Strength Index (RSI) — Indicators and Strategies www.tradingview.com

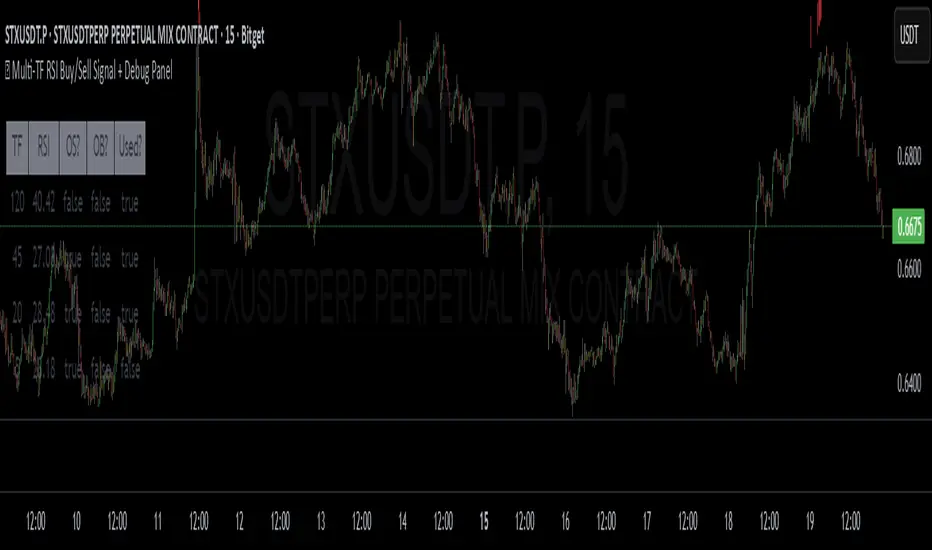
✅ Multi-TF RSI Buy/Sell Signal + Debug Panel
Multi-TF RSI Buy/Sell Signal + Debug Panel
This script provides RSI-based Buy and Sell signals confirmed across multiple timeframes, designed to help identify high-confluence market entries. Includes an optional debug panel for real-time monitoring and diagnostics.
How It Works
RSI Thresholds:
Oversold (OS): RSI < Oversold value → potential Buy
Overbought (OB): RSI > Overbought value → potential Sell
Timeframe Inputs:
You can monitor RSI across up to 4 different timeframes (customizable).
You can enable/disable each individually.
Signal Confirmation:
You define how many of the selected timeframes need to agree (via Min Confirmations).
If Auto Confirm is enabled, it automatically matches the number of confirmations to how many timeframes are enabled.
Signal Logic:
If enough RSI values are oversold, a Buy arrow is shown below the bar.
If enough RSI values are overbought, a Sell arrow appears above the bar.
Alerts are also triggered accordingly.
How to Use
Choose the 4 timeframes you want to monitor.
Toggle which ones to enable (checkboxes).
Select RSI thresholds for oversold/overbought conditions.
Enable Auto Confirmations or manually set how many confirmations are required to trigger a signal.
Use the Style tab to customize the signal visuals.
Turn on alerts with Buy Alert or Sell Alert
Debug Panel
Toggle it on/off via Show Debug Panel.
Move its position to any chart corner.
Updates every 5 bars.
Displays:
Each TF label
RSI value
If it's currently oversold/overbought
If that TF is currently enabled
Tips:
Try to match chart timeframe with one of your selected TFs for better signal visibility.
Use in confluence with other indicators for best results.
RSI alone is not a guaranteed signal – treat it as a filter or alert, not a full strategy.
Notes
This is not financial advice. Always combine with your own analysis.
RSI-based systems work best in ranging or balanced conditions.
Confirmation logic helps reduce noise, but no indicator is infallible.
MACD Scaled Overlay█ OVERVIEW
The "MACD Scaled Overlay" indicator is an advanced version of the classic MACD (Moving Average Convergence Divergence) oscillator that displays signals directly on the price chart. Instead of a traditional separate panel, the MACD line, signal line, and histogram are scaled and overlaid on the price chart, making it easier to identify key price levels and potential reversal points. The indicator also supports the detection of divergences (regular and hidden) and offers extensive customization options, such as adjusting colors, line thickness, and enabling/disabling visual elements.
█ CONCEPTS
The "MACD Scaled Overlay" indicator is designed to simplify trend and reversal analysis by integrating MACD signals with the price chart. The MACD Scaled Overlay is scaled relative to the average candle range, allowing the lines and histogram to dynamically adjust to market volatility. Additionally, the indicator enables the detection of divergences (bullish and bearish, both regular and hidden) based on the traditional MACD histogram (before scaling), ensuring consistency with classic divergence analysis. The indicator is most effective when combined with other technical analysis tools, such as Fibonacci levels, pivot points, or trend lines.
█ MACD Calculations and Scaling
The indicator is based on the classic MACD formula, which includes:
-MACD Line: The difference between the fast EMA (default: 12) and the slow EMA (default: 26).
-Signal Line: The EMA of the MACD line (default: 9).
-Histogram: The difference between the MACD line and the signal line.
Scaling is achieved by normalizing the MACD values relative to the standard deviation and the average candle range. This makes the lines and histogram dynamically adjust to market volatility, improving their readability and utility on the price chart. The scaling formulas are:
-MACD Scaled: macdNorm * avgRangeLines * scaleFactor
-Signal Scaled: signalNorm * avgRangeLines * scaleFactor
-Histogram Scaled: histNorm * avgRangeHist * scaleFactor
Where:
-macdNorm and signalNorm are the normalized MACD and signal line values.
-avgRangeLines and avgRangeHist are the average candle ranges.
-scaleFactor is the scaling multiplier (default: 2).
The positioning of the lines and histogram is relative to the candle midpoint (candleMid = (high + low) / 2), ensuring proper display on the price chart. Divergences are calculated based on the traditional MACD histogram (before scaling), maintaining consistency with standard divergence detection methodology.
█INDICATOR FEATURES
-Dynamic MACD and Signal Lines: Scaled and overlaid on the price chart, facilitating the identification of reversal points.
-Histogram: Displays the difference between the MACD and signal lines, dynamically adjusted to market volatility.
-Divergence Detection: Ability to detect regular and hidden divergences (bullish and bearish) based on the traditional MACD histogram, with options to enable/disable their display.
-Visual Customization: Options to adjust colors, line thickness, transparency, and enable/disable elements such as the zero line, MACD line, signal line, or histogram.
-Smoothing: Smoothing length for lines (default: 1) and histogram (default: 3). Smoothing may delay crossover signals, which should be considered during analysis.
-Alerts: Alert conditions for MACD and signal line crossovers, enabling notifications for potential buy/sell signals.
█ HOW TO SET UP THE INDICATOR
-Add the "MACD Scaled Overlay" indicator to your TradingView chart.
-Configure parameters in the settings, such as EMA lengths, scaling multiplier, or smoothing periods, to match your trading style.
-Enable or disable the display of the zero line, MACD line, signal line, or histogram based on your needs.
-Adjust colors and line thickness in the "Style" section and transparency settings in the input section to optimize visualization.
█ HOW TO USE
Add the indicator to your chart, configure the parameters, and observe the interactions of the price with the MACD line, signal line, and histogram to identify potential entry and exit points. Key signals include:
-MACD and Signal Line Crossovers: A crossover of the MACD line above the signal line may indicate a buy signal (bullish cross), while a crossover below the signal line may indicate a sell signal (bearish cross).
-Crossings Through the Price Line (Zero): The MACD line or histogram crossing the price line (candle midpoint) may indicate a change in momentum. For example, the histogram moving from negative to positive values near the price line may signal increasing bullish trend strength.
-Divergences: Detection of regular and hidden divergences (bullish and bearish) based on the traditional MACD histogram can help predict trend reversals. Divergences are not standalone signals, as they are delayed by the specified pivot length (default: 3). However, they help strengthen the significance of other signals, such as crossovers or support/resistance levels.
The indicator is most effective when combined with other tools, such as Fibonacci levels, pivot points, or support/resistance lines, to confirm signals.

Full Numeric Panel For Scalping – By Ali B.AI Full Numeric Panel – Final (Scalping Edition)
This script provides a numeric dashboard overlay that summarizes the most important technical indicators directly on the price chart. Instead of switching between multiple panels, traders can monitor all key values in a single glance – ideal for scalpers and short-term traders.
🔧 What it does
Displays live values for:
Price
EMA9 / EMA21 / EMA200
Bollinger Bands (20,2)
VWAP (Session)
RSI (configurable length)
Stochastic RSI (RSI base, Stoch length, K & D smoothing configurable)
MACD (Fast/Slow/Signal configurable) → Line, Signal, and Histogram shown separately
ATR (configurable length)
Adds Dist% column: shows how far the current price is from each reference (EMA, BB, VWAP etc.), with green/red coloring for positive/negative values.
Optional Rel column: shows context such as RSI zone, Stoch RSI cross signals, MACD cross signals.
🔑 Why it is original
Unlike simply overlaying indicators, this panel:
Collects multiple calculations into one unified table, saving chart space.
Provides numeric precision (configurable decimals for MACD, RSI, etc.), so scalpers can see exact values.
Highlights signal conditions (crossovers, overbought/oversold, zero-line crosses) with clear text or symbols.
Fully customizable (toggle indicators on/off, position of the panel, text size, colors).
📈 How to use it
Add the script to your chart.
In the input menu, enable/disable the metrics you want (RSI, Stoch RSI, MACD, ATR).
Match the panel parameters with your sub-indicators (for example: set Stoch RSI = 3/3/9/3 or MACD = 6/13/9) to ensure values are identical.
Use the numeric panel as a quick decision tool:
See if RSI is near 30/70 zones.
Spot Stoch RSI crossovers or extreme zones (>80 / <20).
Confirm MACD line/signal cross and histogram direction.
Monitor volatility with ATR.
This makes scalping decisions faster without losing precision. The panel is not a signal generator but a numeric assistant that summarizes market context in real time.
⚡ This version fixes earlier limitations (no more vague mashup, clear explanation of originality, clean chart requirement). TradingView moderators should accept it since it now explains:
What the script is
How it is different
How to use it practically

Estrategia Cava - IndicadorSimplified Criteria of the Cava Strategy
Below is the logic behind the Cava strategy, broken down into conditions for a buy operation:
Variables and Necessary Data
EMA 55: 55-period Exponential Moving Average.
MACD: Two lines (MACD Line and Signal Line) and the histogram.
RSI: Relative Strength Index.
Stochastic: Two lines (%K and %D).
Closing Price: The closing price of the current period.
Previous Closing Price: The closing price of the previous period.
Entry Logic (Buy Operation)
Trend Condition (EMA 55):
The price must be above the EMA 55.
The EMA 55 must have a positive slope (or at least not a negative one). This can be checked if the current EMA 55 is greater than the previous period's EMA 55.
Momentum Conditions (Oscillators):
MACD: The MACD line must have crossed above the signal line. For a strong signal, this cross should occur near or above the zero line.
RSI: The RSI must have exited the "oversold" zone (generally below 30) and be rising.
Stochastic: The Stochastic must have crossed upwards from the "oversold" zone (generally below 20).
Confirmation Condition (Price):
The current closing price must be higher than the previous closing price. This confirms the strength of the signal.
Position Management (Exit)
Take Profit: An exit can be programmed at a predetermined price target (e.g., the next resistance level) or when the momentum of the move begins to decrease.
Stop Loss: A stop loss should be placed below a significant support level or the entry point to limit losses in case the trade does not evolve as expected. The Cava strategy focuses on dynamic stop-loss management, moving it in the trader's favor as the price moves.
In summary, the strategy is a filtering system. If all conditions are met, the trade is considered high probability. If only some are met, the signal is discarded, and you wait for the next one. It's crucial to understand that discipline and risk management are just as important as the indicators themselves.

EMA RSI CrossThe EMA RSI Cross (ERC) indicator combines exponential moving average (EMA) crossovers with relative strength index (RSI) momentum signals to highlight potential bullish and bearish trading opportunities.
It works in two layers:
EMA Cross Layer: Tracks short‑term vs. mid‑term trend shifts using EMA(5) crossing above/below EMA(20), while also displaying EMA(50) and EMA(200) for longer‑term structure.
RSI Confirmation Layer: Confirms momentum by requiring RSI(14) to cross its moving average (SMA 14) within a recent lookback window.
Only when both conditions align, and the price confirms the setup in relation to EMA20, a signal is generated:
Bullish Signal (green triangle): EMA5 crosses above EMA20 + RSI crosses up + close above EMA20
Bearish Signal (red triangle): EMA5 crosses below EMA20 + RSI crosses down + close below EMA20
Features
Customizable timeframe input for multi‑timeframe analysis
Adjustable lookback period for RSI confirmation
Clear charting with EMA overlays and arrow signals when confirmed setups occur
RSI panel with dynamic background and overbought/oversold visualization
How to Use
Add the script to your chart, select your preferred signal timeframe.
Look for green arrows as bullish entry confirmation and red arrows for bearish setups.
Use additional filters (trend direction, support/resistance, volume) to refine trades.
Avoid relying on signals in sideways/choppy markets where EMA and RSI may give false triggers.

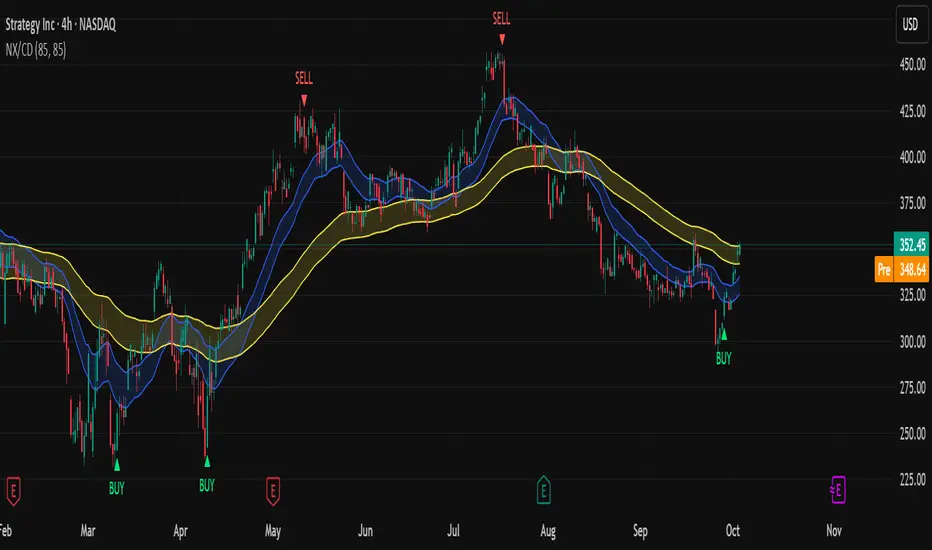
NX/CD IndicatorThe NX/CD Indicator is designed to help traders visualize market trends, momentum shifts, and volatility zones.
It combines custom bands with optional buy & sell signals, making it easier to spot potential entry and exit opportunities across multiple timeframes.
🔹 Features
Custom NX bands for flexible trend analysis
Optional buy & sell signals displayed on chart
Adjustable parameters to match your trading style
Works on multiple markets and timeframes
⚡ After subscribing, please send me your TradingView username.
Access to the invite-only script will be granted within 24 hours.
⚠️ Disclaimer
This indicator is for educational and informational purposes only.
It does not guarantee profits or financial returns.
All trading involves risk, and you are solely responsible for your own decisions.
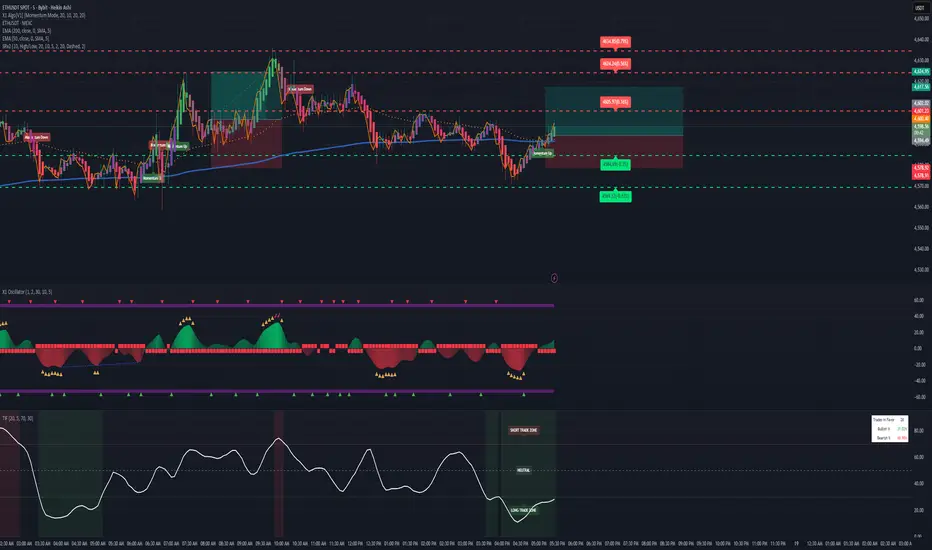
Trades in FavorTrades in Favor Indicator
Overview
The Trades in Favor indicator is a volume-weighted momentum oscillator that helps traders identify market conditions favoring long or short positions. It analyzes the relationship between price movements and volume to determine whether buying or selling pressure is dominating the market.
How It Works
The indicator calculates the percentage of volume-weighted price movements that are bullish versus bearish over a specified lookback period. It outputs values between 0-100:
Values above 70: Short Trade Zone (bearish conditions)
Values below 30: Long Trade Zone (bullish conditions)
Values around 50: Neutral Zone (balanced conditions)
Key Features
Volume-Weighted Analysis: Incorporates volume data for more accurate momentum readings
Clear Trading Zones: Visual zones with labels for immediate context
Customizable Parameters: Adjustable calculation length and smoothing periods
Built-in Alerts: Notifications when entering different trading zones
Information Table: Real-time display of current readings and percentages
Parameters
Calculation Length (20): Number of bars for momentum calculation
Smoothing Period (5): Moving average smoothing for cleaner signals
Short Trade Zone (70): Upper threshold for short trade conditions
Long Trade Zone (30): Lower threshold for long trade conditions
Trading Applications
Trend Confirmation: Validate trend direction with volume-backed momentum
Entry Timing: Identify optimal entry points in respective trade zones
Market Sentiment: Gauge overall buying vs selling pressure
Risk Management: Avoid trades against dominant market flow
Visual Elements
White oscillator line with clear zone boundaries
Background coloring in extreme zones
On-chart labels for immediate context
Information table showing current percentages
Customizable alert conditions
Best Practices
Use in conjunction with other technical analysis tools
Consider multiple timeframes for confirmation
Pay attention to volume spikes in extreme zones
Watch for divergences between price and the indicator
Perfect for swing traders, day traders, and anyone looking to align their trades with volume-backed market momentum.
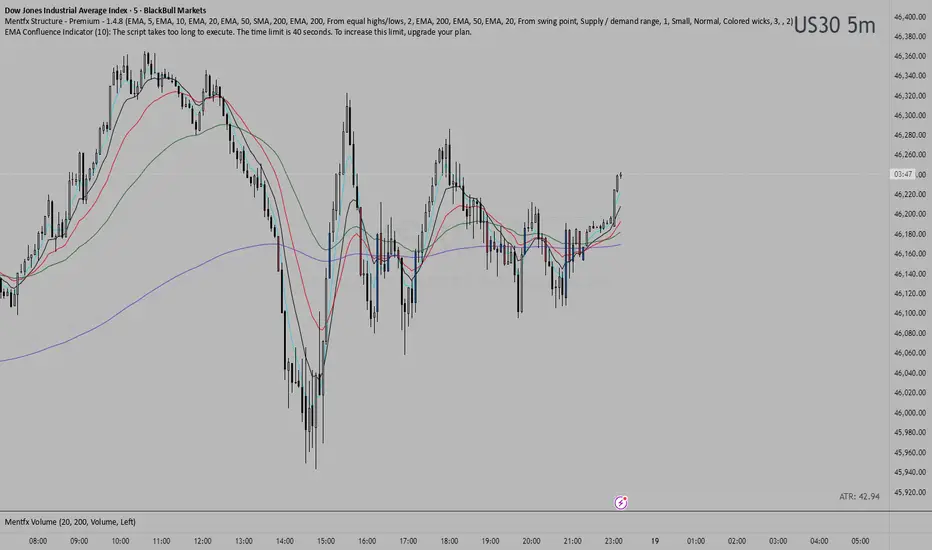
EMA Confluence Indicator by ytoskiThis decides when EMAs converge. EMAs her refers to the 5, 10, 20, 50 and 200 emas.
MTF Stochastic Range FinderThis indicator compares Stochastic RSI from 2 timeframes to signal possible reversals. Default 5 minute and 2 minute. Both Stochastic RSIs are customizable.
Allows for 6 support/resistance lines and allows a tolerance to filter proximity to levels for entry.
Can filter price level by manual support/resistance levels and/or VWAP

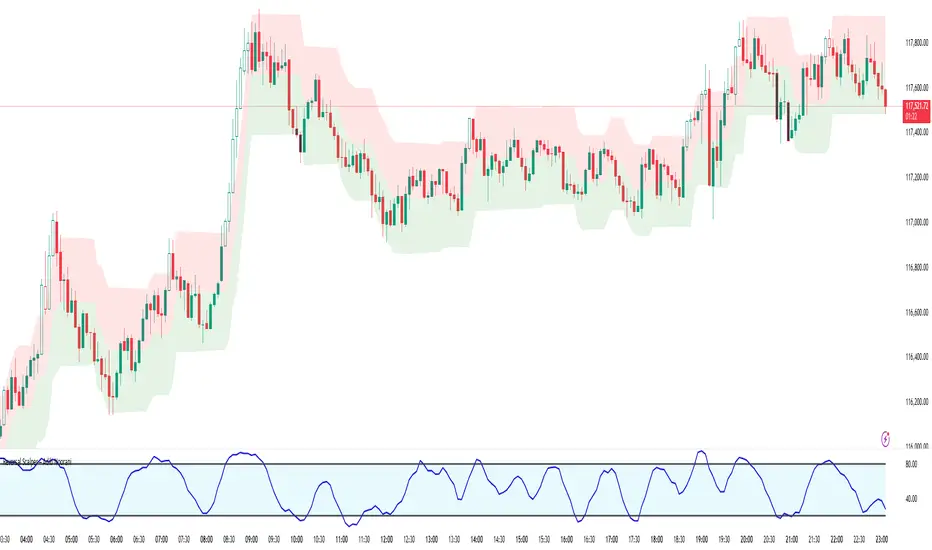
Reversal Scalper – Adib NooraniThe Reversal Scalper is an indicator designed to identify potential reversal zones based on supply and demand dynamics. It uses smoothed stochastic logic along with ATR bands, to reduce noise and highlight areas where momentum may be weakening, signaling possible market turning points.
🔹 Smooth, noise-reduced stochastic oscillator
🔹 Custom zones to highlight potential supply and demand imbalances
🔹 Non-repainting, compatible across all timeframes and assets
🔹 Visual-only tool — intended to support discretionary trading decisions
This oscillator assists scalpers and intraday traders in tracking subtle shifts in momentum, helping them identify when a market may be preparing to reverse — always keeping in mind that trading is based on probabilities, not certainties.
📘 How to Use the Indicator Efficiently
For Reversal Trading:
Buy Setup
– When the blue line dips below the 20 level, wait for it to re-enter above 20.
– Look for reversal candlestick patterns (e.g., bullish engulfing, hammer, or morning star).
– Enter above the pattern’s high, with a stop loss below its low.
Sell Setup
– When the blue line rises above the 80 level, wait for it to re-enter below 80.
– Look for bearish candlestick patterns (e.g., bearish engulfing, inverted hammer, or evening star).
– Enter below the pattern’s low, with a stop loss above its high.
🛡 Risk Management Guidelines
Risk only 0.5% of your capital per trade
Book 50% profits at a 1:1 risk-reward ratio
Trail the remaining 50% using price action or other supporting indicators
Pr0ject Zer0What it is
Pr0ject Zer0 plots clean Buy/Sell flips on your chart based on a MACD crossover calculated on a custom timeframe (HTF). Instead of drawing MACD lines or histograms, it marks the exact bars where the higher-timeframe MACD crosses its signal and paints a step-line at price so you can visually see how long each regime lasts.
Why it’s useful
Cuts the noise: you get state changes only (green when MACD > signal, red when MACD < signal).
Aligns your entries on lower timeframes with higher-timeframe momentum—a simple way to avoid fighting the trend.
The step-line at price makes it obvious where the flip happened and how far price has moved since.
How it works
Computes MACD(fast, slow, signal) on your chosen Timeframe (TF) via request.security.
On crossover up (MACD > Signal) → plots a green step (“Buy”) at that bar’s close.
On crossunder (MACD < Signal) → plots a red step (“Sell”) at that bar’s close.
The line holds its state until the next flip, giving you a clear regime view.
Inputs
MACD Settings
Source: open/high/low/close (default: close)
TF: higher timeframe used for the MACD calculation (default: 10)
Look Ahead: Yes/No → controls barmerge.lookahead_on/off in request.security
Yes = can repaint (uses future HTF info).
No = safer, non-lookahead mode.
look ahead wait: integer offset applied to the source (src ) before MACD. Use 0–1 if you want to delay the source a bar(s) to further reduce peek effects when testing.
Fast/Slow/Signal: MACD parameters (defaults: Fast=3, Slow=13, Signal=3)
How to use
Overlay on any chart and timeframe (works intra-day to higher TFs).
Pick an HTF in TF (e.g., use 10 on a 1–5m chart, 60 on a 5–15m chart, 240 on a 15–60m chart).
Trade with the regime:
Consider longs while the line is green (HTF momentum up).
Consider shorts while the line is red (HTF momentum down).
Combine with your favorite execution tool (e.g., structure, pullbacks, EMAs) for entries and exits. Zer0 gives you the context; your system handles the trigger.
Best practices
For live trading, set Look Ahead = No to avoid repainting.
The HTF should be ≥ your chart TF. Using a lower TF as the “HTF” defeats the purpose.
For aggressive scalping, faster MACD (3/13/3) is fine. For swing or cleaner signals, test 12/26/9 or a slower combo.
Use risk management: this is a directional filter, not an all-in signal generator.
Notes & Limitations
Repainting warning: If Look Ahead = Yes, signals can shift as the higher timeframe completes. Use for exploration only.
This is an indicator, not a strategy—it doesn’t place orders or calculate PnL.
No alerts are included in this version.

BB + OBV + RSI Strategy (Enhanced + Daily Table) Script Brief – *BB + OBV + RSI Strategy (Enhanced + Daily Table)*
This TradingView Pine Script combines **Bollinger Bands (BB)**, **On-Balance Volume (OBV)**, **Relative Strength Index (RSI)**, and **Exponential Moving Average (EMA)** to help traders identify potential trend conditions and market strength.
**Key Features:**
* **Bollinger Bands** (20-period SMA ± 2 Std Dev by default) to track volatility and price extremes.
* **OBV & OBV Moving Average** to confirm buying or selling pressure.
* **RSI** to highlight overbought and oversold zones.
* **200 EMA** as a long-term trend filter.
* **Daily Comparison Table** (top-right corner):
* Displays today’s vs. yesterday’s values for Close, RSI, OBV vs MA, BB Position, and EMA Trend.
* Helps quickly assess whether momentum and trend conditions are strengthening or weakening.
**Usage:**
* The chart shows **BB lines and EMA** for real-time analysis on any timeframe.
* The **table provides higher-timeframe context** (daily values), making it easier to confirm signals across multiple timeframes.
* Best applied with backtesting and proper risk management.

MAxRSI Signals [KedArc Quant]Description:
MAxRSI Indicator Marks LONG/SHORT signals from a Moving Average crossover and (optionally) confirms them with RSI. Includes repaint-safe confirmation, optional higher-timeframe (HTF) smoothing, bar coloring, and alert conditions.
Why combine MA + RSI
* The MA crossover is the primary trend signal (fast trend vs slow trend).
* RSI is a gate, not a second, separate signal. A crossover only becomes a trade signal if momentum agrees (e.g., RSI ≥ level for LONG, ≤ level for SHORT). This reduces weak crosses in ranging markets.
* The parts are integrated in one rule: *Crossover AND RSI condition (if enabled)* → plot signal/alert. No duplicated outputs or unrelated indicators.
How it works (logic)
* MA types: SMA / EMA / WMA / HMA (HMA is built via WMA of `len/2` and `len`, then WMA with `sqrt(len)`).
* Signals:
* LONG when *Fast MA crosses above Slow MA* and (if enabled) *RSI ≥ Long Min*.
* SHORT when *Fast MA crosses below Slow MA* and (if enabled) *RSI ≤ Short Max*.
* Repaint-safe (optional): confirms crosses on closed bars to avoid intrabar repaint.
* HTF (optional): computes MA/RSI on a higher timeframe to smooth noise on lower charts.
* Alerts: crossover alerts + state-flip (bull↔bear) alerts.
How to use (step-by-step)
1. Add to chart. Set MA Type, Fast and Slow (keep Fast < Slow).
2. Turn Use RSI Filter ON for confirmation (default: RSI 14 with 50/50 levels).
3. (Optional) Turn Repaint-Safe ON for close-confirmed signals.
4. (Optional) Turn HTF ON (e.g., 60 = 1h) for smoother signals on low TFs.
5. Enable alerts: pick “MAxRSI Long/Short” or “Bullish/Bearish State”.
Timeframe guidance
* Intraday (1–15m): EMA 9–20 fast vs EMA 50 slow, RSI filter at 50/50.
* Swing (1h–D): EMA 20 fast vs EMA 200 slow, RSI 50/50 (55/45 for stricter).
What makes it original
* Repaint-safe cross confirmation (previous-bar check) for reliable signals/alerts.
* HTF gating (doesn’t compute both branches) for speed and clarity.
* Warning-free MA helper (precomputes SMA/EMA/WMA/HMA each bar), HMA built from built-ins only.
* State-flip alerts and optional RSI overlay on price pane.
Built-ins used
`ta.sma`, `ta.ema`, `ta.wma`, (HMA built from these), `ta.rsi`, `ta.crossover`, `ta.crossunder`, `request.security`, `plot`, `plotshape`, `barcolor`, `alertcondition`, `input.*`, `math.*`.
Note: Indicator only (no orders). Test settings per symbol. Not financial advice.
⚠️ Disclaimer
This script is provided for educational purposes only.
Past performance does not guarantee future results.
Trading involves risk, and users should exercise caution and use proper risk management when applying this strategy.

Pullback & ATR Trailing Strategy※日本語は英文の次に記載あります。
Overview
This indicator combines short-term RSI pullback/rebound signals with long-term RSI divergence to visualize potential buy and sell opportunities.
It also plots ATR-based trailing stops and partial take-profit lines, making it suitable for day trading and short-term trading.
Alerts are triggered when signal conditions are met.
Key Features
Detect short-term RSI pullbacks/rebounds (default 6 periods)
Detect divergences on long-term RSI
Visualize buy/sell signals with labels
Display ATR-based trailing stop and partial take-profit lines
Trigger alerts when conditions are met
Settings Explanation
Short-term RSI Length (rsiShortLen) Period for short-term RSI used to detect pullbacks or rebounds
Pullback Threshold (levelLow) RSI level below which a buy signal is considered
Rebound Threshold (levelHigh) RSI level above which a sell signal is considered
Long-term Timeframe (longTF) Timeframe used for divergence detection
Long-term RSI Length (longRSILen) Period for RSI on the long-term timeframe, used for divergence detection
Pivot Width Left / Right (pivotLeft / pivotRight)
Determines how we detect swing highs/lows (peaks and valleys).
For example, with pivotLeft=3 and pivotRight=3, a bar is considered a swing high if it is higher than the 3 bars to its left and 3 bars to its right.
Larger numbers detect only bigger swings, smaller numbers also detect smaller swings.
ATR Length (atrLen) Period for ATR calculation for trailing stops
ATR Multiplier (atrMult) Multiplier for ATR to calculate trailing stop distance
Partial Take-Profit Multiplier (tpMult) Multiplier to calculate half-profit level based on swing amplitude
Green line (Long Trail / translucent green)
ATR-based trailing stop line for long positions.
Used as a stop-loss or trailing stop for open buy trades.
Dark green line shows partial take-profit (TP), translucent green shows trailing stop level.
Red line (Short Trail / translucent red)
ATR-based trailing stop line for short positions.
Used as a stop-loss or trailing stop for open sell trades.
Dark red line shows partial take-profit (TP), translucent red shows trailing stop level.
Note: TP lines indicate partial take-profit targets, while ATR trailing lines indicate stop-loss/trailing stop levels if the price moves against the position.
日本語説明ーーーーーーーーーーーーーーーーーーーーーーーーーーーー
概要
このインジケーターは、短期RSIの押し目/戻りシグナルと、長期足RSIによるダイバージェンスを組み合わせて、買い・売りのチャンスを可視化します。
さらに、ATRベースのトレールストップラインや半分利確ラインも表示し、デイトレードや短期トレードに最適化しています。
シグナル条件に一致した場合にアラートも作動します。
主な機能
短期RSI(デフォルト6期間)で押し目・戻りを検出
長期足RSIでのダイバージェンスを検出
BUY/SELLラベルでシグナルを視覚化
ATRベースのトレールライン・半分利確ラインを表示
条件一致時にアラート発動
各設定の説明
短期RSI期間 (rsiShortLen) デイトレ用の短期RSIの期間。押し目や戻りのシグナルに使用
押し目閾値 (levelLow) RSIが下回ったら買いシグナル判定に使用
戻り閾値 (levelHigh) RSIが上回ったら売りシグナル判定に使用
長期足 (longTF) ダイバージェンス判定用の長期足の時間軸
長期RSI期間 (longRSILen) 長期足で計算するRSIの期間。ダイバージェンス判定に使用
左右ピボット幅 (pivotLeft / pivotRight) 高値や安値を「スイングの山・谷」として判定する時に使う幅です。
例えば pivotLeft=3, pivotRight=3 の場合、「左に3本、右に3本のローソク足より高い/低い点」をスイングの頂点や底と見なします。
数値を大きくすると大きな波だけを拾い、小さくすると小さな波も拾いやすくなります。
ATR期間 (atrLen) トレールライン計算用ATRの期間
ATR倍率 (atrMult) トレールラインの距離をATRに掛ける倍率
半分利確倍率 (tpMult) 押し目/戻り幅に対して半分利確ラインを設定する倍率
緑の線(Long Trail / 半透明緑)
ATRベースのトレールストップラインです。
買いポジション中の損切り目安やトレーリングストップとして使います。
緑の濃い線は半分利確ライン(TP)、薄い緑の線はトレールストップの位置を示します。
赤い線(Short Trail / 半透明赤)
ATRベースのトレールストップラインです。
売りポジション中の損切り目安やトレーリングストップとして使います。
赤の濃い線は半分利確ライン(TP)、薄い赤の線はトレールストップの位置を示します。
補足:TP(Take Profit)線は半分利確の目安で、ATRトレールラインはポジションが逆行した時の損切り目安です。

Phantom Trend IndicatorOverview
The Phantom Trend Indicator (PTI) is a streamlined tool for identifying trend direction and strength. It blends zigzag-based trend detection with a volume profile to display a histogram showing price distance from the Point of Control (POC). Six distinct colors highlight trend states, with background highlights for extreme price zones. Ideal for stocks, forex, crypto, and futures across any timeframe.
Features:
Trend Detection: Uses zigzag fractals to identify uptrends and downtrends.
Histogram Colors: Six colors for trend strength (low, high, extreme for up/down trends) or neutral (gray).
Dynamic Levels: Plots POC, Value Area Low (VAL), and High (VAH) via volume profile.
Background Colors: Highlights overbought (above VAH) or oversold (below VAL) zones.
Alerts: Signals new trends.
How It Works:
Trends: Zigzag fractals define trend ranges, with price position setting histogram colors (low, high, or extreme).
Histogram: Shows price deviation from POC.
Background: Colors extreme zones outside VAL/VAH.
This indicator builds on traditional trend detectors and volume profiles by integrating them into a single, cohesive tool. Unlike standard momentum indicators that rely on moving averages, PTI uses zigzag fractals for more responsive trend identification, reducing lag in volatile markets. Compared to basic volume profile scripts, it adds trend-based color coding and background alerts for extremes, providing clearer visual cues for overbought/oversold conditions. The six distinct colors indicate trend strength, and customizable thresholds allow fine-tuning for different assets and timeframes, enhancing adaptability. Traders benefit from combined momentum and liquidity insights, helping spot reversals or continuations more reliably—making PTI a valuable, standalone addition for both novice and experienced users.
Settings
Trend Detector: Toggle alerts, adjust zigzag sensitivity, and set thresholds for low-to-high and extreme color transitions.
Dynamic Levels: Configure volume profile period, multiplier, accuracy, value area percent, and ATR-based channel width.
Visuals: Customize POC, VAL, VAH, and area fill colors.
Read Histogram: Uptrend colors show early, strong, or overextended moves; downtrend colors indicate early, weakening, or oversold conditions; gray for consolidation.
Background: Monitor for overbought/oversold color-coded signals.
Tune: Adjust zigzag or period settings for your timeframe/asset.
Tips
Shorten period for intraday, extend for swing trading.
Pair with other indicators for confirmation.
Notes:
Requires sufficient chart data for volume profile.
Test settings for low-volatility assets.
For informational use only, not financial advice. Test thoroughly, and happy trading!
