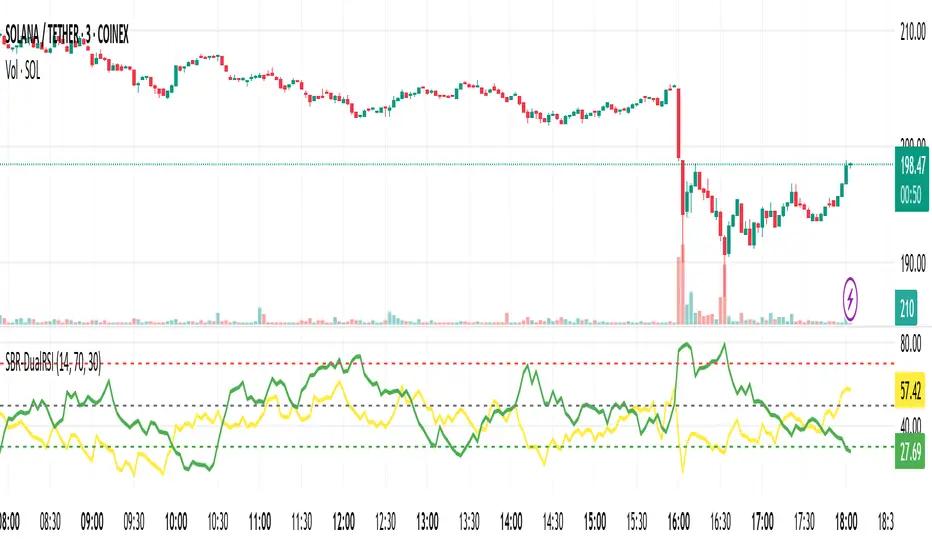
MVRV and RSI Std DevThis indicator provides a comprehensive, long-term view of market risk and opportunity for Bitcoin by combining fundamental on-chain data with classic momentum analysis.
How It Works:
The oscillator's value is calculated by multiplying two key metrics:
MVRV Ratio: An on-chain metric that indicates if the market price is "fair," "overvalued," or "undervalued" relative to the average price at which all coins last moved.
Weekly RSI: The standard Relative Strength Index on a weekly timeframe to measure long-term market momentum and identify overbought/oversold conditions.
Key Features:
Adaptive Risk Bands: Instead of fixed "overbought/oversold" levels, this indicator uses dynamic bands based on a long-term 4 year moving average and standard deviation. These bands automatically adjust to the market's changing volatility and cyclical nature, ensuring the risk/reward zones remain relevant over time.
Gradient Coloring: The oscillator line is colored on a smooth gradient from deep green (high reward/low risk) to bright red (high risk/low reward). This provides an intuitive, at-a-glance visualization of the market's "temperature."
Oscillatori

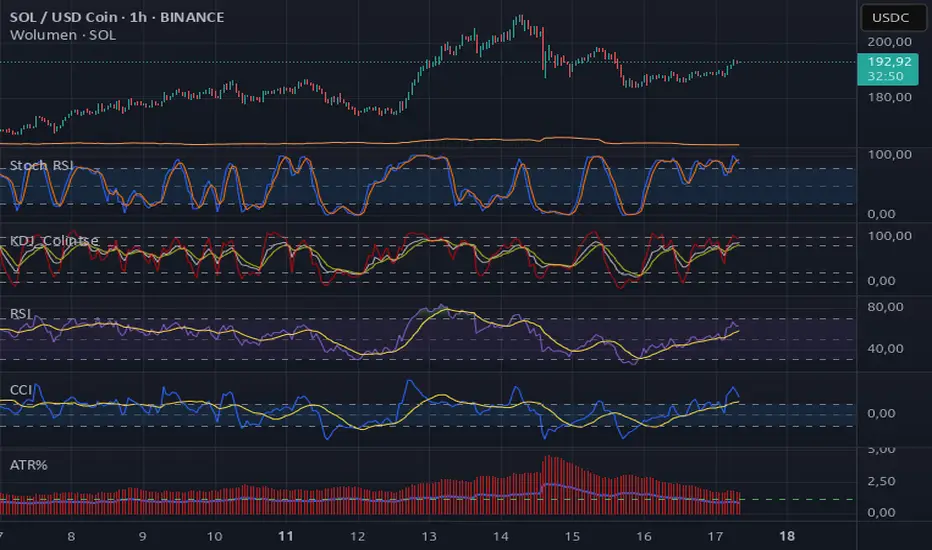
Adaptive MVRV & RSI Strategy V6 (Dynamic Thresholds)Strategy Explanation
This is an advanced Dollar-Cost Averaging (DCA) strategy for Bitcoin that aims to adapt to long-term market cycles and changing volatility. Instead of relying on fixed buy/sell signals, it uses a dynamic, weighted approach based on a combination of on-chain data and classic momentum.
Core Components:
Dual-Indicator Signal: The strategy combines two powerful indicators for a more robust signal:
MVRV Ratio: An on-chain metric to identify when Bitcoin is fundamentally over or undervalued relative to its historical cost basis.
Weekly RSI: A classic momentum indicator to gauge long-term market strength and identify overbought/oversold conditions.
Dynamic, Self-Adjusting Thresholds: The core innovation of this strategy is that it avoids fixed thresholds (e.g., "sell when RSI is 70"). Instead, the buy and sell zones are dynamically calculated based on a long-term (2-year) moving average and standard deviation of each indicator. This allows the strategy to automatically adapt to Bitcoin's decreasing volatility and changing market structure over time.
Weighted DCA (Scaling In & Out): The strategy doesn't just buy or sell a fixed amount. The size of its trades is scaled based on conviction:
Buying: As the MVRV and RSI fall deeper into their "undervalued" zones, the percentage of available cash used for each purchase increases.
Selling: As the indicators rise further into "overvalued" territory, the percentage of the current position sold also increases.
This creates an adaptive system that systematically accumulates during periods of fear and distributes during periods of euphoria, with the intensity of its actions directly tied to the extremity of market conditions.

Average True Range %The ATR% oscillator measures market volatility as a percentage of the closing price, smooths it using a chosen method (RMA, SMA, EMA, or WMA), and compares it to the threshold levels of 0.95% and 1.20%.
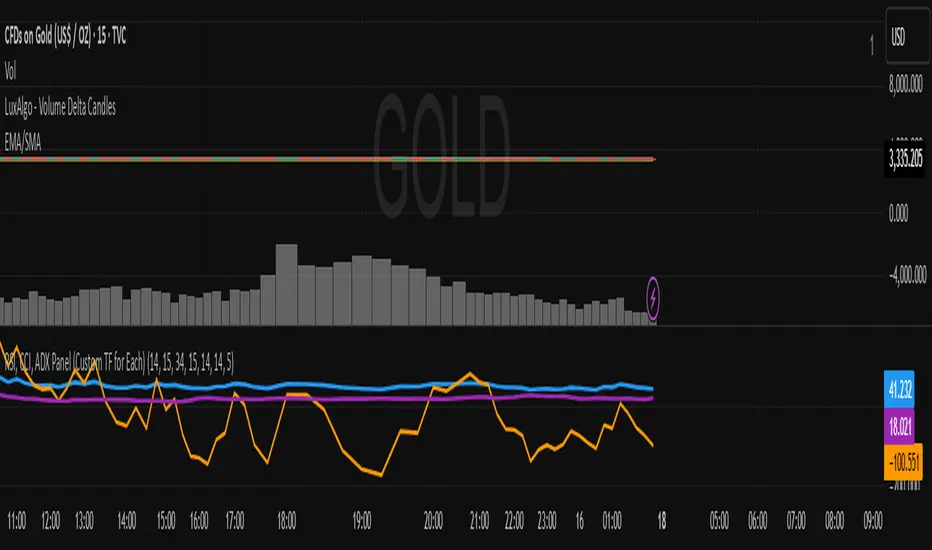
RSI, CCI, ADX Panel (Custom TF for Each)RSI, CCI, ADX Panel (Custom TF for Each)
This indicator combines RSI, CCI, and ADX into a single panel, allowing traders to view three key momentum/trend signals together. Each indicator can be calculated on its own custom timeframe, making it useful for multi-timeframe analysis.
Features:
RSI (Relative Strength Index): Measures momentum, useful for identifying overbought/oversold conditions.
CCI (Commodity Channel Index): Detects cyclical movements and potential reversals.
ADX (Average Directional Index): Evaluates trend strength without regard to direction.
Independent timeframe selection for RSI, CCI, and ADX.
Distinct colors for each indicator (RSI = Blue, CCI = Orange, ADX = Purple).
Single consolidated panel for compact analysis.
This tool is designed to give a multi-perspective view of market strength, momentum, and trend in one place.
Becak I-series: Indicator Floating Panels v.80Becak I-series: Floating Panels v.80th (Indonesia Independence Days)
What it does:
This indicator creates three floating overlay panels that display MACD, RSI, and Stochastic oscillators directly on your price chart. Unlike traditional separate panes, these panels hover over your chart with customizable positioning and transparency, providing a clean, space-efficient way to monitor multiple technical indicators simultaneously.
When to use:
When you need to monitor momentum, trend strength, and overbought/oversold conditions without cluttering your workspace
Perfect for traders who want quick visual access to multiple oscillators while maintaining focus on price action
Ideal for any timeframe and asset class (stocks, crypto, forex, commodities)
How it works:
The script calculates standard MACD (12,26,9), RSI (14), and Stochastic (14,3,3) values, then renders them as floating panels with:
MACD Panel: Shows MACD line (blue), Signal line (orange), and histogram (green/red bars)
RSI Panel: Displays RSI line (purple) with overbought (70) and oversold (30) reference levels
Stochastic Panel: Shows %K (blue) and %D (orange) lines with optional buy/sell signals and highlighted overbought/oversold zones
Customization options:
Position: Choose Top, Bottom, or Auto-Center placement
Size: Adjust panel height (15-35% of chart) and spacing between panels
Positioning: Fine-tune vertical center offset and horizontal positioning
Appearance: Toggle panel backgrounds and adjust transparency (50-95%)
Parameters: Modify all indicator lengths and overbought/oversold levels
Signals: Enable/disable Stochastic crossover signals
Display: Control lookback period (30-100 bars) and right margin spacing
Universal compatibility: Works seamlessly across all asset types with automatic range detection and scaling.
DIRGAHAYU HARI KEMERDEKAAN KE 80 - INDONESIA ... MERDEKA!!!!!

Institution Accumulation/DistributionLeveraging the Williams%R oscillator, the script has been optimized to pick out key turning point in the market specifically at Resistance (Overbought) or Support (Oversold)
The algo has been programmed to print both buy and sell alerts at extremes/when conditions flip eg a long position will be closed simultaneously opening a short position above resistance.
Best used as a scalping tool targeting 30m and below works well with currency pairs

Nifty Power -> Nifty 50 chart + EMA of RSI + avg volume strategyThis strategy works in 1 hour candle in Nifty 50 chart. In this strategy, upward trade takes place when there is a crossover of RSI 15 on EMA50 of RSI 15 and volume is greater than volume based EMA21. On the other hand, lower trade takes place when RSI 15 is less than EMA50 of RSI 15. Please note that there is no stop loss given and also that the trade will reverse as per the trend. Sometimes on somedays, there will be no trades. Also please note that this is an Intraday strategy. The trade if taken closes on 15:15 in Nifty 50. This strategy can be used for swing trading. Some pine script code such as supertrend and ema21 of close is redundant. Try not to get confused as only EMA50 of RSI 15 is used and EMA21 of volume is used. I am using built-in pinescript indicators and there is no special calculation done in the pine script code. I have taken numbars variable to count number of candles. For example, if you have 30 minuite chart then numbars variable will count the intraday candles accordingly and the same for 1 hour candles.

Currency Strength v3.0Currency Strength v3.0
Summary
The Currency Strength indicator is a powerful tool designed to gauge the relative strength of major and emerging market currencies. By plotting the True Strength Index (TSI) of various currency indices, it provides a clear visual representation of which currencies are gaining momentum and which are losing it. This indicator automatically detects the currency pair on your chart and highlights the corresponding strength lines, simplifying analysis and helping you quickly identify potential trading opportunities based on currency dynamics.
Key Features
Comprehensive Currency Analysis: Tracks the strength of 19 currencies, including major pairs and several emerging market currencies.
Automatic Pair Detection: Intelligently identifies the base and quote currency of the active chart, automatically highlighting the relevant strength lines.
Dynamic Coloring: The base currency is consistently colored blue, and the quote currency is colored gold, making it easy to distinguish between the two at a glance.
Non-Repainting TSI Calculation: Uses the True Strength Index (TSI) for smooth and reliable momentum readings that do not repaint.
Customizable Settings: Allows for adjustment of the fast and slow periods for the TSI calculation to fit your specific trading style.
Clean Interface: Features a minimalist legend table that only displays the currencies relevant to your current chart, keeping your workspace uncluttered.
How It Works
The indicator pulls data from major currency indices (like DXY for the US Dollar and EXY for the Euro). For currencies that don't have a dedicated index, it uses their USD pair (e.g., USDCNY) and inverts the calculation to derive the currency's strength relative to the dollar. It then applies the True Strength Index (TSI) to this data. The TSI is a momentum oscillator that is less volatile than other oscillators, providing a more reliable measure of strength. The resulting values are plotted on the chart, allowing you to see how different currencies are performing against each other in real-time.
How to Use
Trend Confirmation: When the base currency's line is rising and above the zero line, and the quote currency's line is falling, it can confirm a bullish trend for the pair. The opposite would suggest a bearish trend.
Identifying Divergences: Look for divergences between the currency strength lines and the price action of the pair. For example, if the price is making higher highs but the base currency's strength is making lower highs, it could signal a potential reversal.
Crossovers: A crossover of the base and quote currency lines can signal a shift in momentum. A bullish signal occurs when the base currency line crosses above the quote currency line. A bearish signal occurs when it crosses below.
Overbought/Oversold Levels: The horizontal dashed lines at 0.5 and -0.5 can be used as general guides for overbought and oversold conditions, respectively. Strength moving beyond these levels may indicate an unsustainable move that is due for a correction.
Settings
Fast Period: The short-term period for the TSI calculation. Default is 7.
Slow Period: The long-term period for the TSI calculation. Default is 15.
Index Source: The price source used for the calculations (e.g., Close, Open). Default is Close.
Base Currency Color: The color for the base currency line. Default is Royal Blue.
Quote Currency Color: The color for the quote currency line. Default is Goldenrod.
Disclaimer
This indicator is intended for educational and analytical purposes only. It is not financial advice. Trading involves substantial risk, and past performance is not indicative of future results. Always conduct your own research and risk management before making any trading decisions.

RSI + MACD Combo (sajadbagheri)The "RSI+MACD Persian Combo" integrates two classic oscillators with smart normalization. It detects overbought/oversold zones, MACD/RSI convergences, and highlights high-probability reversals using Z-Score scaling. Customizable alerts provide trade-ready signals.
Created by: Sajad Bagheri

SatoshiMultiFrame RSI SatoshiMultiFrame 📈
SatoshiMultiFrame is an advanced, multi-timeframe version of the RSI indicator, designed to look and feel like the built-in TradingView RSI — but with more customization options and professional visual enhancements.
🎯 Features
Multi-Timeframe (MTF) Support – choose any timeframe for RSI calculation.
Customizable RSI Line – change color, thickness, and style (Solid / Dashed / Dotted).
Editable 30 / 50 / 70 Bands – fully customizable in the Style tab.
Smooth Gradient Fill for OB/OS Zones:
🟢 Green shading above Overbought (70)
🔴 Red shading below Oversold (30)
Customizable background for the entire panel.
No repainting – stable and reliable data.
⚙️ Inputs
RSI Length – default 14.
Source – select the price source (Close, Open, etc.).
RSI Timeframe – pick a higher or lower timeframe.
RSI Line Style – choose between Solid / Dashed / Dotted.
Dash Period & Dash Length – adjust the look of dashed lines.
🎨 Style Tab :
Change RSI line color, thickness, and optional MA line.
Edit colors and styles of 30 / 50 / 70 bands.
Enable/disable and recolor OB/OS gradient fills.
Adjust background color and transparency.
📌 How to Use :
Add the indicator to your chart.
In Inputs, set your preferred timeframe, RSI length, and line style.
In Style, adjust colors, thickness, and gradient effects to your preference.
Use the 50 line as a trend reference and monitor RSI behavior in OB/OS zones.
⚠️ Disclaimer: This tool is for educational purposes only and should not be considered financial advice. Always practice proper risk management.

Correlation Heatmap Matrix [TradingFinder] 20 Assets Variable🔵 Introduction
Correlation is one of the most important statistical and analytical metrics in financial markets, data mining, and data science. It measures the strength and direction of the relationship between two variables.
The correlation coefficient always ranges between +1 and -1 : a perfect positive correlation (+1) means that two assets or currency pairs move together in the same direction and at a constant ratio, a correlation of zero (0) indicates no clear linear relationship, and a perfect negative correlation (-1) means they move in exactly opposite directions.
While the Pearson Correlation Coefficient is the most common method for calculation, other statistical methods like Spearman and Kendall are also used depending on the context.
In financial market analysis, correlation is a key tool for Forex, the Stock Market, and the Cryptocurrency Market because it allows traders to assess the price relationship between currency pairs, stocks, or coins. For example, in Forex, EUR/USD and GBP/USD often have a high positive correlation; in stocks, companies from the same sector such as Apple and Microsoft tend to move similarly; and in crypto, most altcoins show a strong positive correlation with Bitcoin.
Using a Correlation Heatmap in these markets visually displays the strength and direction of these relationships, helping traders make more accurate decisions for risk management and strategy optimization.
🟣 Correlation in Financial Markets
In finance, correlation refers to measuring how closely two assets move together over time. These assets can be stocks, currency pairs, commodities, indices, or cryptocurrencies. The main goal of correlation analysis in trading is to understand these movement patterns and use them for risk management, trend forecasting, and developing trading strategies.
🟣 Correlation Heatmap
A correlation heatmap is a visual tool that presents the correlation between multiple assets in a color-coded table. Each cell shows the correlation coefficient between two assets, with colors indicating its strength and direction. Warm colors (such as red or orange) represent strong negative correlation, cool colors (such as blue or cyan) represent strong positive correlation, and mid-range tones (such as yellow or green) indicate correlations that are close to neutral.
🟣 Practical Applications in Markets
Forex : Identify currency pairs that move together or in opposite directions, avoid overexposure to similar trades, and spot unusual divergences.
Crypto : Examine the dependency of altcoins on Bitcoin and find independent movers for portfolio diversification.
Stocks : Detect relationships between stocks in the same industry or find outliers that move differently from their sector.
🟣 Key Uses of Correlation in Trading
Risk management and diversification: Select assets with low or negative correlation to reduce portfolio volatility.
Avoiding overexposure: Prevent opening multiple positions on highly correlated assets.
Pairs trading: Exploit temporary deviations between historically correlated assets for arbitrage opportunities.
Intermarket analysis: Study the relationships between different markets like stocks, currencies, commodities, and bonds.
Divergence detection: Spot when two typically correlated assets move apart as a possible trend change signal.
Market forecasting: Use correlated asset movements to anticipate others’ behavior.
Event reaction analysis: Evaluate how groups of assets respond to economic or political events.
❗ Important Note
It’s important to note that correlation does not imply causation — it only reflects co-movement between assets. Correlation is also dynamic and can change over time, which is why analyzing it across multiple timeframes provides a more accurate picture. Combining correlation heatmaps with other analytical tools can significantly improve the precision of trading decisions.
🔵 How to Use
The Correlation Heatmap Matrix indicator is designed to analyze and manage the relationships between multiple assets at once. After adding the tool to your chart, start by selecting the assets you want to compare (up to 20).
Then, choose the Correlation Period that fits your trading strategy. Shorter periods (e.g., 20 bars) are more sensitive to recent price movements, making them suitable for short-term trading, while longer periods (e.g., 100 or 200 bars) provide a broader view of correlation trends over time.
The indicator outputs a color-coded matrix where each cell represents the correlation between two assets. Warm colors like red and orange signal strong negative correlation, while cool colors like blue and cyan indicate strong positive correlation. Mid-range tones such as yellow or green suggest correlations that are close to neutral. This visual representation makes it easy to spot market patterns at a glance.
One of the most valuable uses of this tool is in portfolio risk management. Portfolios with highly correlated assets are more vulnerable to market swings. By using the heatmap, traders can find assets with low or negative correlation to reduce overall risk.
Another key benefit is preventing overexposure. For example, if EUR/USD and GBP/USD have a high positive correlation, opening trades on both is almost like doubling the position size on one asset, increasing risk unnecessarily. The heatmap makes such relationships clear, helping you avoid them.
The indicator is also useful for pairs trading, where a trader identifies assets that are usually correlated but have temporarily diverged — a potential arbitrage or mean-reversion opportunity.
Additionally, the tool supports intermarket analysis, allowing traders to see how movements in one market (e.g., crude oil) may impact others (e.g., the Canadian dollar). Divergence detection is another advantage: if two typically aligned assets suddenly move in opposite directions, it could signal a major trend shift or a news-driven move.
Overall, the Correlation Heatmap Matrix is not just an analytical indicator but also a fast, visual alert system for monitoring multiple markets at once. This is particularly valuable for traders in fast-moving environments like Forex and crypto.
🔵 Settings
🟣 Logic
Correlation Period : Number of bars used to calculate correlation between assets.
🟣 Display
Table on Chart : Enable/disable displaying the heatmap directly on the chart.
Table Size : Choose the table size (from very small to very large).
Table Position : Set the table location on the chart (top, middle, or bottom in various alignments).
🟣 Symbol Custom
Select Market : Choose the market type (Forex, Stocks, Crypto, or Custom).
Symbol 1 to Symbol 20: In custom mode, you can define up to 20 assets for correlation calculation.
🔵 Conclusion
The Correlation Heatmap Matrix is a powerful tool for analyzing correlations across multiple assets in Forex, crypto, and stock markets. By displaying a color-coded table, it visually conveys both the strength and direction of correlations — warm colors for strong negative correlation, cool colors for strong positive correlation, and mid-range tones such as yellow or green for near-zero or neutral correlation.
This helps traders select assets with low or negative correlation for diversification, avoid overexposure to similar trades, identify arbitrage and pairs trading opportunities, and detect unusual divergences between typically aligned assets. With support for custom mode and up to 20 symbols, it offers high flexibility for different trading strategies, making it a valuable complement to technical analysis and risk management.

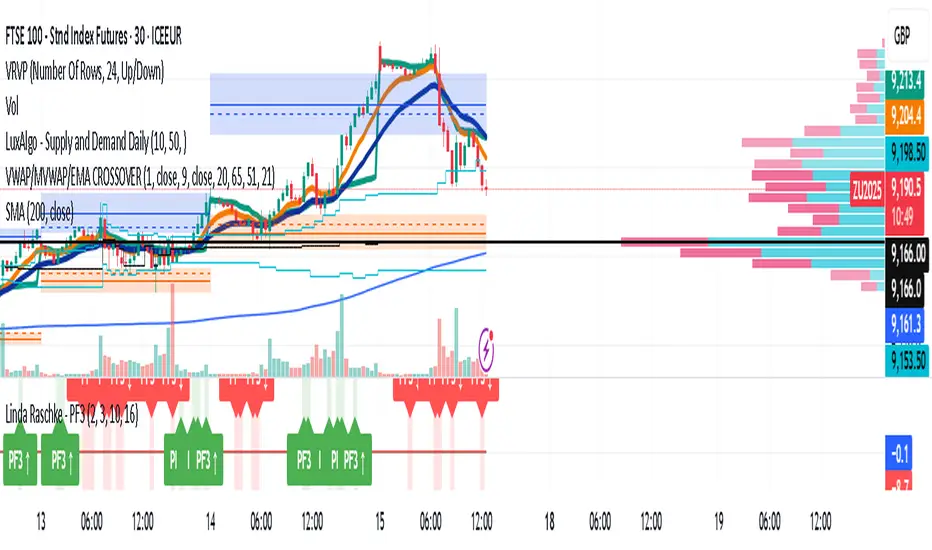
Linda Raschke - PF3This is PF3 indicator where there are confluence agreement of 3 oscillators. Means the market is giving its most!
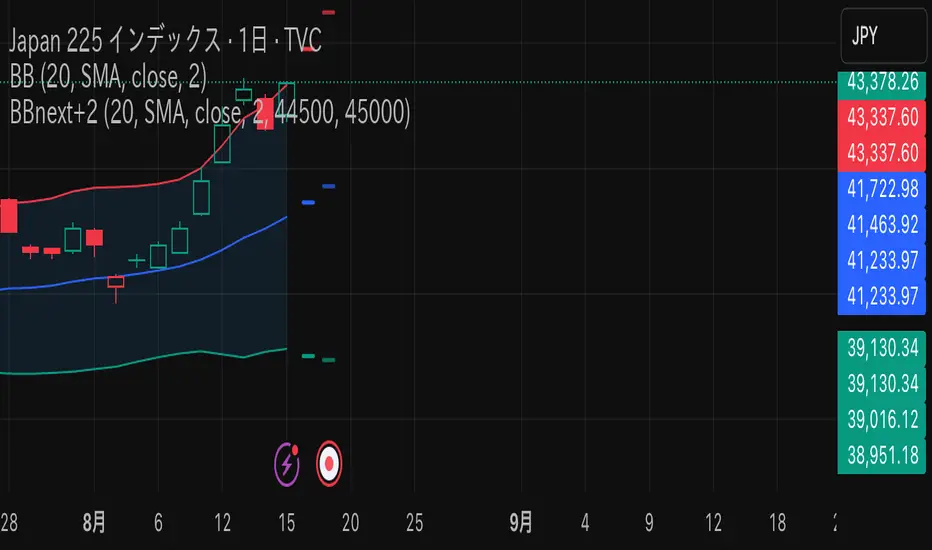
BB next+2This indicator extends the standard Bollinger Bands by allowing you to project future Bollinger Bands based on assumed closing prices for the next trading day (+1) and the day after (+2).
Key Features:
Plots standard Bollinger Bands (supports SMA, EMA, etc.)
Allows manual input of assumed closing prices for the next trading day (+1) and the day after (+2)
Displays projected Bollinger Bands (basis, upper, and lower) based on the input values
Option to restrict display to the latest bar or confirmed bars only
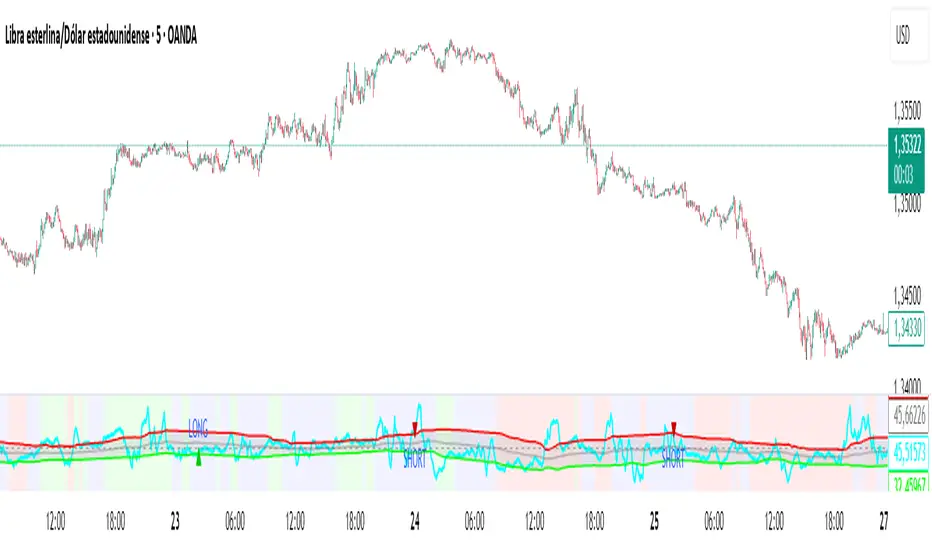
New RSI📌 New RSI
The New RSI is a modern, enhanced version of the classic RSI created in 1978 — redesigned for today’s fast-moving markets, where algorithmic trading and AI dominate price action.
This indicator combines:
Adaptive RSI: Adjusts its calculation length in real time based on market volatility, making it more responsive during high volatility and smoother during calm periods.
Dynamic Bands: Upper and lower bands calculated from historical RSI volatility, helping you spot overbought/oversold conditions with greater accuracy.
Trend & Regime Filters: EMA and ADX-based detection to confirm signals only in favorable market conditions.
Volume Confirmation: Signals appear only when high trading volume supports the move — green volume for bullish setups and red volume for bearish setups — filtering out weak and unreliable trades.
💡 How it works:
A LONG signal appears when RSI crosses above the lower band and the volume is high with a bullish candle.
A SHORT signal appears when RSI crosses below the upper band and the volume is high with a bearish candle.
Trend and higher timeframe filters (optional) can help improve precision and adapt to different trading styles.
✅ Best Use Cases:
Identify high-probability reversals or pullbacks with strong momentum confirmation.
Avoid false signals by trading only when volume validates the move.
Combine with your own support/resistance or price action strategy for even higher accuracy.
⚙️ Fully Customizable:
Adjustable RSI settings (length, volatility adaptation, smoothing)
Dynamic band sensitivity
Volume threshold multiplier
Higher timeframe RSI filter
Color-coded background for market regime visualization
This is not just another RSI — it’s a complete, next-gen momentum tool designed for traders who want accuracy, adaptability, and confirmation in every signal.
BTC/Dominance RSI by Sajad BagheriTitle: "BTC/Dominance RSI by Sajad Bagheri"
Description: "Combines BTC Price RSI (Red) and BTC Dominance RSI (Green) to detect trend conflicts and overbought/oversold conditions."
Category: Oscillators
Tags: #BTC, #Dominance, #RSI, #Bitcoin
Access: Public/Private

BTC/Dominance RSI by Sajad BagheriTitle: "BTC/Dominance RSI by Sajad Bagheri"
Description: "Combines BTC Price RSI (Red) and BTC Dominance RSI (Green) to detect trend conflicts and overbought/oversold conditions."
Category: Oscillators
Tags: #BTC, #Dominance, #RSI, #Bitcoin
Access: Public/Private