TKP T3 Trend With Psar BarcolorThis script is adapted from TKP's long/short indicator to initiate buy/sell indications when price crosses the T3 moving averages, and when the T3's themselves cross. Bars change colors based on price over/under T3 and T3 up or down or This allows for simple visual analysis of trend direction along with entries, exits, and stop loss values.
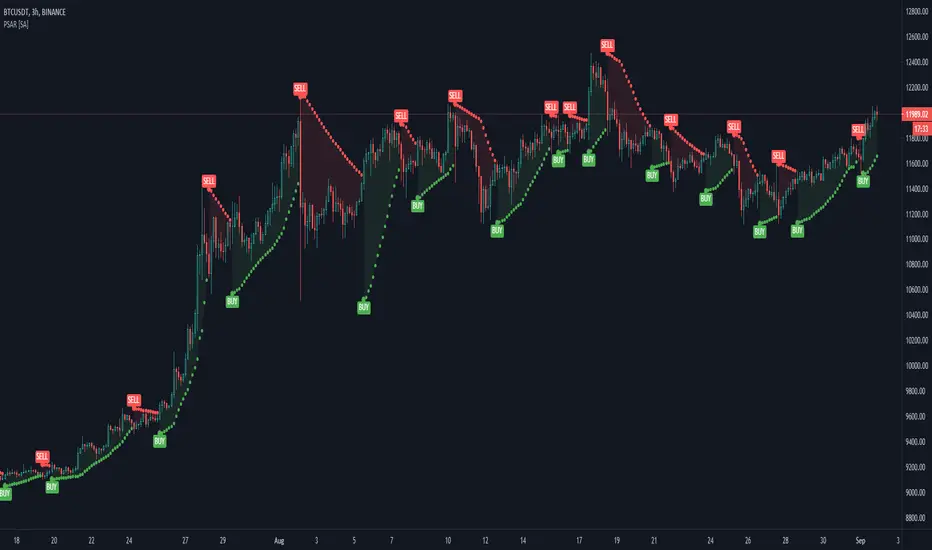
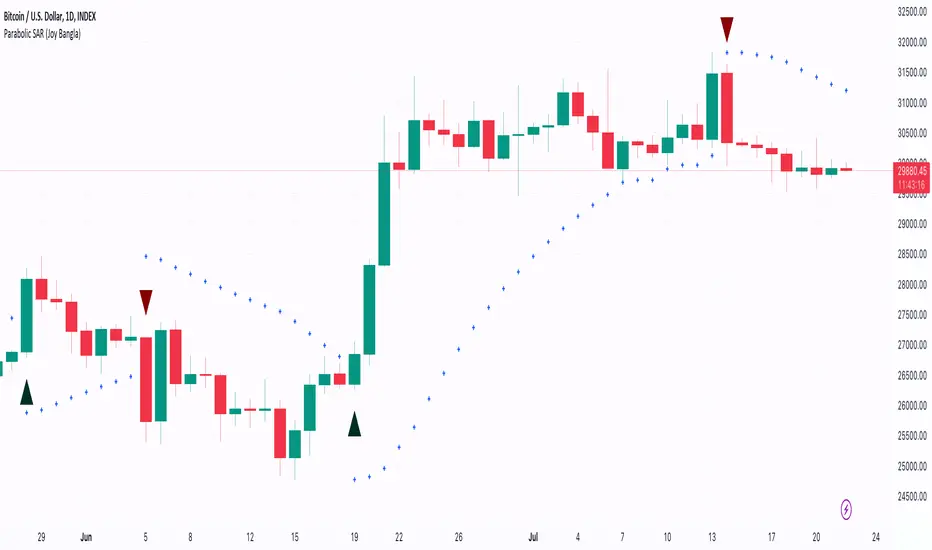
Parabolic Stop and Reverse (PSAR)

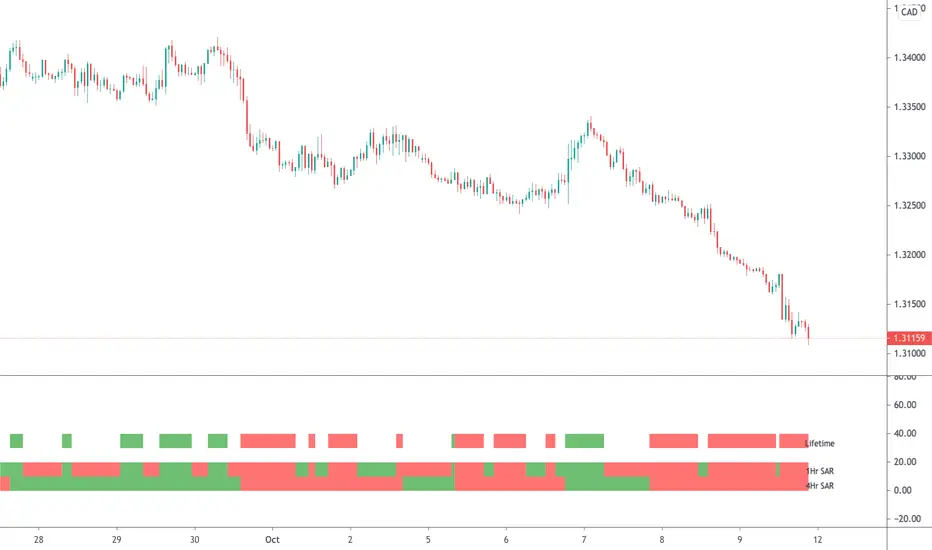
Parabolic SAR (MTF)This is a multi-timeframe Parabolic SAR indicator which uses 1 and 4 hour charts.
Using this indicator is simple, if the LifeTime line is green then buy, if red then sell OR don't trade. So...
Green Line - This strategy is in a buy position
Red Line - This strategy is in a sell position
Any other colour - DON'T TRADE
The traders approach is simple, when all indicators are green or red, then take the trade. As soon as one indicator changes, then re-evaluate using your normal process, such as price action, to determine whether to close the trade or continue.
If you require any further information or script modifications, please message me.
PLEASE CHECK OUT MY OTHER SCRIPTS
Supertrend (MTF) & Parabolic SAROne of my mixed approach strategy indicators which includes:
- Parabolic SAR
- 1 Hour Supertrend
- 4 Hour Supertrend
Whilst this script may appear slow due to the 4hr Supertrend, it does a great job of managing breakouts.
Using this indicator is simple, if the line labeled Lifetime is green then buy, if red then sell OR don't trade. So...
Green Line - This strategy is in a buy position
Red Line - This strategy is in a sell position
Any other Color - DON'T TRADE
The traders approach is simple, when all indicators are green or red, then take the trade. As soon as one indicator changes, then re-evaluate using your normal process, such as price action, to determine whether to close the trade or continue.
If you require any further information or script modifications, please message me.
PLEASE CHECK OUT MY OTHER SCRIPTS

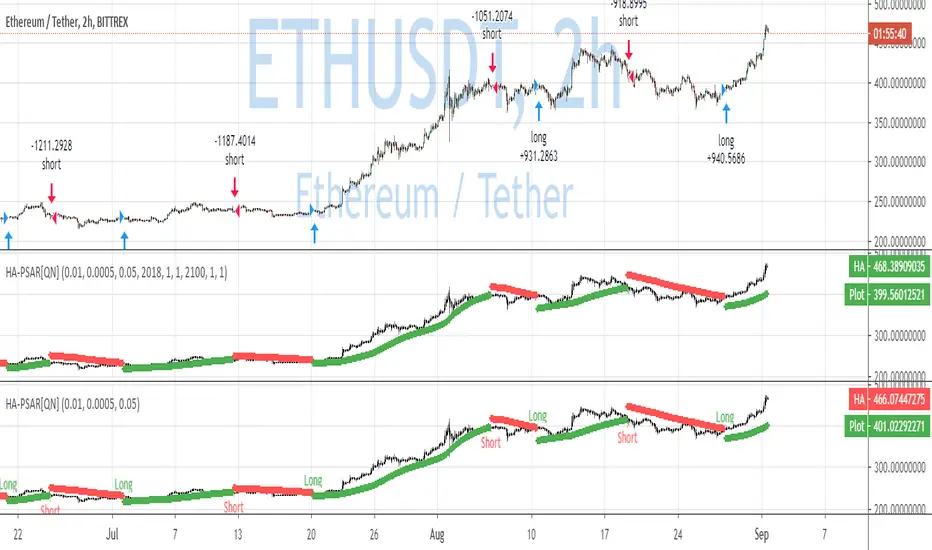
QuantNomad - Heikin-Ashi PSAR AlertsUsing this script you can create alerts for my Heikin-Ashi PSAR Strategy:
When creating alerts use "Once Per Bar Close" in parameters.
####################
Disclaimer
Please remember that past performance may not be indicative of future results.
Due to various factors, including changing market conditions, the strategy may no longer perform as good as in historical backtesting.
This post and the script don’t provide any financial advice.
Gastitan MA-cross/RSI/PSARThis script gives
moving average cross alert
RSI alert when change from bull to bear, and viceverse
Parabolic sar indicator
Also you have a panel with the current price and RSI values.

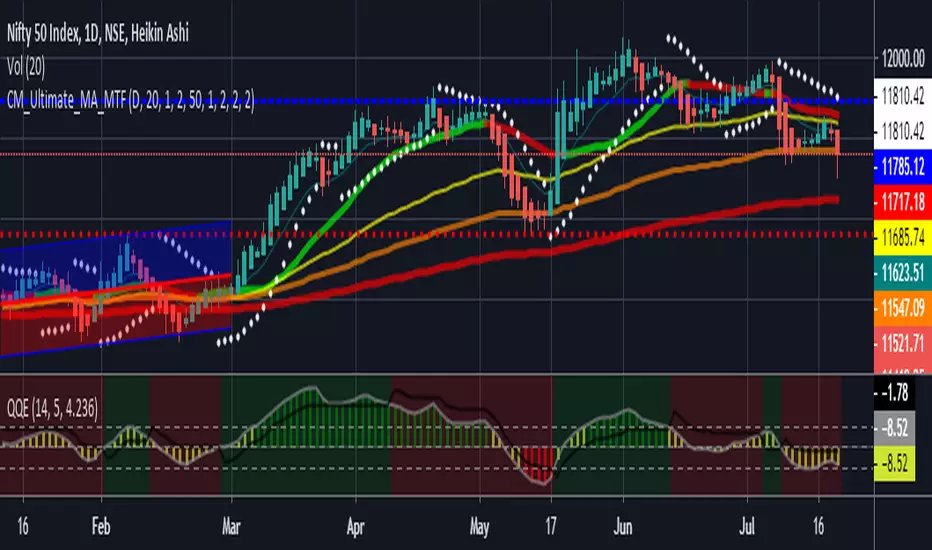
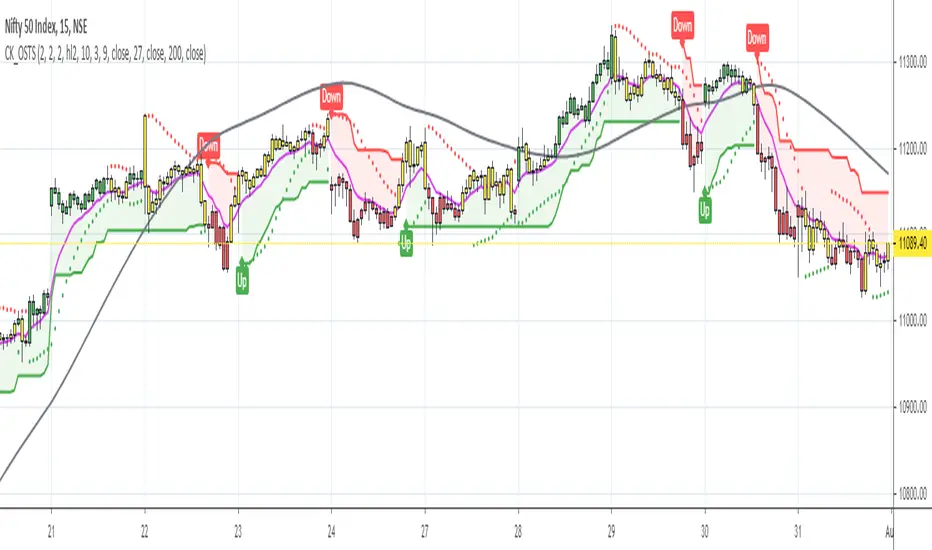
One-Stop Trading SetupOne-Stop Trading Setup:
This script designed to identify up, down, and sideways trends. 200 HMA, 9 EMA, PSAR, and ATR are used to identify the strength of any instrument.
Candle Colors - Simpler approach to follow:
Green color indicates for up side trade signals
Red color indicates for down side trade signals
Yellow color can be interpreted for stop, sideways, and counter trade trade signals
Multiple Trade Setups:
Green Zone - Trading green candles within green zone has better odds of long trades
Red Zone - Trading red candles within red zone has better odds of short trades
200 HMA - Candles above 200 HMA mostly for long trades. Candles below 200 HMA usually for short trades. But the zone also very important to consider
9 EMA - Cross over above 200 HMA in Green zone, look for long trades. Cross over below 200 HMA in red zone, look for short trades
PSAR - This can be used as potential initial warning sign. Also can be used to exit partial or wait for it goes to opposite side for taking trade decisions
Candle Above all - If Green candle and above all the indicators, then very good sign of long side. If red candle and below all indicators, then very good sign of short side.
Multiple Time Frame:
This works very well with any instrument and on any time frame. Always its better to do analysis on multi time frame before entry, exit, and trade execution. Back test it with this setup and also observe it on live market. That will give edge in taking trade decisions. All the best and happy trading.
Disclaimer:
This script and setup is written with the sole purpose of identifying the strength of any instrument. Interpretation, trade decisions, and changing inputs are up to each individual users/trades.
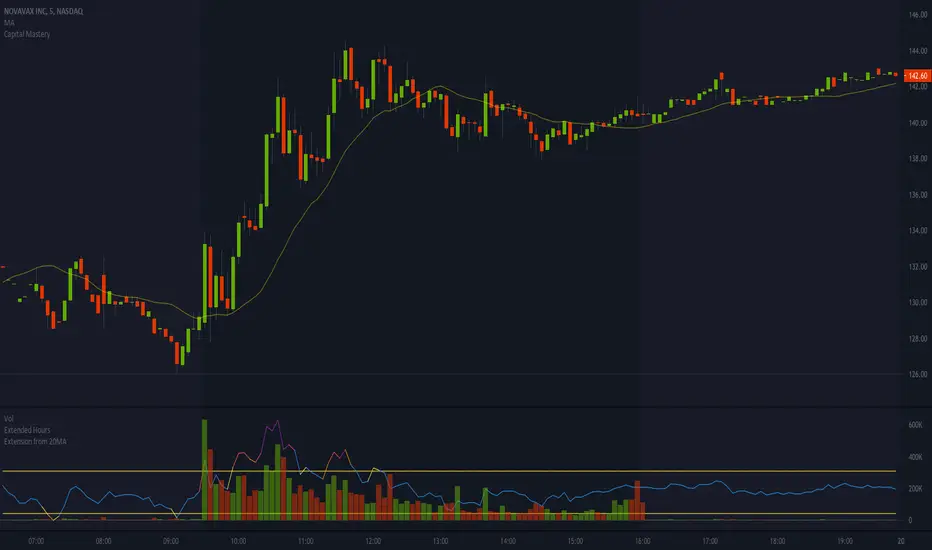
Extension from 20 Period Simple Moving AverageSimple indicator to help show when stocks are over extended intraday. It's based on the distance between a stock and it's moving average. The thesis being that, the farther away a stock is from it's 20 period simple moving average, the move extended it is. I've found that when a stock is more than 2-3% extended from it's 5min 20 period moving average, it's typically getting over extended, and can be a great time to start considering a short.
I primarily use this indicator when shorting intraday parabolic moves, while the stock is still on the frontside of the move. Note that this works best when the indicator is showing overextended AND there's a volume spike/mountain matching the overextension. In the attached example, you can see that I overlay this indicator on top of the volume panel because it helps me better visualize when the stock is getting over extended on heavy/elevated volume.
Hope this helps; any feedback is appreciated!
P.S. This works best on a 5min chart, but I'm sure it could be helpful on other timeframes, but may need to tweak the default outer bounds percentage.
mForex - 3 Moving Average - Parabolic SARScript identifies the uptrend and downtrend according to the average price of the MA and PSAR lines.
Rules of sale:
- Open short positions when:
MA12 cuts MA26 and MA52 from the top.
PSAR dots on the price line
- Stop loss:
At the dots of PSAR and use Trailing Stop facing up
On the nearest peak
- Profit-taking: Corresponding ratio of R: R (1: 2)
- Open long positions when:
MA12 cuts MA26 and MA52 from the bottom.
PSAR dots below the price line
- Stop loss:
At the dots of PSAR and use Trailing Stop facing down
Below the nearest peak
- Profit-taking: Corresponding ratio of R: R (1: 2)

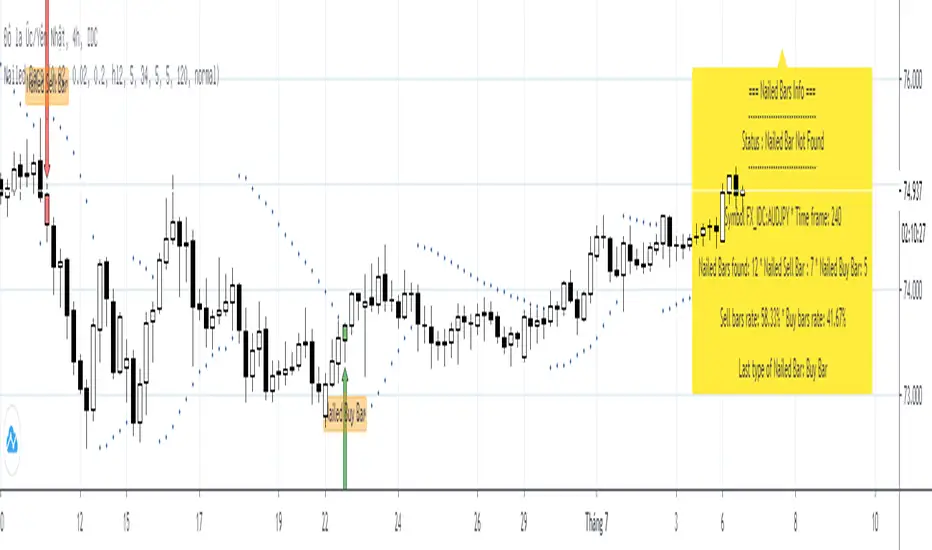
Nailed BarsNailed bars was introduced by Joy22 in an article "Pip Nailer Trading System" submit on forexstrategiesresources on 06/01/2012
Rule of Nailed Bars is below:
1. Nailed Sell Bar:
* PSAR appears above the bar
* The Awesome Oscillator (AO) turns red
* The Accelerator Oscillator (AC) turns red
2. Nailed Buy Bar:
* PSAR appears below the bar
* The Awesome Oscillator (AO) turns green
* The Accelerator Oscillator (AC) turns green
=== About this indicator: Nailed Bars ===
This indicator is detecting all nailed bars was appeared on chart and display infomations in a panel. So traders who are using "Pip Nailer Trading System" can easily control the trade.
Candle Color GeneratorCandle Color Generator:
This indicator is designed to highlight the candle colors based on the combinations of Parabolic SAR (PSAR) and 2 Hull Moving Averages (HMA).
Colors:
Yellow, Red, and Green colors are used to describe the candle colors depends on its position to PSAR and 2 HMAs.
PSAR:
PSAR position above or below candle position is differentiated by Red and Green colors
HMAs:
As default settings 20 HMA is considered as lower period and 50 HMA is considered period for the calculation
Trade What You See:
This indicator will help to see how the setup of particular instrument coming up. Users/Traders can use and trade based on what they see and interpret from it.
Disclaimer:
Idea of publishing this script is to identify the strength of the instrument using multiple confirmation.
Using this indicator, changing inputs (show/hide/change period), and trading decisions are up to the users/traders.
Courtesy:
Thanks to inventors of HMA (Alan Hull), PSAR(Welles Wilder) as these inputs are used to make some calculations

Power PSARParabolic SAR can reverse often in choppy environments. Power PSAR will indicate only when there's sufficient slope that cuts through the prior PSAR trend lines.

Validated PSARPSAR works well as trailing stop loss (or WinStop), but is often whipsaw'd as it detect trend changes over enthusiastically.
So, a filter to validate trend changes was added. It basically requires 3 straight bars completely breaking the prior saved PSAR level.
Enjoy!

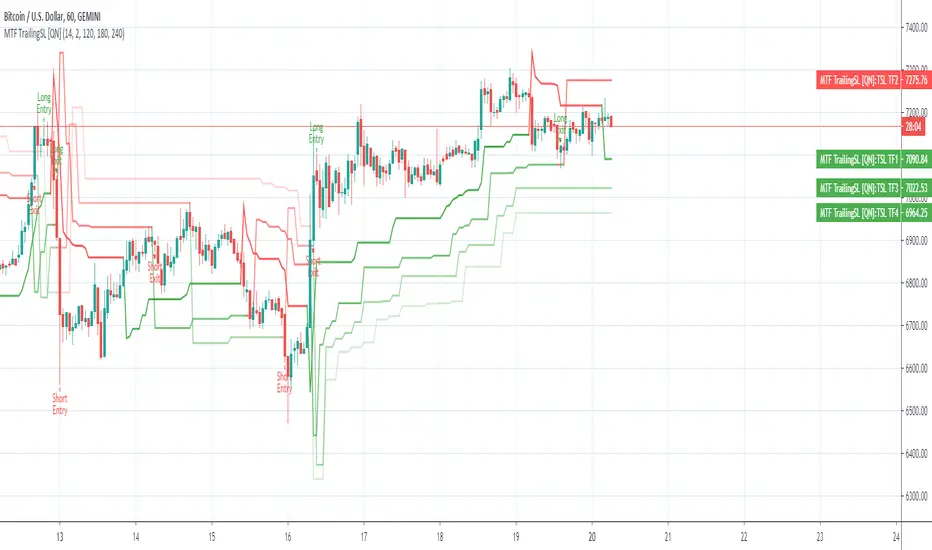
MTF Trailing SL Alerts [QuantNomad]These are alerts for my MTF Trailing SL Strategy.
Entry Long position if all 4 time-frames agree on the long signal.
Exit Long positions when at least 2 time-frames disagree on the long signals.
Entry to Short position if all 4 time-frames agree on Short signal.
Exit from Short positions when at least 2 time-frames disagree on Short signal.
Use "Once Per Bar Close" when creating alerts.
Link to the strategy:
TKP Short/Long IndicatorThis script uses T3 Moving averages and a modified Parabolic Sar Calculation to help Identify trend reversals, but can also keep you in the predominant direction of strong trending price action.

Parabolic SAR Alerts (on close) [QuantNomad]This is study with alerts for my previously published strategy:
Use "Once Per Bar Close" alerts.

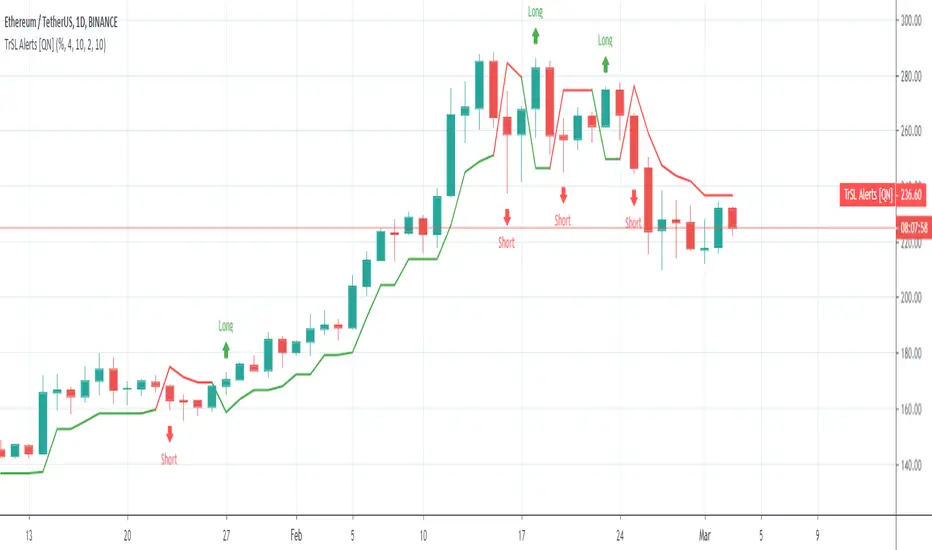
Trailing SL Alerts [QuantNomad]It's alerts version of my Trailing SL strategy:
Use "Once Per Bar" param when creating alerts.
Pivot Boss 4 EMA + BB + Parabolic SAR + IchimokuA combination of a few of my favorite indicators.
1) Pivot Boss 4 EMA
2) Bollinger Bands
3) Parabolic SAR
4) Ichimoku Cloud
All credit to original authors.

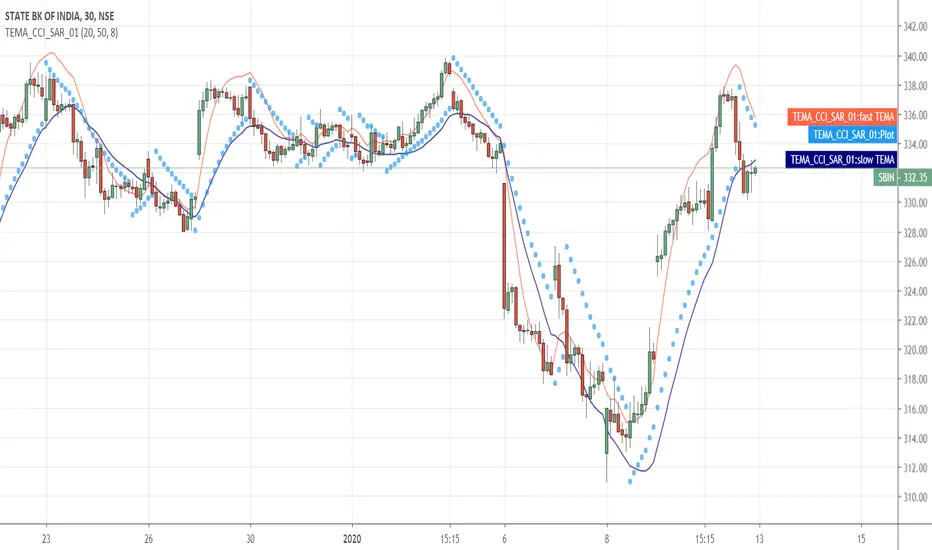
TEMA_CCI_SAR_01This strategy is using TEMA and PSAR for buying selling. Educational.
Disclaimer: if you this tool for trading which may cause losses and profits which myself or Tradingview and its partners wont responsible for it.
Dr_All indicators V1.0Free users have many restrictions on their use in TradingView.
I put together a lot of indicators I use often.
5 moving average
1 parabolic SAR
1 bollinger band
1 ichimoku cloud
(but it's only cloud)
as always
It's open source.
enjoy!