Adaptive Z-Score Oscillator [QuantAlgo]🟢 Overview
The Adaptive Z-Score Oscillator transforms price action into statistical significance measurements by calculating how many standard deviations the current price deviates from its moving average baseline, then dynamically adjusting threshold levels based on historical distribution patterns. Unlike traditional oscillators that rely on fixed overbought/oversold levels, this indicator employs percentile-based adaptive thresholds that automatically calibrate to changing market volatility regimes and statistical characteristics. By offering both adaptive and fixed threshold modes alongside multiple moving average types and customizable smoothing, the indicator provides traders and investors with a robust framework for identifying extreme price deviations, mean reversion opportunities, and underlying trend conditions through the visualization of price behavior within a statistical distribution context.
🟢 How It Works
The indicator begins by establishing a dynamic baseline using a user-selected moving average type applied to closing prices over the specified length period, then calculates the standard deviation to measure price dispersion:
basis = ma(close, length, maType)
stdev = ta.stdev(close, length)
The core Z-Score calculation quantifies how many standard deviations the current price sits above or below the moving average basis, creating a normalized oscillator that facilitates cross-asset and cross-timeframe comparisons:
zScore = stdev != 0 ? (close - basis) / stdev : 0
smoothedZ = ma(zScore, smooth, maType)
The adaptive threshold mechanism employs percentile calculations over a historical lookback period to determine statistically significant extreme zones. Rather than using fixed levels like ±2.0, the indicator identifies where a specified percentage of historical Z-Score readings have fallen, automatically adjusting to market regime changes:
upperThreshold = adaptive ? ta.percentile_linear_interpolation(smoothedZ, percentilePeriod, upperPercentile) : fixedUpper
lowerThreshold = adaptive ? ta.percentile_linear_interpolation(smoothedZ, percentilePeriod, lowerPercentile) : fixedLower
The visualization architecture creates a four-tier coloring system that distinguishes between extreme conditions (beyond the adaptive thresholds) and moderate conditions (between the midpoint and threshold levels), providing visual gradation of statistical significance through opacity variations and immediate recognition of distribution extremes.
🟢 How to Use This Indicator
▶ Overbought and Oversold Identification:
The indicator identifies potential overbought conditions when the smoothed Z-Score crosses above the upper threshold, indicating that price has deviated to a statistically extreme level above its mean. Conversely, oversold conditions emerge when the Z-Score crosses below the lower threshold, signaling statistically significant downward deviation. In adaptive mode (default), these thresholds automatically adjust to the asset's historical behavior, i.e., during high volatility periods, the thresholds expand to accommodate wider price swings, while during low volatility regimes, they contract to capture smaller deviations as significant. This dynamic calibration reduce false signals that plague fixed-level oscillators when market character shifts between volatile and ranging conditions.
▶ Mean Reversion Trading Applications:
The Z-Score framework excels at identifying mean reversion opportunities by highlighting when price has stretched too far from its statistical equilibrium. When the oscillator reaches extreme bearish levels (below the lower threshold with deep red coloring), it suggests price has become statistically oversold and may snap back toward the mean, presenting potential long entry opportunities for mean reversion traders. Symmetrically, extreme bullish readings (above the upper threshold with bright green coloring) indicate potential short opportunities or long exit points as price becomes statistically overbought. The moderate zones (lighter colors between midpoint and threshold) serve as early warning areas where traders can prepare for potential reversals, while exits from extreme zones (crossing back inside the thresholds) often provide confirmation that mean reversion is underway.
▶ Trend and Distribution Analysis:
Beyond discrete overbought/oversold signals, the histogram's color pattern and shape reveal the underlying trend structure and distribution characteristics. Sustained periods where the Z-Score oscillates primarily in positive territory (green bars) indicate a bullish trend where price consistently trades above its moving average baseline, even if not reaching extreme levels. Conversely, predominant negative readings (red bars) suggest bearish trend conditions. The distribution shape itself provides insight into market behavior, e.g., a narrow, centered distribution clustering near zero indicates tight ranging conditions with price respecting the mean, while a wide distribution with frequent extreme readings reveals volatile trending or choppy conditions. Asymmetric distributions skewed heavily toward one side demonstrate persistent directional bias, whereas balanced distributions suggest equilibrium between bulls and bears.
▶ Built-in Alerts:
Seven alert conditions enable automated monitoring of statistical extremes and trend transitions. Enter Overbought and Enter Oversold alerts trigger when the Z-Score crosses into extreme zones, providing early warnings of potential reversal setups. Exit Overbought and Exit Oversold alerts signal when price begins reverting from extremes, offering confirmation that mean reversion has initiated. Zero Cross Up and Zero Cross Down alerts identify transitions through the neutral line, indicating shifts between above-mean and below-mean price action that can signal trend changes. The Extreme Zone Entry alert fires on any extreme threshold penetration regardless of direction, allowing unified monitoring of both overbought and oversold opportunities.
▶ Color Customization:
Six visual themes (Classic, Aqua, Cosmic, Ember, Neon, plus Custom) accommodate different chart backgrounds and aesthetic preferences, ensuring optimal contrast and readability across trading platforms. The bar transparency control (0-90%) allows fine-tuning of visual prominence, with minimal transparency creating bold, attention-grabbing bars for primary analysis, while higher transparency values produce subtle background context when using the oscillator alongside other indicators. The extreme and moderate zone coloring system uses automatic opacity variation to create instant visual hierarchy, with darkest colors highlight the most statistically significant deviations demanding immediate attention, while lighter shades mark developing conditions that warrant monitoring but may not yet justify action. Optional candle coloring extends the Z-Score color scheme directly to the price candles on the main chart, enabling traders to instantly recognize statistical extremes and trend conditions without needing to reference the oscillator panel, creating a unified visual experience where both price action and statistical analysis share the same color language.
Su Pine

Andres System - SuperTrend DMI EMAAdvanced Multi-Filter Trading System combining SuperTrend, DMI (Directional Movement Index), and EMA crossovers for high-probability trade entries.
**Key Features:**
- Real-time DMI table showing trend strength (Sideways/Mild/Normal/Strong/Very Strong)
- Filter status dashboard - see exactly which conditions are met
- Smart entry logic: signals trigger during entire EMA alignment period, not just at exact crossover
- Clear BUY/SELL signals with exit markers
- One signal per trade - prevents duplicate entries
**Entry Requirements:**
LONG: EMA 7 > 21 + SuperTrend bullish + DI+ > 20
SHORT: EMA 7 < 21 + SuperTrend bearish + DI- > 20
**Exit Conditions:**
Position closes when EMA crosses back or SuperTrend changes direction
**Additional Tools:**
- Previous Day High/Low levels
- Daily VWAP
- Color-coded EMAs (7, 21, 50)
- Customizable thresholds for all filters
**Best Timeframes:** 4H for swing trading, 1D for position trading
All visual elements can be toggled on/off. Alerts available for all signals.

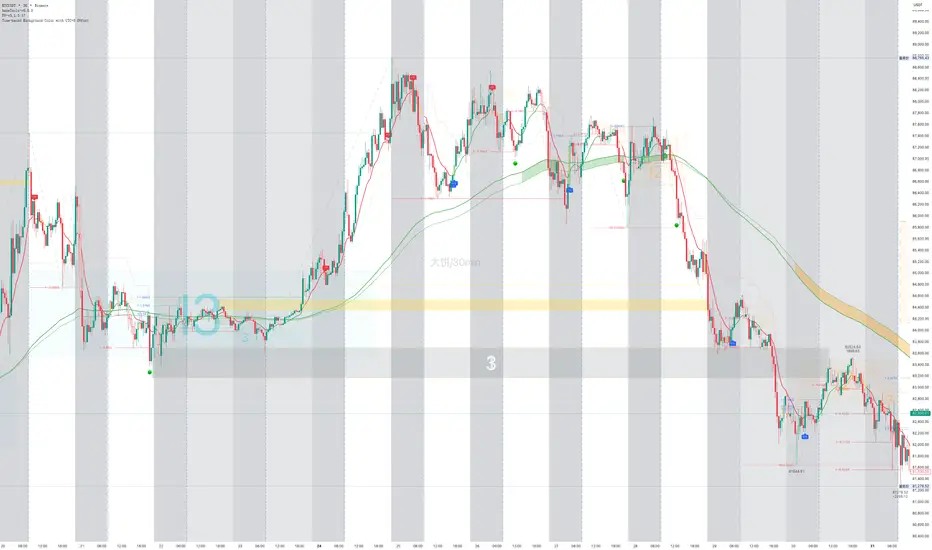
Work Break Area BackgroundWorkdays and off-hours are distinguished by background color for easy date differentiation during reviews.
Entry / TP / SL Alert Bands (Simple & Stable)
Get an alert before you reach your take profit or stop loss. Set as a percentage over the distance to your stop loss and take profit and improve your Money Management

SigmaFlowSigmaFlow is a professional signal management connector designed to work with the SigmaFlow app. This indicator allows traders to structure trade setups (Entry, Stop Loss, TP1, TP2) on TradingView and send them into the SigmaFlow platform, where signals are managed, tracked, and delivered to Telegram.
Professional signal management — from TradingView to Telegram.
How SigmaFlow Works:
Sends trade data from TradingView to Telegram via the SigmaFlow platform.
SigmaFlow handles signal management, organization, history tracking, performance metrics, and Telegram delivery.
What It Does NOT Do:
Does not generate trading signals
Does not provide investment advice
Does not execute trades
Requirements:
TradingView plan with webhook alerts*
Active SigmaFlow account*
Disclaimer
SigmaFlow is a signal management and delivery tool only. All trade ideas are created manually by users. Trading involves risk and past performance does not guarantee future results.

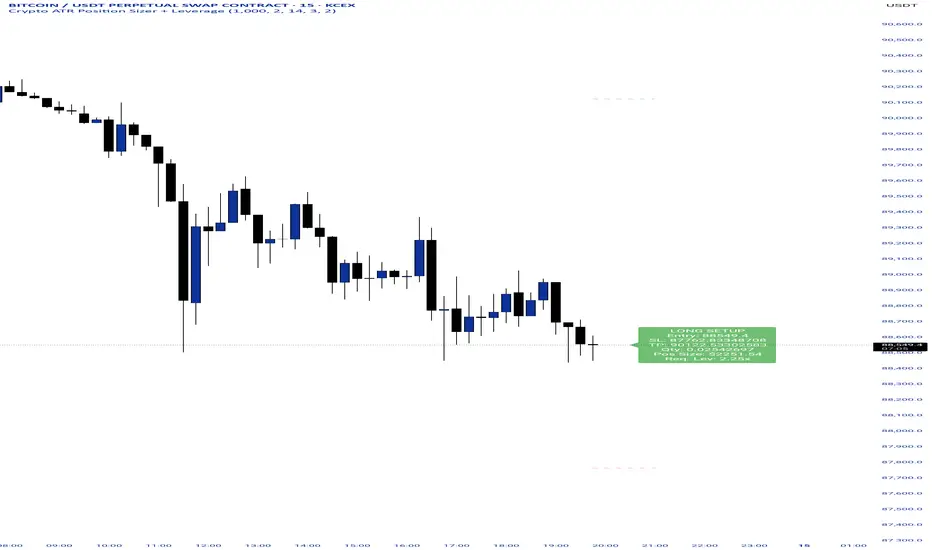
Crypto ATR Position Sizer + LeverageThis indicator is a "heads-up display" for crypto traders who need real time risk management without manually calculating position sizes. It uses Average True Range (ATR) to dynamically place Stop Losses based on current market volatility and automatically calculates the exact position size needed to respect your risk percentage.
Key Features:
Dynamic Risk Management: Stop Loss and Take Profit levels adjust automatically based on market volatility (ATR).
Auto-Position Sizing: Calculates the exact Quantity (in coins) and Position Value (in $) to ensure you never risk more than your defined percentage (e.g., 1% or 2%).
Leverage Calculator: Instantly sees the "Required Leverage" needed to execute the trade size relative to your account balance.
Crypto Precision: Displays up to 8 decimal places, making it compatible with both Bitcoin and low-sat altcoins.
Toggable Direction: Switch between Long and Short biases instantly via the settings menu.
How to Use:
Add the indicator to your chart.
Open Settings and input your Account Balance and Risk %.
Choose your direction (Long or Short) using the checkboxes.
The label will display your Entry, SL, TP, Coin Quantity, and Required Leverage in real-time.
Renko Average Bricks This indicator calculates the average RENKO brick streaks. Streaks=consecutive bricks of the same color. EX. G= 1 streak of 1. GGG = 1 streak of 3. RR 1 streak of 2. Single bricks count. There is the option for look back period which can be changed but Defaults to 50. Calculates the last 50 completed green streaks and then averages them. Same with red streaks. Only closed bricks count.
Very Simple and can be used for targets, ect.
Cheers

Position CalculatorAn on chart indicator that helps you calculate position sizes, risk/reward ratios, and potential profit/loss for your trades.

SUPERTREND VALIDADO ADX EMAS VWAP # Modular Trading System - SuperTrend + ADX + Multi-Filter Confirmation
## Overview
Professional modular trading system designed for trend-following strategies on 4H timeframes. Features a clean, mobile-optimized interface with customizable filters and real-time status monitoring.
## Core Features
### Validated Components (Backtested)
- **SuperTrend (ATR 10, Multiplier 3.0)**: Primary trend direction filter with visual fill
- **ADX >23**: Trend strength confirmation (14-period)
- Proven performance: 52.11% win rate, 3.162 profit factor over 4 years
### Additional Filters (Optional)
- **DI Spread >9**: Directional movement confirmation
- **Volume > EMA20**: Volume confirmation above 20-period average
- **EMA System**: 7/21/50 with dynamic coloring
- **VWAP**: Daily volume-weighted average price
### Visual Elements
- **SuperTrend Line**: Green (bullish) / Red (bearish) with background fill
- **EMA 7**: Yellow when ADX >23, White when ADX ≤23
- **EMA 21**: Green (price above) / Red (price below)
- **EMA 50**: Blue reference line
- **VWAP**: Orange line
- **PDH/PDL**: Previous day high/low levels
- **EMA Cross Signals**: Small dots marking 7/21 crossovers
### Smart Money Concepts
- Automatic Previous Day High (PDH) / Previous Day Low (PDL) tracking
- Horizontal lines extending from current price
- Clear labeling for support/resistance levels
## Status Dashboard
Compact 2-column table (top-right) shows:
```
FILTERS | STATUS
1. ADX >23 | 47.6 OK / 18.2 NO
2. DI Spread >9 | Bullish / Bearish
3. SuperTrend | Bullish / Bearish
4. Volume >EMA20 | 1.25x OK / 0.14x NO
─────────────────────────────
SIGNAL | BUY / SELL / WAIT
```
Color-coded backgrounds:
- Green: Condition met
- Red: Condition not met
- Yellow: Waiting for confirmation
## Signal Logic
### Entry Conditions
**LONG**: All active filters must align
- SuperTrend bullish (green)
- ADX >23
- DI+ > DI- (if DI Spread enabled)
- Volume > EMA20 (if Volume enabled)
- Price > EMA21 and EMA7 > EMA21 (if EMAs enabled)
**SHORT**: All active filters must align
- SuperTrend bearish (red)
- ADX >23
- DI- > DI+ (if DI Spread enabled)
- Volume > EMA20 (if Volume enabled)
- Price < EMA21 and EMA7 < EMA21 (if EMAs enabled)
### Exit Conditions
- SuperTrend direction change
- Clear "EXIT" markers on chart
### Position Management
- One position per trend (no pyramiding)
- Prevents multiple entries in same direction
- "WAIT" status when conditions partially met
## Settings & Customization
### Filters (Enable/Disable)
**Core Filters:**
- ✓ SuperTrend (VALIDATED)
- ✓ ADX >23 (VALIDATED)
**Additional Filters:**
- ⚠️ DI Spread >9 (EXPERIMENTAL)
- ⚠️ Volume > EMA20 (EXPERIMENTAL)
- ⚠️ EMAs 7/21/50 (EXPERIMENTAL)
**Visual:**
- Show EMA 7/21 Crosses (dots)
### Parameters
**SuperTrend:**
- ATR Period: 10 (default)
- ATR Multiplier: 3.0 (default)
**ADX/DI:**
- ADX Length: 14 (default)
- ADX Threshold: 23 (default)
- DI Spread Threshold: 9 (default)
**Volume:**
- Volume EMA: 20 (default)
**EMAs:**
- Fast EMA: 7 (default)
- Medium EMA: 21 (default)
- Slow EMA: 50 (default)
## Alerts
Pre-configured alerts for:
- Long Signal (BUY - Entry confirmed)
- Short Signal (SELL - Entry confirmed)
- Exit Long (EXIT LONG - SuperTrend changed)
- Exit Short (EXIT SHORT - SuperTrend changed)
- EMA Cross Up (EMA 7 crossed above EMA 21)
- EMA Cross Down (EMA 7 crossed below EMA 21)
## Best Practices
### Recommended Setup (Validated System)
```
Enable ONLY:
- SuperTrend: ON
- ADX >23: ON
- All other filters: OFF
```
### Testing New Filters
1. Enable experimental filters
2. Backtest thoroughly before live trading
3. Compare performance metrics
4. Validate with demo account first
### Timeframe
- Optimized for: 4H charts
- Tested on: Bitcoin/USDT
- Works on: Any trending instrument
## Risk Management
This indicator provides entry/exit signals but does NOT include:
- Stop loss levels
- Take profit targets
- Position sizing
Always use proper risk management:
- Maximum 1-2% risk per trade
- Use stop losses
- Follow your trading plan
## Performance Notes
**Validated Backtest Results (SuperTrend + ADX only):**
- Win Rate: 52.11%
- Profit Factor: 3.162
- Return: +45.46% (4 years)
- Tested Period: 2020-2024
- Instrument: BTC/USDT 4H
**Important:** Adding additional filters changes the system. Results may vary. Always backtest your specific configuration before live trading.
## Mobile Optimization
- Compact table design
- Clear color coding
- Minimal chart clutter
- Large signal text
- Optimized for small screens
## Use Cases
✅ **Ideal for:**
- Trend-following strategies
- Swing trading (4H timeframe)
- Clear market conditions
- Systematic traders
❌ **NOT ideal for:**
- Scalping (too slow)
- Range-bound markets
- Counter-trend strategies
- Lateral/choppy conditions
## Credits & Methodology
Based on proven technical analysis principles:
- SuperTrend (volatility-based trend following)
- ADX (trend strength measurement)
- Directional Indicators (DI+/DI-)
- Volume analysis
- EMA systems
**Designed for:** Disciplined execution over frequent trading
**Philosophy:** Quality setups > Quantity of trades
## Disclaimer
This indicator is for educational purposes only. Past performance does not guarantee future results. Always:
- Test on demo account first
- Use proper risk management
- Never risk more than you can afford to lose
- Consult a financial advisor
Trading involves substantial risk. This tool does not constitute financial advice.
---
## Version History
**v2.0 (Current)**
- Modular filter system
- 2-column compact status table
- EMA 7 dynamic coloring (yellow when ADX >23)
- EMA 50 + VWAP added
- PDH/PDL levels
- EMA cross markers
- Improved signal logic
- One position per trend
- Multiple alert conditions
---
**For support, updates, or feedback, contact the developer.**

Swing Trading Indicator: RSI + EMA + MACD + BB Signals**Swing Trading Indicator: Multi-Indicator Confluence Signals**
This indicator identifies high-probability swing trading setups using RSI pullbacks, EMA trend filter, MACD momentum confirmation, and Bollinger Bands for volatility-based entries. Perfect for daily/4H charts on stocks like TSLA or SPY.
**Key Features:**
- **Long Signal (Green ↑ Arrow)**: Uptrend (above 200 EMA) + RSI crosses above oversold (default 30) + MACD bullish crossover + Price at/near BB lower band + Optional squeeze filter.
- **Short Signal (Red ↓ Arrow)**: Mirror for downtrends.
- **Real-Time Dashboard**: Top-right table shows condition status (✓/✗) and "LONG/SHORT READY" alerts.
- **Customizable**: Adjust RSI levels, BB multiplier, enable/disable shorts/squeeze/arrows.
- **Alerts**: Built-in for entry notifications.
**How to Use:**
1. Add to chart (daily timeframe recommended).
2. Watch for arrows + "READY" in dashboard.
3. Manual entry: Risk 1% per trade, target 1:2 reward (e.g., trail stops).
**Backtest Note**: Based on similar setups, ~55-65% win rate in trending markets (test yourself). Not financial advice—trading involves risk. Fork and improve!
#swingtrading #RSI #MACD #BollingerBands #PineScript

Pardos Info DashboardThis indicator presents basic data in a concentrated form
Additions to the indicator are welcome by email to gshayp@gmail.com

RTH Yesterday & Today Premarket Levels## **RTH Yesterday & Today Premarket Levels**
This indicator plots the most commonly used **institutional reference levels** for intraday trading:
* **Yesterday’s Regular Trading Hours (RTH) High**
* **Yesterday’s Regular Trading Hours (RTH) Low**
* **Yesterday’s Regular Trading Hours (RTH) Close**
* **Today’s Premarket High**
* **Today’s Premarket Low**
All levels are drawn as **straight horizontal lines with labels** and remain fixed throughout the current session.
---
### **How Levels Are Calculated**
**Yesterday’s Levels (RTH only)**
* Computed strictly from **Regular Trading Hours (09:30–16:00 exchange time)**.
* Extended-hours data is **excluded** to avoid distortion.
* Captures true institutional highs, lows, and closing price.
**Today’s Premarket Levels (PM only)**
* Computed strictly from **today’s premarket session (04:00–09:29)**.
* Resets daily and does not include prior days.
* Levels finalize once premarket ends and extend across the regular session.
---
### **Key Features**
* Exactly **5 fixed reference levels**, no historical clutter
* **Non-repainting**: levels do not change once established
* **No zig-zags or plots**; only clean horizontal lines
* Customizable **line colors and thickness**
* Labels clearly identify each level:
* Y High
* Y Low
* Y Close
* PM High
* PM Low
---
### **Best Use Cases**
* Intraday trading (1m, 5m, 15m)
* VWAP and momentum strategies
* Gap-and-go or fade setups
* Support/resistance validation
* Options trading and scalping
These levels often act as **decision points, liquidity magnets, and rejection zones** during the regular session.
---
### **Required Settings**
* Use **intraday timeframes**
* Enable **Extended Hours** in TradingView’s symbol settings
* Designed for **US equities** using exchange time
---
### **Trader Notes**
This script is intentionally minimalist. It shows only the **most relevant prior-day and premarket price references** used by professional traders, avoiding noise from multi-day indicators or derived averages.


Green Day or Red Day?What it is:
This simple indicator provides immediate visual context by tinting the background of your chart Green or Red based on the asset's daily performance.
Who's it for?
It is designed for day traders and scalpers who operate on lower timeframes (1m, 5m, 15m) but need to remain aware of the overall daily direction without switching charts. It can be used in combination with the ORB strategy as a helpful tool to "feel" the trend when you're way out of the ORB range. But this indicator can be used by anyone regardless of trading style.
How it works:
This script pulls data from the daily timeframe regardless of the chart interval you are currently viewing. It compares the current price to a user-selectable reference point (either Yesterday's Close or Today's Open) to determine the background color.
Good Luck. May you make good trades!


Volatility Aurora [The_lurker]█░░░░░░░░░░░░░░░░░░░ VOLATILITY AURORA ░░░░░░░░░░░░░░░░░░░░█
█░░░░░░░░░░░░░░░ Where Market Energy Meets Visual Poetry ░░░░░░░░░░░░░░░░█
📖 INTRODUCTION
━━━━━━━━━━━━━━━━━━━━━━━━━━━━━━━━━━━━━━━━━━━
The Aurora Borealis occurs when charged particles from the sun collide with gases in Earth's atmosphere, creating mesmerizing waves of colorful light.
𝗩𝗼𝗹𝗮𝘁𝗶𝗹𝗶𝘁𝘆 𝗔𝘂𝗿𝗼𝗿𝗮 applies this elegant concept to financial markets:
⚡ Price Momentum = Charged Particles
🌌 ATR Layers = Atmospheric Layers
🎨 Color Intensity = Energy Magnitude
📐 Layer Expansion = Volatility State
When momentum "collides" with volatility layers, the Aurora illuminates potential market regime changes — often before they fully manifest in price action.
🔬 THE SCIENCE BEHIND IT
━━━━━━━━━━━━━━━━━━━━━━━━━━━━━━━━━━━━━━━━━━━━━━━━━━━━━━━━━━━━━━━━━━━━━━━━━━━━━
Unlike traditional volatility indicators that provide a single value, Volatility Aurora creates a 𝗺𝘂𝗹𝘁𝗶-𝗱𝗶𝗺𝗲𝗻𝘀𝗶𝗼𝗻𝗮𝗹 𝘃𝗼𝗹𝗮𝘁𝗶𝗹𝗶𝘁𝘆 𝗳𝗶𝗲𝗹𝗱 using five distinct ATR layers based on Fibonacci periods:
│ Layer │ Period │ Atmospheric │ Function │
├──────────────────────┼─────────────────┼─────────────────┤
│ Layer 1 │ 5 │ Ionosphere │ Captures immediate vol shifts
│ Layer 2 │ 13 │ Mesosphere │ Medium-term vol response
│ Layer 3 │ 34 │ Stratosphere │ Intermediate vol structure
│ Layer 4 │ 55 │ Troposphere │ Foundational vol baseline
│ Layer 5 │ 89 │ Surface │ Structural, long-term vol
⚡ CORE CONCEPTS
━━━━━━━━━━━━━━━━━━━━━━━━━━━━━━━━━━━━━━━━━━━
𝟭. 𝗟𝗮𝘆𝗲𝗿 𝗘𝘅𝗽𝗮𝗻𝘀𝗶𝗼𝗻 & 𝗖𝗼𝗻𝘁𝗿𝗮𝗰𝘁𝗶𝗼𝗻
Each layer dynamically expands or contracts based on its normalized ATR value:
• 𝗘𝘅𝗽𝗮𝗻𝗱𝗶𝗻𝗴 𝗟𝗮𝘆𝗲𝗿𝘀 → Increasing volatility regime
• 𝗖𝗼𝗻𝘁𝗿𝗮𝗰𝘁𝗶𝗻𝗴 𝗟𝗮𝘆𝗲𝗿𝘀 → Decreasing volatility / Consolidation
• 𝗕𝗿𝗲𝗮𝘁𝗵𝗶𝗻𝗴 𝗘𝗳𝗳𝗲𝗰𝘁 → Natural market rhythm visualization
𝟮. 𝗛𝗮𝗿𝗺𝗼𝗻𝘆 𝗦𝗰𝗼𝗿𝗲
Measures alignment between all five layers:
• 𝗛𝗶𝗴𝗵 𝗛𝗮𝗿𝗺𝗼𝗻𝘆 (>70%) → All timeframes agree → Strong, reliable trends
• 𝗟𝗼𝘄 𝗛𝗮𝗿𝗺𝗼𝗻𝘆 (<30%) → Timeframe divergence → Choppy conditions
𝟯. 𝗘𝗻𝗲𝗿𝗴𝘆 𝗜𝗻𝘁𝗲𝗻𝘀𝗶𝘁𝘆
Quantifies how strongly momentum is "hitting" the volatility layers:
• 𝗛𝗶𝗴𝗵 𝗜𝗻𝘁𝗲𝗻𝘀𝗶𝘁𝘆 → Strong directional conviction
• 𝗟𝗼𝘄 𝗜𝗻𝘁𝗲𝗻𝘀𝗶𝘁𝘆 → Weak momentum, potential reversal
𝟰. 𝗥𝗲𝗴𝗶𝗺𝗲 𝗖𝗹𝗮𝘀𝘀𝗶𝗳𝗶𝗰𝗮𝘁𝗶𝗼𝗻
Based on aggregate layer states:
🟢 𝗖𝗔𝗟𝗠 → Low volatility across all layers
🟡 𝗡𝗢𝗥𝗠𝗔𝗟 → Balanced market conditions
🟠 𝗩𝗢𝗟𝗔𝗧𝗜𝗟𝗘 → Elevated activity
🔴 𝗘𝗫𝗧𝗥𝗘𝗠𝗘 → Maximum volatility state
🎨 VISUAL COMPONENTS
━━━━━━━━━━━━━━━━━━━━━━━━━━━━━━━━━━━━━━━━━━━
🌈 𝗔𝘂𝗿𝗼𝗿𝗮 𝗟𝗮𝘆𝗲𝗿𝘀 (𝗚𝗿𝗮𝗱𝗶𝗲𝗻𝘁 𝗕𝗮𝗻𝗱𝘀)
• Five pairs of symmetrical bands around the price core
• Color gradient from core (bright) to outer (dim)
• Expansion reflects current volatility state
💠 𝗖𝗼𝗿𝗲 𝗟𝗶𝗻𝗲
• Central EMA-based trend line
• Color changes with momentum direction:
🟢 Cyan/Teal = Bullish
🔴 Pink/Magenta = Bearish
🟣 Purple = Neutral
💫 𝗘𝗻𝗲𝗿𝗴𝘆 𝗣𝘂𝗹𝘀𝗲 𝗟𝗶𝗻𝗲𝘀
• Diagonal flow lines showing momentum trajectory
• Thicker lines = Higher energy
• Direction indicates momentum flow
🎵 𝗛𝗮𝗿𝗺𝗼𝗻𝘆 𝗪𝗮𝘃𝗲𝘀
• Vertical dotted lines appear when harmony exceeds 70%
• Signals timeframe alignment — high-probability zones
📊 HOW TO USE
━━━━━━━━━━━━━━━━━━━━━━━━━━━━━━━━━━━━━━━━━━━
📈 𝗧𝗿𝗲𝗻𝗱 𝗙𝗼𝗹𝗹𝗼𝘄𝗶𝗻𝗴
• Enter when Aurora expands in your direction
• Core line color confirms bias
• High harmony = Higher confidence
💥 𝗩𝗼𝗹𝗮𝘁𝗶𝗹𝗶𝘁𝘆 𝗕𝗿𝗲𝗮𝗸𝗼𝘂𝘁𝘀
• Watch for regime shift from CALM to VOLATILE
• Expanding layers signal incoming movement
• Intensity spike confirms breakout strength
↩️ 𝗠𝗲𝗮𝗻 𝗥𝗲𝘃𝗲𝗿𝘀𝗶𝗼𝗻
• EXTREME regime often precedes reversals
• Contracting layers after expansion = Potential pullback
• Low harmony during trends = Weakening momentum
🛡️ 𝗥𝗶𝘀𝗸 𝗠𝗮𝗻𝗮𝗴𝗲𝗺𝗲𝗻𝘁
• Use outer layers as dynamic support/resistance
• Wider Aurora = Wider stops required
• Contracting Aurora = Tighter risk parameters
⚙️ SETTINGS GUIDE
━━━━━━━━━━━━━━━━━━━━━━━━━━━━━━━━━━━━━━━━━━━
🌌 𝗔𝘂𝗿𝗼𝗿𝗮 𝗖𝗼𝗿𝗲
│ Setting │Default │ Description
│ Layer 1-5 │ Fib │ ATR periods (5,13,34,55,89)
│ Expansion Factor │ 2.5 │ Controls layer width multiplier
│ Smoothing │ 5 │ EMA smoothing for visual clarity
⚡ 𝗘𝗻𝗲𝗿𝗴𝘆 𝗙𝗶𝗲𝗹𝗱
│ Setting │ Default │ Description
│ Momentum Length │ 14 │ Period for momentum calculation
│ Energy Lookback │ 21 │ Normalization window
│ Energy Multiplier │ 1.5 │ Amplifies energy display
🎨 𝗩𝗶𝘀𝘂𝗮𝗹
│ Setting │ Default │ Description
│ Language │ EN │ Interface language (EN/AR)
│ Show Aurora │ ✓ │ Toggle layer visibility
│ Show Core Line │ ✓ │ Toggle center line
│ Show Energy Pulse │ ✓ │ Toggle flow lines
│ Show Harmony Waves │ ✓ │ Toggle alignment indicators
🔔 ALERTS
━━━━━━━━━━━━━━━━━━━━━━━━━━━━━━━━━━━━━━━━━━━
⚡ 𝗥𝗲𝗴𝗶𝗺𝗲 𝗦𝗵𝗶𝗳𝘁 — Volatility regime changed
🎵 𝗛𝗶𝗴𝗵 𝗛𝗮𝗿𝗺𝗼𝗻𝘆 — All layers aligned (>85%)
↕️ 𝗗𝗶𝗿𝗲𝗰𝘁𝗶𝗼𝗻 𝗖𝗵𝗮𝗻𝗴𝗲 — Momentum direction reversed
🔥 𝗜𝗻𝘁𝗲𝗻𝘀𝗶𝘁𝘆 𝗦𝗽𝗶𝗸𝗲 — Energy exceeded 80% threshold
💡 TIPS FOR BEST RESULTS
━━━━━━━━━━━━━━━━━━━━━━━━━━━━━━━━━━━━━━━━━━━
1️⃣ 𝗛𝗶𝗴𝗵𝗲𝗿 𝗧𝗶𝗺𝗲𝗳𝗿𝗮𝗺𝗲𝘀 — Aurora works best on 1H+ charts
2️⃣ 𝗖𝗼𝗺𝗯𝗶𝗻𝗲 𝘄𝗶𝘁𝗵 𝗣𝗔 — Use Aurora as context, not signals
3️⃣ 𝗪𝗮𝘁𝗰𝗵 𝗛𝗮𝗿𝗺𝗼𝗻𝘆 — High harmony setups win more
4️⃣ 𝗥𝗲𝘀𝗽𝗲𝗰𝘁 𝗥𝗲𝗴𝗶𝗺𝗲 — Don't fight EXTREME volatility
5️⃣ 𝗟𝗮𝘆𝗲𝗿 𝗖𝗼𝗻𝗳𝗹𝘂𝗲𝗻𝗰𝗲 — Multi-layer bounces = Strong S/R
⚠️ DISCLAIMER
━━━━━━━━━━━━━━━━━━━━━━━━━━━━━━━━━━━━━━━━━━━
This indicator is for educational purposes only. Past performance does not
guarantee future results. Always use proper risk management and conduct your
own analysis before making trading decisions.
█████████████████████████████████████████████████████████████
█░░░░░░░░░░░░░░░░░░░░░ شفق التقلب ░░░░░░░░░░░░░░░░░░░░░░█
█░░░░░░░░░░░░░░░ حيث تلتقي طاقة السوق بالشعور البصري ░░░░░░░░░░░░░░░░█
📖 المقدمة
━━━━━━━━━━━━━━━━━━━━━━━━━━━━━━━━━━━━━━━━━━━
يحدث الشفق القطبي عندما تصطدم الجسيمات المشحونة القادمة من الشمس بالغازات في الغلاف الجوي للأرض، مما يخلق موجات ساحرة من الضوء الملون.
يطبق نفس المفهوم الأنيق على الأسواق المالية
⚡ زخم السعر = الجسيمات المشحونة
🌌 طبقات ATR = طبقات الغلاف الجوي
🎨 شدة اللون = حجم الطاقة
📐 توسع الطبقات = حالة التقلب
عندما "يصطدم" الزخم بطبقات التقلب، يُضيء الشفق التغيرات المحتملة في نظام السوق — غالباً قبل أن تتجلى بالكامل في حركة السعر.
🔬 العلم وراء المؤشر
━━━━━━━━━━━━━━━━━━━━━━━━━━━━━━━━━━━━━━━━━━━
على عكس مؤشرات التقلب التقليدية التي تقدم قيمة واحدة، يُنشئ شفق التقلب 𝗽𝗮𝗾𝗹 𝘁𝗮𝗾𝗮𝗹𝗹𝘂𝗯 𝗺𝘂𝘁𝗮'𝗮𝗱𝗱𝗶𝗱 𝗮𝗹-𝗮𝗯'𝗮𝗱 باستخدام خمس طبقات ATR مميزة مبنية على أرقام فيبوناتشي:
│ الطبقة │ الفترة │ المعادل الجوي │ الوظيفة
│ الطبقة١ │ 5 │ الأيونوسفير │ تلتقط تحولات التقلب الفورية
│ الطبقة٢ │ 13 │ الميزوسفير │ استجابة التقلب متوسطة المدى
│ الطبقة٣ │ 34 │ الستراتوسفير │ هيكل التقلب المتوسط
│ الطبقة٤ │ 55 │ التروبوسفير │ خط الأساس للتقلب
│ الطبقة٥ │ 89 │ السطح │ التقلب الهيكلي طويل المدى
⚡ المفاهيم الأساسية
━━━━━━━━━━━━━━━━━━━━━━━━━━━━━━━━━━━━━━━━━━━
𝟭. توسع وانكماش الطبقات
تتوسع أو تنكمش كل طبقة ديناميكياً بناءً على قيمة ATR المعيارية:
• طبقات متوسعة ← نظام تقلب متزايد
• طبقات منكمشة ← تقلب متناقص / تجميع
• تأثير التنفس ← تصور إيقاع السوق الطبيعي
𝟮. درجة التناغم
تقيس التوافق بين جميع الطبقات الخمس:
• تناغم عالي (>٧٠٪) ← جميع الأطر متفقة ← اتجاهات قوية
• تناغم منخفض (<٣٠٪) ← تباين الأطر ← ظروف متقطعة
𝟯. شدة الطاقة
تحدد مدى قوة "اصطدام" الزخم بطبقات التقلب:
• شدة عالية ← قناعة اتجاهية قوية
• شدة منخفضة ← زخم ضعيف، احتمال انعكاس
𝟰. تصنيف النظام
بناءً على حالات الطبقات المجمعة:
🟢 هادئ ← تقلب منخفض عبر جميع الطبقات
🟡 طبيعي ← ظروف سوق متوازنة
🟠 متقلب ← نشاط مرتفع
🔴 متطرف ← حالة التقلب القصوى
🎨 المكونات البصرية
━━━━━━━━━━━━━━━━━━━━━━━━━━━━━━━━━━━━━━━━━━━
🌈 طبقات الشفق (النطاقات المتدرجة)
• خمسة أزواج من النطاقات المتماثلة حول نواة السعر
• تدرج لوني من النواة (ساطع) إلى الخارج (خافت)
• التوسع يعكس حالة التقلب الحالية
💠 خط النواة
• خط اتجاه مركزي قائم على EMA
• يتغير اللون مع اتجاه الزخم:
🟢 سماوي = صاعد
🔴 وردي = هابط
🟣 بنفسجي = محايد
💫 خطوط نبض الطاقة
• خطوط تدفق مائلة تُظهر مسار الزخم
• خطوط أسمك = طاقة أعلى
• الاتجاه يشير إلى تدفق الزخم
🎵 موجات التناغم
• خطوط عمودية منقطة تظهر عندما يتجاوز التناغم ٧٠٪
• تشير إلى توافق الأطر الزمنية — مناطق احتمالية عالية
📊 كيفية الاستخدام
━━━━━━━━━━━━━━━━━━━━━━━━━━━━━━━━━━━━━━━━━━━
📈 تتبع الاتجاه
• ادخل عندما يتوسع الشفق في اتجاهك
• لون خط النواة يؤكد التحيز
• تناغم عالي = ثقة أعلى
💥 اختراقات التقلب
• راقب تحول النظام من هادئ إلى متقلب
• الطبقات المتوسعة تشير إلى حركة قادمة
• ارتفاع الشدة يؤكد قوة الاختراق
↩️ الارتداد للمتوسط
• النظام المتطرف غالباً يسبق الانعكاسات
• طبقات منكمشة بعد التوسع = احتمال تراجع
• تناغم منخفض أثناء الاتجاهات = زخم ضعيف
🛡️ إدارة المخاطر
• استخدم الطبقات الخارجية كدعم/مقاومة ديناميكية
• شفق أوسع = وقف خسارة أوسع مطلوب
• شفق منكمش = معايير مخاطر أضيق
⚙️ دليل الإعدادات
━━━━━━━━━━━━━━━━━━━━━━━━━━━━━━━━━━━━━━━━━━━
🌌 نواة الشفق
│ الإعداد │الافتراضي│ الوصف
│ الطبقات ١-٥ │ Fib │ فترات ATR (5,13,34,55,89)
│ معامل التوسع │ 2.5 │ يتحكم في مضاعف عرض الطبقات
│ التنعيم │ 5 │ تنعيم EMA للوضوح البصري
⚡ مجال الطاقة
│ الإعداد │الافتراضي│ الوصف
│ فترة الزخم │ 14 │ فترة حساب الزخم
│ فترة الطاقة │ 21 │ نافذة التطبيع
│ مضاعف الطاقة │ 1.5 │ يضخم عرض الطاقة
🎨 العرض البصري
│ الإعداد │الافتراضي│ الوصف
│ اللغة │ EN │ لغة الواجهة (EN/AR)
│ إظهار الشفق │ ✓ │ تبديل ظهور الطبقات
│ خط النواة │ ✓ │ تبديل الخط المركزي
│ نبض الطاقة │ ✓ │ تبديل خطوط التدفق
│ موجات التناغم │ ✓ │ تبديل مؤشرات التوافق
🔔 التنبيهات
━━━━━━━━━━━━━━━━━━━━━━━━━━━━━━━━━━━━━━━━━━━
⚡ تحول النظام — تغير نظام التقلب
🎵 تناغم عالي — جميع الطبقات متوافقة (>٨٥٪)
↕️ تغير الاتجاه — انعكس اتجاه الزخم
🔥 ارتفاع الشدة — تجاوزت الطاقة عتبة ٨٠٪
💡 نصائح للحصول على أفضل النتائج
━━━━━━━━━━━━━━━━━━━━━━━━━━━━━━━━━━━━━━━━━━━
1️⃣ الأطر الزمنية الأعلى — الشفق يعمل بشكل أفضل على ساعة فأكثر
2️⃣ ادمج مع حركة السعر — استخدم الشفق كسياق وليس إشارات
3️⃣ راقب التناغم — إعدادات التناغم العالي تربح أكثر
4️⃣ احترم النظام — لا تحارب التقلب المتطرف
5️⃣ تقاطع الطبقات — ارتداد من طبقات متعددة = دعم/مقاومة قوية
⚠️ إخلاء المسؤولية
━━━━━━━━━━━━━━━━━━━━━━━━━━━━━━━━━━━━━━━━━━━
هذا المؤشر للأغراض التعليمية فقط. الأداء السابق لا يضمن النتائج المستقبلية.
استخدم دائماً إدارة مخاطر مناسبة وقم بتحليلك الخاص قبل اتخاذ قرارات التداول.
█████████████████████████████████████████████████████████████

Dual MA Crossover with Profit Targets + Stop-LossChatGPT script and is a dual moving average crossover script with profit targets and stop loss

ADX + ATR% Zonas (Overlay - Azul si ambos, si no Naranja)OVERLAY
ADX
ATR
Pintado de Zonas para Entradas Seguras

Quicksilver Recovery Overlay [Strict]The Quicksilver Recovery Overlay is a proprietary visual analysis tool designed to identify high-probability reversal points in volatile markets. Originally developed for internal use to stabilize Prop Firm drawdowns, this script translates complex algorithmic logic into simple, actionable visual signals on your chart.
🚫 The Problem:
Most traders lose capital trying to "catch a falling knife." They buy too early during a crash and get liquidated before the reversal happens.
✅ The Solution:
This overlay forces discipline. It will only print a "QS BUY" signal when three specific institutional criteria are met simultaneously. If the setup is not perfect, the chart remains clean, keeping you out of bad trades.
The Logic (The "Triple Confluence" Engine):
Deep Exhaustion: The Stochastic RSI must pierce the extreme oversold zone (< 20), indicating seller exhaustion.
Momentum Crossover: The Fast %K line must cross above the Slow %D line, confirming momentum has shifted.
Heikin Ashi Filter: The current Heikin Ashi candle must be GREEN (Bullish). This filters out "fake" reversals where price is still wicking down.
Features:
Visual Signal Labels: Green "QS BUY" and Red "QS SELL" tags appear directly on the bar.
Zero Repaint Logic: Signals are confirmed on candle close.
Status Dashboard: A built-in monitor in the top right corner confirms the algorithm is active.
Recommended Settings:
Assets: ETHUSD, BTCUSD, XAUUSD (Gold).
Timeframes:
1-Minute: For scalping and drawdown recovery.
15-Minute: For swing trading and trend reversals.
How to Get Access:
This is a Protected Script. Access is granted exclusively to members of the Quicksilver Algo Systems ecosystem.
Get your license key here: whop.com
Risk Disclosure: Trading involves substantial risk. Past performance is not indicative of future results.

Session Candle Hunter 🎯🎯 Session Candle Hunter — Precision Session Mapping for Smart Traders
Session Candle Hunter 🎯 is a powerful tool designed to help traders identify and track the most important session candle of the trading day—commonly used for liquidity grabs, range mapping, volatility zones, and breakout anticipation.
Whether you trade NY session, London session, or custom time windows, this indicator automatically detects the candle at your chosen New York Time, extracts its high and low, and visually projects these levels into the current session.
🔍 What This Indicator Does
1️⃣ Detects the Key Session Candle
You select:
Hour of the candle (NY Time)
Candle timeframe (1H, 4H, 15m, etc.)
The script automatically:
Identifies the candle when it forms
Stores its High/Low
Prepares levels for visual projection
🎨 2️⃣ Highlights the Candle Zone
Optionally displays a colored zone (box) between the candle’s high and low:
Helps visualize the liquidity pocket
Useful for session traps, expansion moves, and fair value interpretation
You can choose:
Zone color
Whether to show it or not
Whether it should update only for the latest candle
📈 3️⃣ Draws High/Low Lines With Extensions
High and Low of the detected candle can be plotted as:
Standard lines
Or infinitely extended to the right
Great for identifying:
Breakouts
Retests
Range boundaries
Session expansion models
Optional labels display exact price levels.
🕐 4️⃣ Delayed Display Logic
The indicator only shows levels after a user-defined NY time.
For example:
Show lines only after 8:30 NY — perfect for traders who want pre-session levels hidden until relevant.
🔄 5️⃣ “Show Only Last” Mode
A clean, uncluttered mode that removes all historical drawings and only displays:
The latest zone
The latest high/low lines
Latest labels
Perfect for minimal-chart traders.
⚠️ 6️⃣ Alert System
Receive alerts the moment the targeted session candle forms:
“New Candle Detected”
🧾 7️⃣ Info Panel (Top-Left Corner)
Displays:
Target session hour
Display start time
Candle timeframe
Stored High/Low
Indicator name
Always visible and automatically updates.
⭐ Why Traders Love This Tool
✔ Helps visualize major liquidity zones
✔ Works on all markets & timeframes
✔ Perfect for ICT-style session concepts
✔ Helps anticipate session expansion
✔ Automates manual level drawing
✔ Clean visuals with optional minimal mode

One Point Global Net Liquidity The "Fuel" Behind the MarketMost traders look at price action, but price is often just a reflection of the money supply available in the system. This indicator tracks Global Net Liquidity—the actual amount of fiat currency available to flow into risk assets like Crypto and Equities.
Unlike standard "Money Supply" (M2) charts, this indicator focuses on Central Bank Balance Sheets, which is a more direct proxy for "Quantitative Easing" (QE) and "Quantitative Tightening" (QT).
How It Works (The Formula)
This script aggregates the balance sheets of the "Big 4" Central Banks, which represent ~90% of global liquidity. It automatically converts all values to USD Trillions for a standardized view.
{Global Liquidity} = {US Net Liquidity} + {ECB} + {PBoC} + {BoJ}
1. US Net Liquidity (The "Trader's" Formula) We do not just use the Fed's Total Assets. We subtract the money that is "stuck" outside the private economy:
(+) Fed Balance Sheet: Total Assets.
(-) TGA (Treasury General Account): The government's checking account. When this goes up, liquidity is drained from markets.
(-) RRP (Reverse Repo): Money parked by banks at the Fed overnight. When this goes up, liquidity is removed from the system.
2. Global Additions
ECB (Eurozone): Converted to USD.
PBoC (China): Converted to USD.
BoJ (Japan): Converted to USD.
How to Use This Indicator This indicator is designed as an Overlay on the main chart (using the Left Scale).
Correlation: Generally, when the Orange Line (Liquidity) trends up, Bitcoin and the S&P 500 trend up. When Central Banks tighten (line down), risk assets struggle.
The "Divergence" Signal (Alpha):
Bullish: If Price makes a Lower Low but Liquidity makes a Higher Low, it often signals seller exhaustion and a potential bottom.
Bearish: If Price makes a New High but Liquidity fails to follow (or drops), the rally may be unsupported and prone to a reversal.
Settings
Scale: This indicator is pinned to the Scale Left to allow it to overlay price action without distortion.
Data: Uses daily data from ECONOMICS and FRED feeds.

Simulated Liquidation Heatmap [QuantAlgo]🟢 Overview
This indicator visualizes where clusters of stop-loss orders and liquidation levels are likely located, displayed as a 'heatmap'. It's based on the concept of market structure liquidity: large groups of stop orders tend to gather around obvious technical levels (like swing highs and lows), and these pools of orders often attract price movement from institutional traders. The indicator uses a fractal-based algorithm to identify these high-probability liquidation zones and displays them as dynamic, color-coded boxes.
The key feature is the thermal color gradient, which indicates the freshness (age) and therefore the relative relevance of the liquidity zone. Hot colors (e.g., Red/Yellow) represent fresh clusters that have just formed, suggesting strong and immediate liquidity interest. Cold colors (e.g., Blue/Purple) represent aged or decaying clusters that are becoming less relevant over time. This visualization allows traders to anticipate potential liquidity sweeps (stop hunts) and understand areas of significant retail and institutional positioning.
🟢 Key Features
1. Liquidity Zone Heatmap
The core function is the identification of swing high and swing low price points using a user-defined Lookback period. These points are where retail traders are statistically most likely to place their stop-loss orders. The indicator simulates the clustering of these orders by drawing a zone (box) around the detected swing point, with the vertical size controlled by the Stop/Liquidation Zone Width (%) setting.
▶ Cluster Lookback: Defines the sensitivity of swing point detection. Lower values detect frequent, minor zones (scalping/intraday); higher values detect major, stronger swing points (swing trading).
▶ Zone Width (%): Sets the percentage range above and below the swing point where stops are simulated to cluster, accounting for slippage and typical stop placement spread.
▶ Liquidity Decay: Zones gradually fade in color intensity and are eventually removed after the user-defined Liquidity Decay Period (Bars), ensuring the heatmap only displays relevant, current liquidity areas.
▶ Round Number Filter: An optional filter that limits the display to liquidity zones occurring only at psychologically significant round numbers (e.g., $100, $1,500.00), which typically attract higher concentrations of orders.
2. Thermal Color Gradient
The heatmap's color is a direct function of the zone's age, providing a visual proxy for immediate relevance.
▶ Freshness: Newly created zones are displayed in the Hot Color (high relevance).
▶ Decay: As bars pass, the zone color transitions along the gradient toward the Cold Color and increased transparency (lower relevance), until it is removed entirely.
▶ Color Schemes: Multiple pre-configured and custom color schemes are available to optimize the visualization for different chart themes and color preferences.
3. Liquidity Heat Thermometer
An optional visual thermometer is displayed on the chart to provide an instant, overall assessment of the current liquidation heat level in the immediate vicinity of the price.
▶ Calculation: The thermometer calculates an aggregate heat score based on the age and proximity of all liquidity zones within a user-defined Zone Detection Range (%) of the current price.
▶ Visual Feedback: A marker (triangle) points to the corresponding level on the thermometer's color gradient (Hot to Cold). A high reading indicates price is close to fresh, dense stop clusters, suggesting high volatility or an imminent liquidity sweep is probable. A low reading indicates price is in a low-density or aged liquidity area.
▶ Customization: The thermometer's resolution, position, and text size are fully customizable for optimal chart placement and readability.
🟢 Practical Applications
▶ Anticipate Sweeps: Prioritize trading in the direction of Hot (fresh) liquidity zones. For example, a hot low-side zone suggests strong sell-side liquidity (stop-losses) is available for large buyers to sweep.
▶ Filter Noise: Use the Round Number Filter to focus only on the highest probability liquidation zones, which are often at clean, psychological price levels.
▶ Validate Entries: Combine the Heat Thermometer with price action analysis. A rising heat level indicates increasing proximity to a major stop cluster, signaling a potential turn or an aggressive market move to sweep those stops.
▶ Risk Management: Understand that price often acts dynamically around these zones. High heat levels imply high risk/reward setups; stops should be placed strategically beyond the defined Liquidation Zone Width.
▶ Multi-Timeframe Context: Higher timeframes (e.g., Daily, 4-Hour) often reveal more significant, major liquidity zones. Use this indicator on lower timeframes (e.g., 5-min, 15-min) for execution, but prioritize zones that align with higher-timeframe structures.
