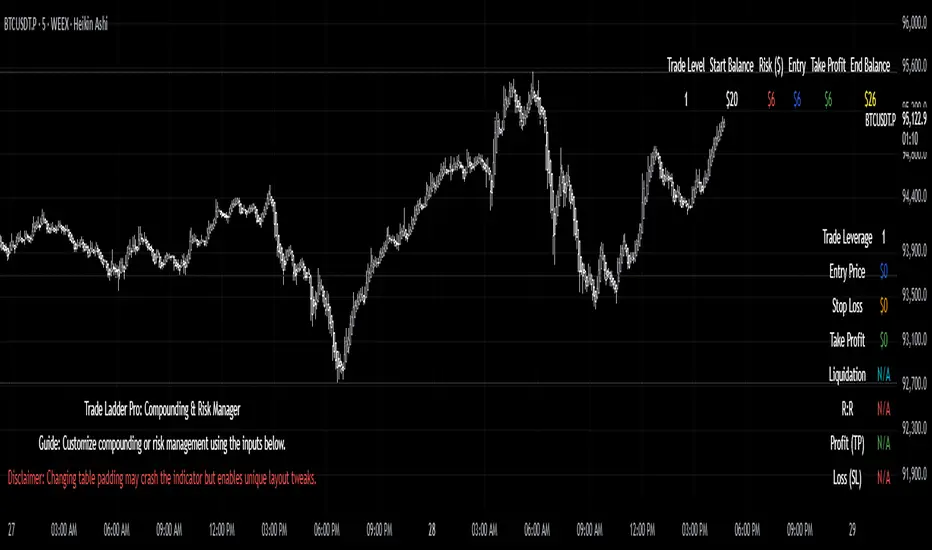
Trade Ladder Pro: Compounding & Risk ManagerTrade Ladder Pro: Compounding & Risk Manager
Inspired by the popular $20 to $52,000 trading challenge, this tool is designed to help you scale your trading account using systematic compounding and enhanced risk management techniques. Whether you’re aiming for disciplined growth or fine-tuning your risk/reward, Trade Ladder Pro offers a flexible approach to visualizing your trade levels.
How to Use:
Inputs:
Compounding Mode:
Set your starting balance, final balance goal, number of trades, and current trade level. You can move to the next trade after a successful trade in settings. The entries are not signals. They are there to help manage risk.
The script calculates the necessary compounding factor to grow your balance across the defined trades.
Risk Management Mode:
In addition to the above, specify a risk percentage and risk/reward ratio.
Input an entry price (or leave it at 0 to use the current price) to automatically compute the stop loss and take profit levels.
Display Options:
Choose the table’s position on the chart (e.g., Top Right, Top Left, Bottom Right, Bottom Left).
Pick between a vertical or horizontal layout for a display that suits your workflow.
Results:
The table will display the trade level, starting balance, risk amount, entry price, take profit, and (if in Risk Management mode) stop loss along with the projected ending balance.
Community & Feedback:
Your feedback is invaluable! Please share any tips or report any errors you encounter so we can continue to improve this tool. Happy trading!
Su Pine
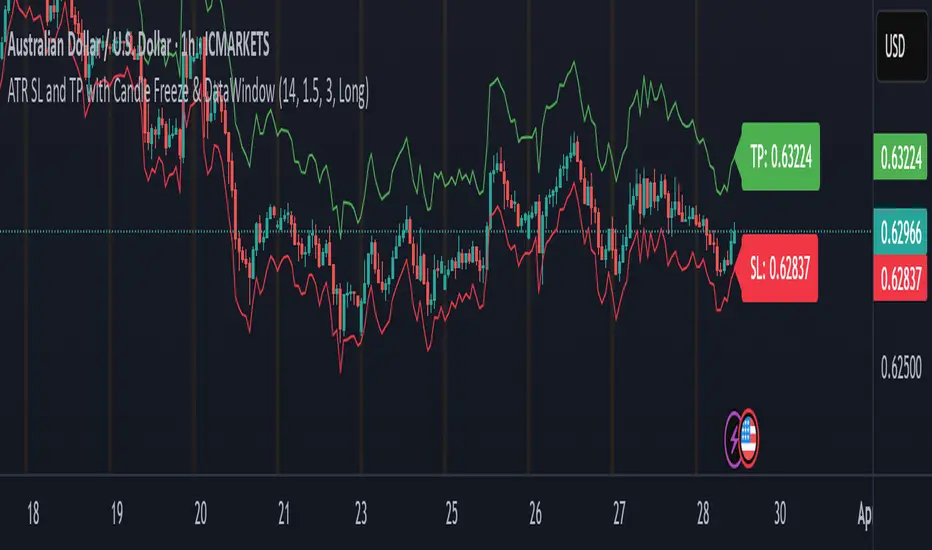
ATR SL and TP with Candle Freeze & DataWindowThis indicator uses the Average True Range (ATR) to automatically calculate your stop loss (SL) and take profit (TP) levels based on the current market volatility and your chosen multipliers. Here's how it works:
ATR Calculation:
The indicator computes the ATR, which measures the average market volatility over a set period. This value helps gauge how much the price typically moves.
SL and TP Determination:
Depending on whether you're in a long or short trade, the SL and TP are calculated relative to the current price:
For a long trade, the stop loss is set below the current price (by subtracting a multiple of the ATR) and the take profit is set above it (by adding a multiple of the ATR).
For a short trade, the calculations are reversed.
Candle Freeze Feature:
Once a new candle starts, the calculated SL and TP values are "frozen" for that candle. This means they remain constant during the candle's formation, preventing them from updating continuously as the price fluctuates. This can make it easier to plan your trades without the levels shifting mid-candle.
Data Window & Labels:
The SL and TP values are plotted on the chart as lines and displayed in labels for quick reference. Additionally, they appear in TradingView's Data Window, so you can easily copy the price numbers if needed.
Overall, the indicator is designed to help you manage your trades by setting dynamic, volatility-adjusted SL and TP levels that only update at the start of each new candle, aligning with your chosen timeframe. Let me know if you have any more questions or need further adjustments!
VSA Vol Key VSA Signals
(1) No Demand – Bearish Signal
Low volume, narrow spread.
Price rises, but volume does not increase → Weak market, lack of buyers.
If this appears in an uptrend, it may indicate a potential reversal.
(2) No Supply – Bullish Signal
Low volume, narrow spread.
Price declines, but volume does not increase → Weak selling pressure.
If this appears in an uptrend, it may confirm the continuation of the uptrend.
(3) Stopping Volume – Bullish Reversal Signal
Strong price decline, but unusually high volume.
Candle shows a long lower wick, closing near the top.
Indicates Smart Money absorbing supply, signaling a potential reversal upwards.
(4) Climactic Volume – Possible Trend Reversal
Extremely high volume with a sharp price increase or decrease.
If this occurs after a long trend, it may indicate a trend reversal.
Smart Money may be taking profits after a prolonged price movement.
(5) Effort vs. Result
If volume is high but price movement is weak → Inefficient buying/selling, possible reversal.
If volume is high and price moves strongly in the same direction → Trend is likely to continue.

Exact Dynamic Yield SpreadYield Spread Overlay
"Yield Spread Overlay" is an indicator that displays the yield spread between two currencies based on their respective 10-year bond yields. It overlays directly onto the Forex chart, allowing real-time visualization of the relationship between the yield spread and the currency pair's price movements.
This indicator saves time by avoiding the manual addition of bond yields. Unlike manual methods, it supports smaller timeframes (1h, 4h, etc.), making it particularly useful.
Several customization options are available to suit individual preferences:
Custom Display: Adjust the line thickness and color.
Scale Position: Choose between displaying the scale on the right or left side of the chart.
This indicator helps traders better understand currency relationships and can serve as an additional tool within a Forex trading strategy.
All feedback, suggestions, and critiques—positive or negative—are welcome to continually improve this tool.

Daily Range %The Daily Range % Indicator calculates and plots a percentage of the daily range (high to low) based on a custom lookback period. It identifies outside bars from past daily data, prioritizing the most recent unbroken range. If no outside bar is found, it defaults to yesterday's range. The selected percentage of this range is then displayed on the chart, updating once per 5-minute bar (or the chosen resolution).
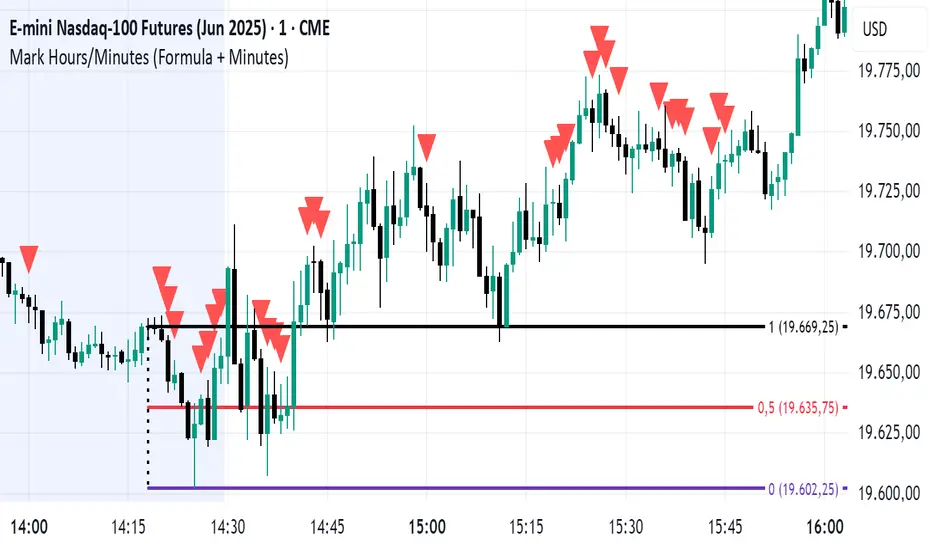
Mark Hours/Minutes (Formula + Minutes)This Pine Script code is a TradingView indicator that analyzes the hour and minutes of each candle in a 1-minute timeframe and plots a red triangle above the candle if one of the following conditions is met:
Sum/Difference Condition: The sum or the absolute difference of the hours and minutes is equal to 29, 35, or 71, with a tolerance of +/- 1.
Minutes Condition: The minutes are equal to 00, 29, or 35.
This indicator is based on the Goldbach theory and the "algo path" concept popularized by Hopiplaka, which posits that algorithmic trading paths often initiate from minute values of 00, 29, and 35. Use this indicator according to your trading strategy.
Correlation X macroeconomicsFind the correlation between financial assets and the main Brazilian macroeconomic variables:
SELIC rate (Red)
PIB (Green)
Inflation (Blue)
Employment and income (Yellow)
Unlike other indicators that measure the correlation between two assets, the indicator "Correlation X macroeconomics" measures, for example, the correlation that the VALE3 asset has with the SELIC rate.
The correlation is obtained by calculating the variation suffered by a given asset on the day a given Brazilian macroeconomic variable is released.
This indicator can be used on any financial asset.
Use time frame chart = 1 day.
To calculate the correlation, data published by IBGE and the Central Bank of Brazil over a period of time are used. This time period is different depending on the selected macroeconomic variable. Namely:
16 PIB disclosures (4 years)
24 SELIC rate disclosures (3 years)
24 disclosures of IPCA and employment and income data (2 years)
You can select one or more macroeconomic variables to check the effect of correlation separately on each of them.
This indicator "Correlation X macroeconomics" will be updated monthly, as detailed below:
At the end of the day on which the PIB is released
At the end of the day on which employment and income data are released
At the end of the day following the day on which the SELIC rate is published
On the last business day of the month if none of the aforementioned disclosures occur

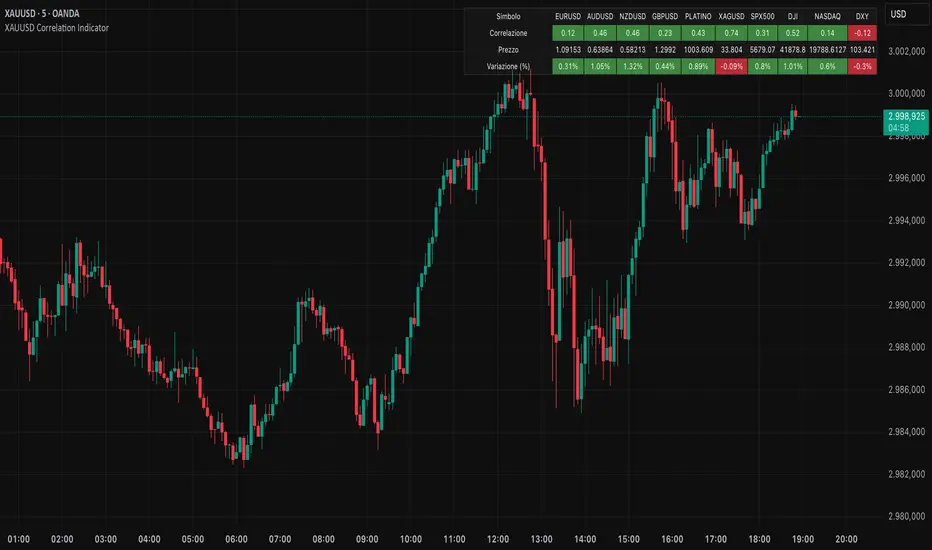
XAUUSD Correlation IndicatorXAUUSD Correlation Indicator
Questo indicatore per TradingView calcola e visualizza la correlazione tra il prezzo di XAUUSD (oro) e una serie di altri asset finanziari, tra cui valute (EURUSD, AUDUSD, NZDUSD, GBPUSD), metalli preziosi (platino, argento), indici azionari (SPX500, DJI, NASDAQ) e il dollaro statunitense (DXY).
L'indicatore offre:
1. Correlazione: Calcola la correlazione tra XAUUSD e gli altri asset su un periodo personalizzabile, dove un numero superiore allo 0 indica una correlazione positiva ed un numero inferiore allo 0 indica una correlazione negativa.
2. Variazione percentuale: Mostra la variazione percentuale dei prezzi degli asset rispetto all'apertura.
3. Visualizzazione personalizzabile: Permette di ordinare i dati in base alla correlazione o alla variazione percentuale.
4. Tabella interattiva: I risultati sono visualizzati in una tabella colorata, con opzioni per personalizzare i colori di sfondo, testo e bordi.
Ideale per trader e analisti che vogliono monitorare le relazioni tra l'oro e altri mercati in tempo reale, questo strumento aiuta a identificare opportunità di trading basate su correlazioni e tendenze di mercato.
TRP Stop-Loss and Position SizingScript is based on TRP to see both Long Stop Loss and Short Stop Loss, You can Also adjust the position size based on your capital and percentage risk.

*Auto Backtest & Optimize EngineFull-featured Engine for Automatic Backtesting and parameter optimization. Allows you to test millions of different combinations of stop-loss and take profit parameters, including on any connected indicators.
⭕️ Key Futures
Quickly identify the optimal parameters for your strategy.
Automatically generate and test thousands of parameter combinations.
A simple Genetic Algorithm for result selection.
Saves time on manual testing of multiple parameters.
Detailed analysis, sorting, filtering and statistics of results.
Detailed control panel with many tooltips.
Display of key metrics: Profit, Win Rate, etc..
Comprehensive Strategy Score calculation.
In-depth analysis of the performance of different types of stop-losses.
Possibility to use to calculate the best Stop-Take parameters for your position.
Ability to test your own functions and signals.
Customizable visualization of results.
Flexible Stop-Loss Settings:
• Auto ━ Allows you to test all types of Stop Losses at once(listed below).
• S.VOLATY ━ Static stop based on volatility (Fixed, ATR, STDEV).
• Trailing ━ Classic trailing stop following the price.
• Fast Trail ━ Accelerated trailing stop that reacts faster to price movements.
• Volatility ━ Dynamic stop based on volatility indicators.
• Chandelier ━ Stop based on price extremes.
• Activator ━ Dynamic stop based on SAR.
• MA ━ Stop based on moving averages (9 different types).
• SAR ━ Parabolic SAR (Stop and Reverse).
Advanced Take-Profit Options:
• R:R: Risk/Reward ━ sets TP based on SL size.
• T.VOLATY ━ Calculation based on volatility indicators (Fixed, ATR, STDEV).
Testing Modes:
• Stops ━ Cyclical stop-loss testing
• Pivot Point Example ━ Example of using pivot points
• External Example ━ Built-in example how test functions with different parameters
• External Signal ━ Using external signals
⭕️ Usage
━ First Steps:
When opening, select any point on the chart. It will not affect anything until you turn on Manual Start mode (more on this below).
The chart will immediately show the best results of the default Auto mode. You can switch Part's to try to find even better results in the table.
Now you can display any result from the table on the chart by entering its ID in the settings.
Repeat steps 3-4 until you determine which type of Stop Loss you like best. Then set it in the settings instead of Auto mode.
* Example: I flipped through 14 parts before I liked the first result and entered its ID so I could visually evaluate it on the chart.
Then select the stop loss type, choose it in place of Auto mode and repeat steps 3-4 or immediately follow the recommendations of the algorithm.
Now the Genetic Algorithm at the bottom right will prompt you to enter the Parameters you need to search for and select even better results.
Parameters must be entered All at once before they are updated. Enter recommendations strictly in fields with the same names.
Repeat steps 5-6 until there are approximately 10 Part's left or as you like. And after that, easily pour through the remaining Parts and select the best parameters.
━ Example of the finished result.
━ Example of use with Takes
You can also test at the same time along with Take Profit. In this example, I simply enabled Risk/Reward mode and immediately specified in the TP field Maximum RR, Minimum RR and Step. So in this example I can test (3-1) / 0.1 = 20 Takes of different sizes. There are additional tips in the settings.
━
* Soon you will start to understand how the system works and things will become much easier.
* If something doesn't work, just reset the engine settings and start over again.
* Use the tips I have left in the settings and on the Panel.
━ Details:
Sort ━ Sorting results by Score, Profit, Trades, etc..
Filter ━ Filtring results by Score, Profit, Trades, etc..
Trade Type ━ Ability to disable Long\Short but only from statistics.
BackWin ━ Backtest Window Number of Candle the script can test.
Manual Start ━ Enabling it will allow you to call a Stop from a selected point. which you selected when you started the engine.
* If you have a real open position then this mode can help to save good Stop\Take for it.
1 - 9 Сheckboxs ━ Allow you to disable any stop from Auto mode.
Ex Source - Allow you to test Stops/Takes from connected indicators.
Connection guide:
//@version=6
indicator("My script")
rsi = ta.rsi(close, 14)
buy = not na(rsi) and ta.crossover (rsi, 40) // OS = 40
sell = not na(rsi) and ta.crossunder(rsi, 60) // OB = 60
Signal = buy ? +1 : sell ? -1 : 0
plot(Signal, "🔌Connector🔌", display = display.none)
* Format the signal for your indicator in a similar style and then select it in Ex Source.
⭕️ How it Works
Hypothesis of Uniform Distribution of Rare Elements After Mixing.
'This hypothesis states that if an array of N elements contains K valid elements, then after mixing, these valid elements will be approximately uniformly distributed.'
'This means that in a random sample of k elements, the proportion of valid elements should closely match their proportion in the original array, with some random variation.'
'According to the central limit theorem, repeated sampling will result in an average count of valid elements following a normal distribution.'
'This supports the assumption that the valid elements are evenly spread across the array.'
'To test this hypothesis, we can conduct an experiment:'
'Create an array of 1,000,000 elements.'
'Select 1,000 random elements (1%) for validation.'
'Shuffle the array and divide it into groups of 1,000 elements.'
'If the hypothesis holds, each group should contain, on average, 1~ valid element, with minor variations.'
* I'd like to attach more details to My hypothesis but it won't be very relevant here. Since this is a whole separate topic, I will leave the minimum part for understanding the engine.
Practical Application
To apply this hypothesis, I needed a way to generate and thoroughly mix numerous possible combinations. Within Pine, generating over 100,000 combinations presents significant challenges, and storing millions of combinations requires excessive resources.
I developed an efficient mechanism that generates combinations in random order to address these limitations. While conventional methods often produce duplicates or require generating a complete list first, my approach guarantees that the first 10% of possible combinations are both unique and well-distributed. Based on my hypothesis, this sampling is sufficient to determine optimal testing parameters.
Most generators and randomizers fail to accommodate both my hypothesis and Pine's constraints. My solution utilizes a simple Linear Congruential Generator (LCG) for pseudo-randomization, enhanced with prime numbers to increase entropy during generation. I pre-generate the entire parameter range and then apply systematic mixing. This approach, combined with a hybrid combinatorial array-filling technique with linear distribution, delivers excellent generation quality.
My engine can efficiently generate and verify 300 unique combinations per batch. Based on the above, to determine optimal values, only 10-20 Parts need to be manually scrolled through to find the appropriate value or range, eliminating the need for exhaustive testing of millions of parameter combinations.
For the Score statistic I applied all the same, generated a range of Weights, distributed them randomly for each type of statistic to avoid manual distribution.
Score ━ based on Trade, Profit, WinRate, Profit Factor, Drawdown, Sharpe & Sortino & Omega & Calmar Ratio.
⭕️ Notes
For attentive users, a little tricks :)
To save time, switch parts every 3 seconds without waiting for it to load. After 10-20 parts, stop and wait for loading. If the pause is correct, you can switch between the rest of the parts without loading, as they will be cached. This used to work without having to wait for a pause, but now it does slower. This will save a lot of time if you are going to do a deeper backtest.
Sometimes you'll get the error “The scripts take too long to execute.”
For a quick fix you just need to switch the TF or Ticker back and forth and most likely everything will load.
The error appears because of problems on the side of the site because the engine is very heavy. It can also appear if you set too long a period for testing in BackWin or use a heavy indicator for testing.
Manual Start - Allow you to Start you Result from any point. Which in turn can help you choose a good stop-stick for your real position.
* It took me half a year from idea to current realization. This seems to be one of the few ways to build something automatic in backtest format and in this particular Pine environment. There are already better projects in other languages, and they are created much easier and faster because there are no limitations except for personal PC. If you see solutions to improve this system I would be glad if you share the code. At the moment I am tired and will continue him not soon.
Also You can use my previosly big Backtest project with more manual settings(updated soon)

High and Low with Horizontal TableHigh and Low with Horizontal Table Indicator
Overview
The "High and Low with Horizontal Table" indicator is designed for traders who wish to monitor key levels based on specific candle times, along with dynamic risk-to-reward ratios and ATR-based values. This indicator features real-time calculations, visual cues, and a table for quick reference of the calculated values.
Key Features
Custom Time Inputs:
Users can define two specific time inputs to select the candles for the High and Low prices. These times can target the same or separate candles.
ATR-based Calculation:
The indicator allows users to apply an ATR Multiplier to adjust the calculation of key levels. By default, the ATR multiplier is set to 1.2, but users can adjust it to their preferred value (e.g., 1.5 or 2).
Risk-to-Reward (R:R) Calculation:
The Risk-to-Reward Ratio (R:R) is used to calculate potential Take Profit (TP) levels based on the high and low of the selected candle(s).
The default R:R ratio is 2.0, but it can be customized to suit the trader’s strategy.
Visual Markings:
The High and Low values are plotted with subtle markers on the chart (cross style) for easy identification. The display of these markers is subdued for minimal visual distraction.
Horizontal Table Display:
A horizontal table is generated in the top-right corner of the chart, providing a quick reference for the following values:
High and Low of the selected candle(s)
High + ATR Multiplier and Low - ATR Multiplier
R:R ratio
Buy TP and Sell TP levels
Each value is displayed with a reasonable number of decimal places (4 decimals) for major forex pairs, XAUUSD, and BTCUSD.
Input Parameters
Hour and Minute for High Candle: Select the time for the candle that will determine the High.
Hour and Minute for Low Candle: Select the time for the candle that will determine the Low.
ATR Multiplier: A customizable input for adjusting the ATR-based calculations (default is 1.2).
Risk-to-Reward (R:R): Set the ratio to determine the TP levels (default is 2.0).
How It Works
The user defines two distinct time inputs (one for the High and one for the Low).
At the specified times, the indicator captures the High and Low prices of the candles.
The ATR is calculated and adjusted by the user-defined ATR Multiplier to determine buffers above the High and below the Low.
The Risk-to-Reward ratio is applied to calculate the Take Profit levels.
All of these values are displayed on the chart and updated in real time. The horizontal table ensures quick reference to all the key levels without cluttering the main chart.
Use Cases
Trend Trading: Identify potential support and resistance levels based on specific timeframes and adjust TP targets using ATR.
Scalping: Use the ATR and R:R calculations to target precise entry and exit points.
Market Opens: Track key market opens (such as New York and London) with candle times that reflect your trading strategy.
Conclusion
The High and Low with Horizontal Table indicator is a powerful tool for traders looking to combine precise candle-based level tracking with ATR-based risk management. By displaying key levels and TP targets in a clear, tabular format, traders can quickly assess and act on key price levels throughout their trading sessions.
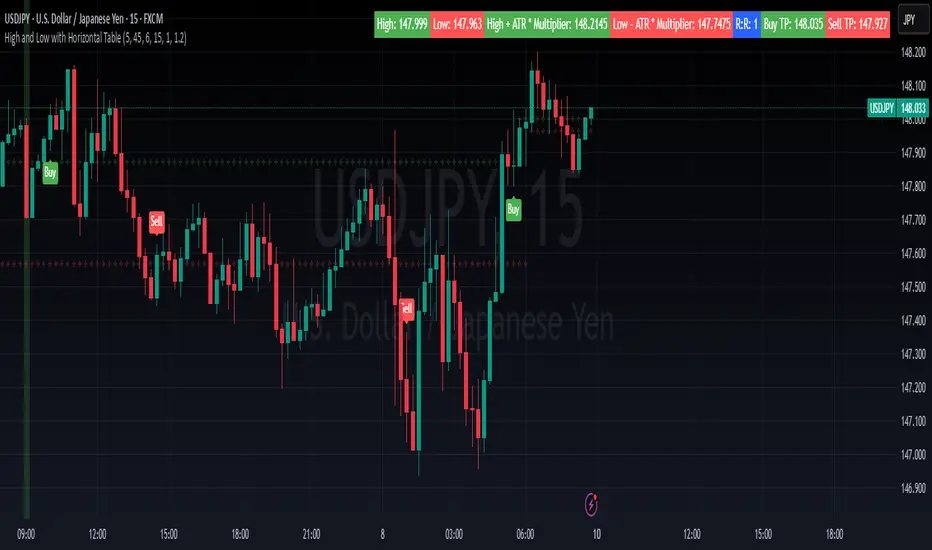
Chart Box Session Indicator [The Quant Science]This indicator allows highlighting specific time sessions within a chart by creating colored boxes to represent the price range of the selected session. Is an advanced and flexible tool for chart segmenting trading sessions. Thanks to its extensive customization options and advanced visualization features, it allows traders to gain a clear representation of key market areas based on chosen time intervals.
The indicator offers two range calculation modes:
Body to Body: considers the range between the opening and closing price.
Wick to Wick: considers the range between the session's low and high.
Body To Body
Wick to Wick
Key Features
1. Session Configuration
- Users can select the time range of the session of interest.
- Option to choose the day of the week for the calculation.
- Supports UTC timezone selection to correctly align data.
2. Customizable Visualization
- Option to display session price lines.
- Ability to show a central price line.
- Extension of session lines beyond the specified duration.
3. Design Display Configuration
- Three different background configurations to suit light and dark themes.
- Two gradient modes for session coloring:
- Centered: the color is evenly distributed.
- Off-Centered: the gradient is asymmetrical.
How It Works
The indicator determines whether the current time falls within the selected session, creating a colored box that highlights the corresponding price range. Depending on user preferences, the indicator draws horizontal lines at the minimum and maximum price levels and, optionally, a central line.
During the session:
- The lowest and highest session prices are dynamically updated.
- The range is divided into 10 bands to create a gradient effect.
- A colored box is generated to visually highlight the chosen session.
If the Extend Lines option is enabled, price lines continue even after the session ends, keeping the range visible for further analysis.
This indicator is useful for traders who want to analyze price behavior in specific timeframes. It is particularly beneficial for strategies based on market sessions (e.g., London or New York open) or for identifying accumulation and distribution zones.

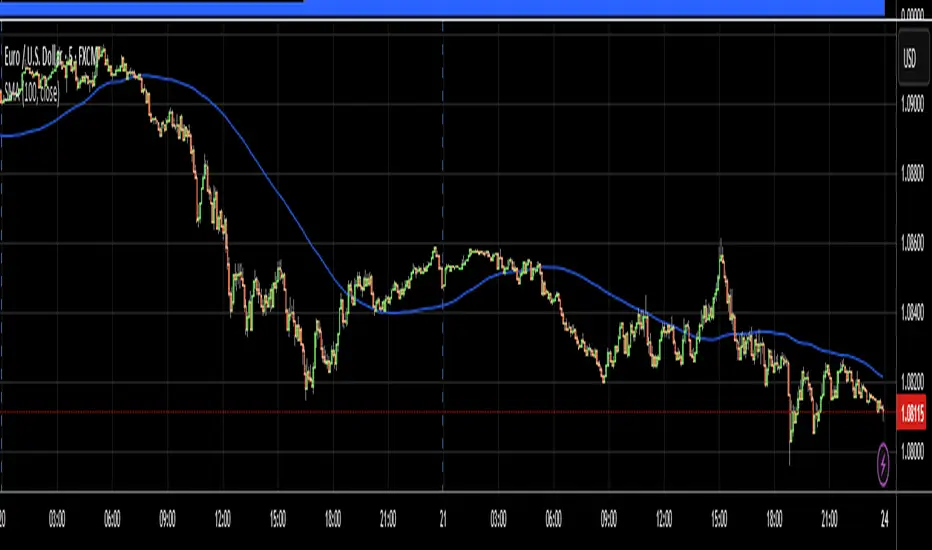
200 EMA AlertHow It Works:
The 200 EMA calculates the average price over the last 200 periods, giving more weight to recent price movements for a smoother and more responsive trend line.
It helps traders determine whether the market is in a bullish (above 200 EMA) or bearish (below 200 EMA) phase.
Why Traders Use the 200 EMA:
✅ Trend Confirmation – If the price is above the 200 EMA, the trend is bullish; if below, the trend is bearish.
✅ Dynamic Support & Resistance – Price often reacts around the 200 EMA, making it a key level for entries and exits.
✅ Works on All Timeframes – Whether on the 1-minute chart or the daily timeframe, the 200 EMA is effective for scalping, swing trading, and long-term investing.
✅ Easy to Combine with Other Indicators – Traders pair it with RSI, MACD, or price action for stronger confirmation.
How to Use It in Trading:
📌 Trend Trading – Buy when price pulls back to the 200 EMA in an uptrend; sell when price retests it in a downtrend.
📌 Breakout Strategy – A strong candle breaking above/below the 200 EMA signals a possible trend reversal.
📌 Filtering Trades – Many traders only take long trades above and short trades below the 200 EMA to align with the overall market trend.
Conclusion:
The 200 EMA is an essential indicator for traders of all levels, offering clear trend direction, strong support/resistance zones, and trade filtering for better decision-making. Whether you're trading forex, stocks, or crypto, mastering the 200 EMA can give you a significant edge in the markets. 🚀📈

Consecutive Bullish/Bearish Candles🔍 Overview:
This indicator detects market manipulation and deception by identifying sequences of consecutive bullish or bearish candles. It highlights potential reversal zones where trends may exhaust or trap traders before reversing.
📌 How It Works:
The user can set a custom number of consecutive bullish or bearish candles (default: 5).
If the set number of consecutive green (bullish) or red (bearish) candles appears, the indicator plots a signal on the chart.
This pattern often signals exhaustion, stop hunts, or market traps, making it useful for traders looking for reversal opportunities.
📊 Features:
✅ Customizable candle count for detection
✅ Visual signals (✅ for bullish, ❌ for bearish)
✅ Alerts support for automated notifications
✅ Works on all timeframes and all markets (crypto, stocks, forex)
⚠️ Note:
This indicator does not guarantee reversals but helps identify areas where traders may be trapped and a trend shift is likely. Always use it with other confluence factors like volume, support/resistance, and market sentiment.
🚀 Use this tool to spot market deception and trade smart!

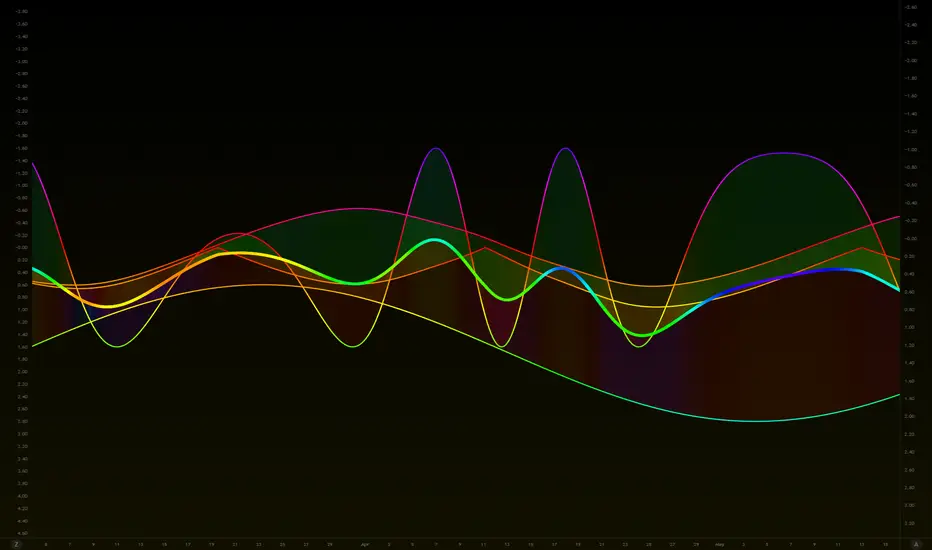
Wave Modulation Demo█ OVERVIEW
This script demonstrates Stacked Wave Modulation by visualizing four interconnected waves. Wave 1 is the base wave, influencing Wave 2's frequency, which in turn modulates Wave 3's amplitude, and finally, Wave 3 modulates Wave 4's phase. Explore the fascinating effects of wave modulation by adjusting the inputs for each wave and their modulation scales.
══════════════════════════════════════════════════
█ CONCEPTS
This script visualizes a cascade of wave modulations:
1 — Base Wave (Wave 1): This is the foundational wave. Its parameters (type, frequency, amplitude, phase, vertical shift) are directly controlled and serve as the basis for subsequent modulations.
2 — Frequency Modulation (Wave 2): Wave 2's frequency is modulated by Wave 1 . As Wave 1 oscillates, it dynamically changes the frequency of Wave 2 , creating interesting frequency variations. The Frequency Mod Scale input controls the intensity of this modulation.
3 — Amplitude Modulation (Wave 3): Building upon the cascade, Wave 3 's amplitude is modulated by Wave 2 . The peaks and troughs of Wave 2 influence the amplitude of Wave 3 , resulting in amplitude variations. The Amplitude Mod Scale input adjusts the strength of this amplitude modulation.
4 — Phase Modulation (Wave 4): Finally, Wave 4 's phase is modulated by Wave 3 . Wave 3 's oscillations shift the phase of Wave 4 , leading to phase-related distortions and dynamic wave patterns. The Phase Mod Scale input determines the extent of phase modulation.
5 — Stacked Wave (Average): The script calculates and plots the average of all four waves, providing a composite view of the combined modulation effects.
══════════════════════════════════════════════════
█ FEATURES
The script is organized into input groups for each wave, allowing for detailed customization:
1 — Wave 1: Base Wave
• Type : Select the waveform type for Wave 1 (Sine, Cosine, Triangle, Square).
• Frequency (Hz) : Sets the base frequency of Wave 1 in Hertz (cycles per second).
• Amplitude : Controls the vertical amplitude or height of Wave 1.
• Phase Shift (deg) : Adjusts the phase shift of Wave 1 in degrees, shifting the wave horizontally.
• Vertical Shift : Sets the vertical position of Wave 1 on the chart.
2 — Wave 2: Frequency Modulation
• Type : Select the waveform type for Wave 2.
• Base Frequency (Hz) : Sets the base frequency of Wave 2, before modulation.
• Amplitude : Controls the amplitude of Wave 2.
• Phase Shift (deg) : Adjusts the phase shift of Wave 2.
• Vertical Shift : Sets the vertical position of Wave 2.
• Frequency Mod Scale : Determines the degree to which Wave 1 modulates Wave 2's frequency. Higher values increase the modulation effect.
3 — Wave 3: Amplitude Modulation
• Type : Select the waveform type for Wave 3.
• Base Frequency (Hz) : Sets the base frequency of Wave 3.
• Amplitude : Controls the base amplitude of Wave 3, before modulation.
• Phase Shift (deg) : Adjusts the phase shift of Wave 3.
• Vertical Shift : Sets the vertical position of Wave 3.
• Amplitude Mod Scale : Determines the degree to which Wave 2 modulates Wave 3's amplitude. Higher values increase the modulation effect.
4 — Wave 4: Phase Modulation
• Type : Select the waveform type for Wave 4.
• Base Frequency (Hz) : Sets the base frequency of Wave 4.
• Amplitude : Controls the amplitude of Wave 4.
• Phase Shift (deg) : Sets the base phase shift of Wave 4, before modulation.
• Vertical Shift : Sets the vertical position of Wave 4.
• Phase Mod Scale : Determines the degree to which Wave 3 modulates Wave 4's phase. Higher values increase the modulation effect.
══════════════════════════════════════════════════
█ HOW TO USE
1. Add the "Stacked Wave Modulation Demo" script to your TradingView chart.
2. Explore the input settings. Each wave has its own group of customizable parameters.
3. Adjust the Type , Frequency , Amplitude , Phase Shift , and Vertical Shift for each wave to define their base characteristics.
4. Experiment with the modulation scales ( Frequency Mod Scale , Amplitude Mod Scale , Phase Mod Scale ) to control the intensity of the modulation effects between the waves.
5. Observe how the waves interact and how the modulations shape their forms and the final stacked wave (average).
══════════════════════════════════════════════════
█ NOTES
* This script utilizes the `waves` and `hsvColor` libraries. Look for other scripts on my profile.
* The frequencies are set in Hertz (cycles per second), which relate to bars on the chart. A frequency of 0.5 Hz means 0.5 cycles per bar, or 1 cycle every 2 bars.
* Adjusting the modulation scales allows you to fine-tune the visual impact of the modulation effects.
* The color of each wave plot is dynamically generated based on its value using the HSV color model for visual distinction.
* Feel free to modify and experiment with the script to create different modulation schemes or stacking methods.
Let me know if you have any other questions or would like further refinements!
Volume Flow Indicator Signals | iSolani
Volume Flow Indicator Signals | iSolani: Decoding Trend Momentum with Volume Precision
In markets where trends are fueled by institutional participation, discerning genuine momentum from false moves is critical. The Volume Flow Indicator Signals | iSolani cuts through this noise by synthesizing price action with volume dynamics, generating high-confidence signals when capital flows align with directional bias. This tool reimagines traditional volume analysis by incorporating volatility-adjusted thresholds and dual-layer smoothing, offering traders a laser-focused approach to trend identification.
Core Methodology
The indicator employs a multi-stage calculation to quantify volume-driven momentum:
Volatility-Adjusted Filter: Measures price changes via log returns, scaling significance using a 30-bar standard deviation multiplied by user-defined sensitivity (default: 2x).
Volume Normalization: Caps extreme volume spikes at 3x the 50-bar moving average, preventing distortion from anomalous trades.
Directional Volume Flow: Assigns positive/negative values to volume based on whether price movement exceeds volatility-derived thresholds.
Dual Smoothing: Applies consecutive SMA (3-bar) and EMA (14-bar) to create the Volume Flow Indicator (VFI) and its signal line, filtering out transient fluctuations.
Breaking New Ground
This implementation introduces three key innovations:
Adaptive Noise Gates: Unlike static volume oscillators, the sensitivity coefficient dynamically adjusts to market volatility, reducing false signals during choppy conditions.
Institutional Volume Capping: The vcoef parameter limits the influence of outlier volume spikes, focusing on sustained institutional activity rather than one-off trades.
Non-Repainting Signals: Generates single-per-trend labels (buy below bars, sell above) to avoid chart clutter while maintaining visual clarity.
Engine Under the Hood
The script executes through five systematic stages:
Data Preparation: Computes HLC3 typical price and its logarithmic rate of change.
Threshold Calculation: Derives dynamic cutoff levels using 30-period volatility scaled by user sensitivity.
Volume Processing: Filters raw volume through a 50-bar SMA, capping extremes at 3x average.
VFI Construction: Sums directional volume flow over 50 bars, smoothed with a 3-bar SMA.
Signal Generation: Triggers alerts when VFI crosses zero, confirmed by a 14-bar EMA crossover.
Standard Configuration
Optimized defaults balance responsiveness and reliability:
Volume MA: 50-bar smoothing window
Sensitivity: 2.0 (doubles volatility threshold)
Signal Smoothing: 14-bar EMA
Volume Cap: 3x average (hidden parameter)
VFI Smoothing: Enabled (3-bar SMA)
By fusing adaptive volume filtering with price confirmation logic, the Volume Flow Indicator Signals | iSolani transforms raw market data into institutional-grade trend signals. Its ability to mute choppy price action while amplifying high-conviction volume moves makes it particularly effective for spotting early trend reversals in equities, forex, and futures markets.

SMA Strategy Builder: Create & Prove Profitability📄 Pine Script Strategy Description (For Publishing on TradingView)
🎯 Strategy Title:
SMA Strategy Builder: Create & Prove Profitability
✨ Description:
This tool is designed for traders who want to build, customize, and prove their own SMA-based trading strategies. The strategy tracks capital growth in real-time, providing clear evidence of profitability after each trade. Users can adjust key parameters such as SMA period, take profit levels, and initial capital, making it a flexible solution for backtesting and strategy validation.
🔍 Key Features:
✅ SMA-Based Logic:
Core trading logic revolves around the Simple Moving Average (SMA).
SMA period is fully adjustable to suit various trading styles.
🎯 Customizable Take Profit (TP):
User-defined TP percentages per position.
TP line displayed as a Step Line with Breaks for clear segmentation.
Visual 🎯TP label for quick identification of profit targets.
💵 Capital Tracking (Proof of Profitability):
Initial capital is user-defined.
Capital balance updates after each closed trade.
Shows both absolute profit/loss and percentage changes for every position.
Darker green profit labels for better readability and dark red for losses.
📈 Capital Curve (Performance Visualization):
Capital growth curve available (hidden by default, can be enabled via settings).
📏 Dynamic Label Positioning:
Label positions adjust dynamically based on the price range.
Ensures consistent visibility across low and high-priced assets.
⚡ How It Works:
Long Entry:
Triggered when the price crosses above the SMA.
TP level is calculated as a user-defined percentage above the entry price.
Short Entry:
Triggered when the price crosses below the SMA.
TP level is calculated as a user-defined percentage below the entry price.
TP Execution:
Positions close immediately once the TP level is reached (no candle close confirmation needed).
🔔 Alerts:
🟩 Long Signal Alert: When the price crosses above the SMA.
🟥 Short Signal Alert: When the price crosses below the SMA.
🎯 TP Alert: When the TP target is reached.
⚙️ Customization Options:
📅 SMA Period: Choose the moving average period that best fits your strategy.
🎯 Take Profit (%): Adjust TP percentages for flexible risk management.
💵 Initial Capital: Set the starting capital for realistic backtesting.
📈 Capital Curve Toggle: Enable or disable the capital curve to track overall performance.
🌟 Why Use This Tool?
🔧 Flexible Strategy Creation: Adjust core parameters and create tailored SMA-based strategies.
📈 Performance Proof: Capital tracking acts as real proof of profitability after each trade.
🎯 Immediate TP Execution: No waiting for candle closures; profits lock in as soon as targets are hit.
💹 Comprehensive Performance Insights: Percentage-based and absolute capital tracking with dynamic visualization.
🏦 Clean Visual Indicators: Strategy insights made clear with dynamic labeling and adjustable visuals.
⚠️ Disclaimer:
This script is provided for educational and informational purposes only. Trading financial instruments carries risk, and past performance does not guarantee future results. Always perform your own due diligence before making any trading decisions.

Stock Earnings Viewer for Pine ScreenerThe script, titled "Stock Earnings Viewer with Surprise", fetches actual and estimated earnings, calculates absolute and percent surprise values, and presents them for analysis. It is intended to use in Pine Screener, as on chart it is redundant.
How to Apply to Pine Screener
Favorite this script
Open pine screener www.tradingview.com
Select "Stock Earnings Viewer with Surprise" in "Choose indicator"
Click "Scan"
Data
Actual Earnings: The reported earnings per share (EPS) for the stock, sourced via request.earnings().
Estimated Earnings: Analyst-predicted EPS, accessed with field=earnings.estimate.
Absolute Surprise: The difference between actual and estimated earnings (e.g., actual 1.2 - estimated 1.0 = 0.2).
Percent Surprise (%): The absolute surprise as a percentage of estimated earnings (e.g., (0.2 / 1.0) * 100 = 20%). Note: This may return NaN or infinity if estimated earnings are zero, due to division by zero.
Practical Use
This screener script allows users to filter stocks based on earnings metrics. For example, you could screen for stocks where Percent Surprise > 15 to find companies exceeding analyst expectations significantly, or use Absolute Surprise < -0.5 to identify underperformers.

Astro R4.0Regarding the code that has a significant impact on Pine Community and many feel helped by it, this is the code that I ported from VBA to PineScript which comes from simontelescopium owner of astroexcel dot wordpress dot com and "astrofnc" by Keith Burnett, previously I used it personally but I forgot to give a citation to those who are entitled to them both so that when I shared it for community use and it has been shared by brother @BarefootJoey with the additions made by him personally, there was no citation for them.
Apologies for my negligence because I am only human.
Hopefully with this script it can help the community to see the potential for implementation in the trading world as a significant variable.
Finally, I publish this script as a reference to find out astronomical charts presented in table form to make it easier to visualize and debug as long as the input.timestamp() allow it.
Future updates for optimization using library of brother @BarefootJoey
Thank you.

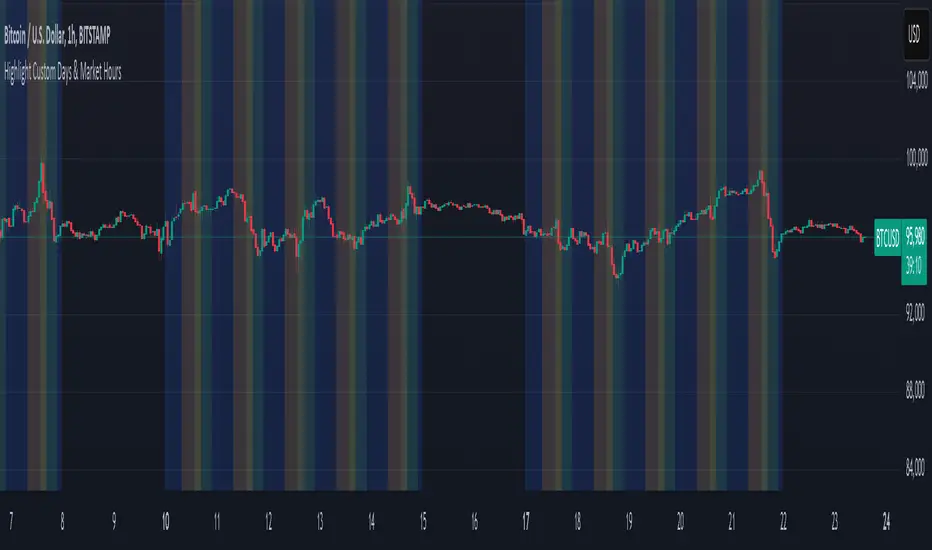
Mon to Fri + LSE and NYSE📌 Highlight Custom Days & Market Hours Indicator 📌
🔹 Overview:
This script allows traders to visually highlight specific weekdays and market sessions directly on their TradingView charts. With customizable checkboxes, you can choose which days of the week to highlight, along with session times for the New York Stock Exchange (NYSE) and London Stock Exchange (LSE).
🔹 Features:
✅ Select individual weekdays (Monday–Friday) to highlight in blue
✅ Highlight NYSE open hours (2:30 PM – 9:30 PM UK time) in green
✅ Highlight LSE open hours (8:00 AM – 4:30 PM UK time) in orange
✅ Ensures NYSE & LSE sessions are only highlighted on weekdays (no weekends)
✅ Clean and simple visualization for enhanced market awareness
🔹 How to Use:
1️⃣ Add the indicator to your TradingView chart
2️⃣ Use the settings panel to enable/disable specific weekdays
3️⃣ Toggle NYSE or LSE session highlights based on your trading preference
🚀 Perfect for traders who follow institutional sessions and want better time-based confluence in their strategies!
Auto Levels Test RHAuto Levels Test RH is an indicator that automatically draws support and resistance levels based on local extremes and the ZigZag pattern. It helps traders identify key levels for entering and exiting trades. The indicator analyzes the last 100 bars and determines significant price zones.

Cash And Carry Arbitrage BTC Compare Month 6 by SeoNo1Detailed Explanation of the BTC Cash and Carry Arbitrage Script
Script Title: BTC Cash And Carry Arbitrage Month 6 by SeoNo1
Short Title: BTC C&C ABT Month 6
Version: Pine Script v5
Overlay: True (The indicators are plotted directly on the price chart)
Purpose of the Script
This script is designed to help traders analyze and track arbitrage opportunities between the spot market and futures market for Bitcoin (BTC). Specifically, it calculates the spread and Annual Percentage Yield (APY) from a cash-and-carry arbitrage strategy until a specific expiry date (in this case, June 27, 2025).
The strategy helps identify profitable opportunities when the futures price of BTC is higher than the spot price. Traders can then buy BTC in the spot market and short BTC futures contracts to lock in a risk-free profit.
1. Input Settings
Spot Symbol: The real-time BTC spot price from Binance (BTCUSDT).
Futures Symbol: The BTC futures contract that expires in June 2025 (BTCUSDM2025).
Expiry Date: The expiration date of the futures contract, set to June 27, 2025.
These inputs allow users to adjust the symbols or expiry date according to their trading needs.
2. Price Data Retrieval
Spot Price: Fetches the latest closing price of BTC from the spot market.
Futures Price: Fetches the latest closing price of BTC futures.
Spread: The difference between the futures price and the spot price (futures_price - spot_price).
The spread indicates how much higher (or lower) the futures price is compared to the spot market.
3. Time to Maturity (TTM) and Annual Percentage Yield (APY) Calculation
Current Date: Gets the current timestamp.
Time to Maturity (TTM): The number of days left until the futures contract expires.
APY Calculation:
Formula:
APY = ( Spread / Spot Price ) x ( 365 / TTM Days ) x 100
This represents the annualized return from holding a cash-and-carry arbitrage position if the trader buys BTC at the spot price and sells BTC futures.
4. Display Information Table on the Chart
A table is created on the chart's top-right corner showing the following data:
Metric: Labels such as Spread and APY
Value: Displays the calculated spread and APY
The table automatically updates at the latest bar to display the most recent data.
5. Alert Condition
This sets an alert condition that triggers every time the script runs.
In practice, users can modify this alert to trigger based on specific conditions (e.g., APY exceeds a threshold).
6. Plotting the APY and Spread
APY Plot: Displays the annualized yield as a blue line on the chart.
Spread Plot: Visualizes the futures-spot spread as a red line.
This helps traders quickly identify arbitrage opportunities when the spread or APY reaches desirable levels.
How to Use the Script
Monitor Arbitrage Opportunities:
A positive spread indicates a potential cash-and-carry arbitrage opportunity.
The larger the APY, the more profitable the arbitrage opportunity could be.
Timing Trades:
Execute a buy on the BTC spot market and simultaneously sell BTC futures when the APY is attractive.
Close both positions upon futures contract expiry to realize profits.
Risk Management:
Ensure you have sufficient margin to hold both positions until expiry.
Monitor funding rates and volatility, which could affect returns.
Conclusion
This script is an essential tool for traders looking to exploit price discrepancies between the BTC spot market and futures market through a cash-and-carry arbitrage strategy. It provides real-time data on spreads, annualized returns (APY), and visual alerts, helping traders make informed decisions and maximize their profit potential.

Oblique StrategiesHi, this is a fun script that will print an Oblique Strategy to help you think laterally for the day of trading ahead of you.
Oblique Strategies are a concept conceived by Brian Eno the Music Producer, Artist, and modern-day philosopher. Oblique Strategies are a pack of 52 cards that have a creative suggestion on each one. When Brian was at a point at which he could not see a clear way forward in his creations, he would pick out a random card out of the Oblique Strategies pack, to help him think differently as to how to move forward. They are specifically devised for music creators, but i find the help in a multitude of situations.
Enjoy!
