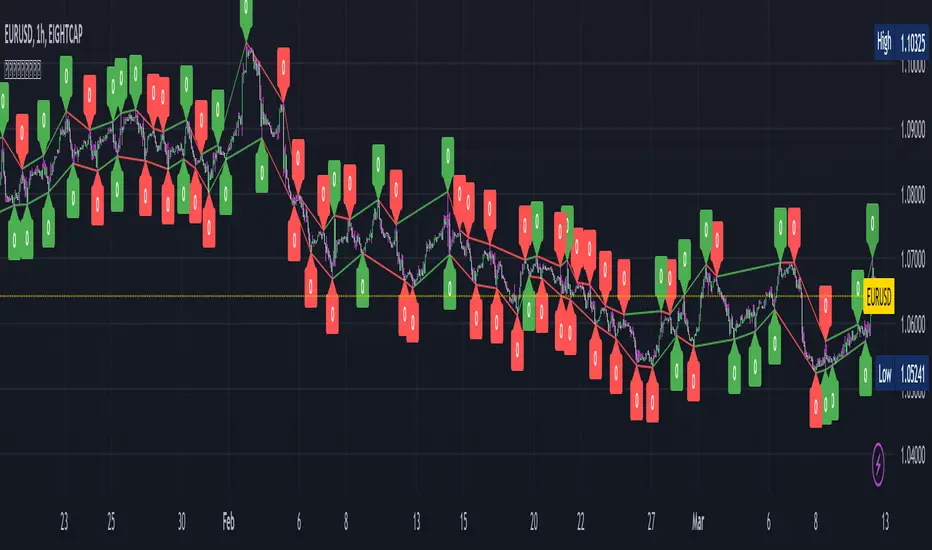
Unraided Liquidity and S/R PivotsThis indicator is designed to show key pivot points, also known as levels, which could provide good trade entries.
Utilising liquidity concepts, untested pivot levels can be a good place to enter a trade after the pivot is tested, liquidity is taken and the direction reverses.
Alternatively, utilising the option of viewing already tested levels, you can easily see the key support and resistance areas that price is likely to have a strong reaction to, whether it wants to go toward or bounce away from these levels.
The indicator does not give buy and sell signals, it is up to you to use the levels to form your trading plan.
Oorah.
Pivot

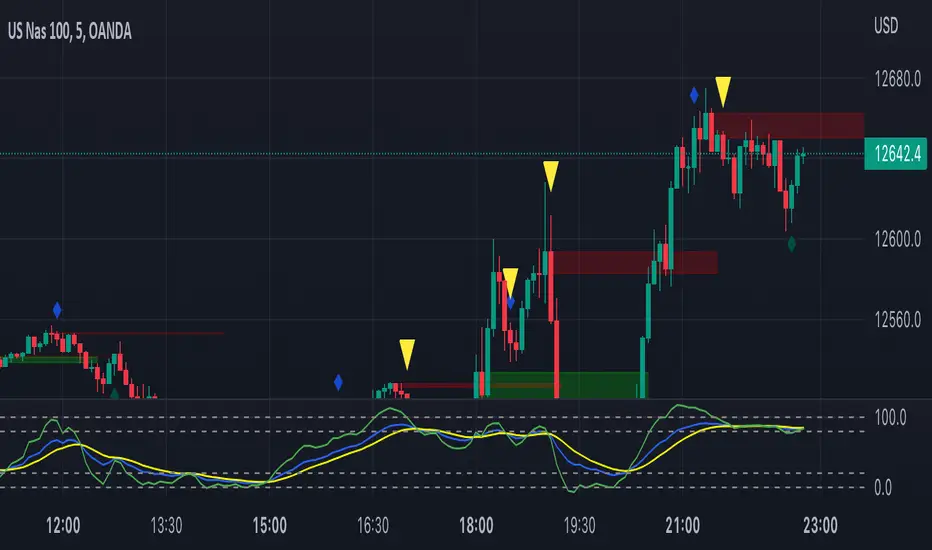
Shotoki Pivot Resistance SupportHi,
here is a script I wrote based on Pivot points. It detects HH, HL, LL, LH
the yellow resistances/supports are from a higher timeframe
the fuchsia ones are supports for the current timeframe, it resets when the past Low is too old or it detects a new one
the blue ones are resistances for the current timeframe, it resets when the past High is too old or it detects a new one
Shotoki

2nd 3rd 4th Order PivotsThis indicator calculates pivots of 2nd, 3rd and 4th order in the current timeframe.
The idea is borrowed from the book "The Art and Science of Technical Trading" by Adam Grimes:
"A pivot high is a bar that has a higher high than the bar that came before it and the bar that comes after it"
"Second-order pivot highs are first-order pivot highs that are preceded and followed by lower first-order pivot highs.
The type of picot calculation can be found as well in script "Higher Order Pivots" by rumpypumpydumpy. However, this script is different in the following ways:
1. Shows pivots of order 2, 3 and 4
2. The chart timeframe can be different than the pivot timeframe, allowing e.g. to map daily pivots to intraday charts via lines
3. Labels and/or lines can be used to show pivot points
4. Use of extended session data can be enabled/disabled, independently from the current chart settings
5. To disable older pivots, a starting time for the pivot calculation can be set
Please consider following limitations:
1. Maximum of 500 drawing objects per chart. Use Notification option to keep track of when running out of chart objects.
2. Lookback history: The max lookback history is limited by the currently selected timeframe. E.g. on a 5min timeframe, 20000 bars (Premium Plan) result in approx. 5 months of lookback period, meaning you may want to verify with a 30 min or higher chart to get a complete picture of pivots.

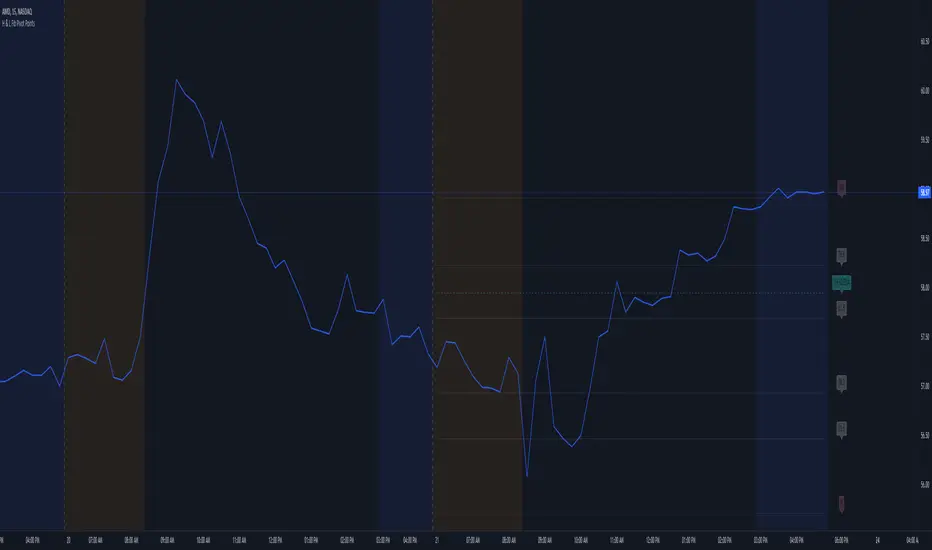
Price Pivots for NASDQ 100 StocksPrice Pivots for NASDQ 100 Stocks
What is this Indicator?
• This indicator calculates the price range a Stock can move in a Day.
Advantages of this Indicator
• This is a Leading indicator, not Dynamic or Repaint.
• Helps to identify the tight range of price movement.
• Can easily identify the Options strike price.
• Develops a discipline in placing Targets.
Disadvantages of this Indicator
• The indicator is specifically made for NASDQ 100 stocks. The levels won't work for other stocks.
• The indicator shows nothing for other indexes and stocks other than above mentioned.
• The data need to be entered manually.
Who to use?
Highly beneficial for Day Traders, it can be used for Swing and Positions as well.
What timeframe to use?
• Any timeframe.
• The highlighted levels in Red and Green will not show correct levels in 1 minute timeframe.
• 5min is recommended for Day Traders.
When to use?
• Wait for proper swing to form.
• Recommended to avoid 1st 1 hour or market open, that is 9.15am to 10.15 or 10.30am.
• Within this time a proper swing will be formed.
What are the Lines?
• The concept is the price will move from one pivot to another.
• Entry and Exit can be these levels as Reversal or Retracement.
Gray Lines:
• Every lines with price labels are the Strike Prices in the Option Chain.
• Price moves from 1 Strike Price level to another.
• The dashed lines are average levels of 2 Strike Prices.
Red & Green Lines:
• The Red and Green Lines will appear only after the first 1 hour.
• The levels are calculated based on the 1st 1 hour.
• Red Lines are important Resistance levels, these are strong Bearish reversal points. It is also a breakout level, this need to be figured out from the past levels, trend, percentage change and consolidation.
• Green Lines are important Support levels, these are strong Bullish reversal points. It is also a breakdown level, this need to be figured out from the past levels, trend, percentage change and consolidation.
What are the Labels?
• First Number: Price of that level.
• Numbers in (): Percentage change and Change of price from LTP (Last Traded Price) to that Level.
How to use?
Entry:
• Enter when price is closer to the Red or Green lines.
• Enter after considering previous Swing and Trend.
• Note the 50% of previous Swing.
• Enter Short when price reverse from each level.
• If 50% of swing and the pivot level is closer it can be a good entry.
Exit:
• Use the logic of Entry, each level can be a target.
• Exit when price is closer to the Red or Green lines.
Indicator Menu
Source
• Custom: Enter the price manually after choosing the Source as Custom to show the Pivots at that price.
• LTP: Pivot is calculated based on Last Traded Price.
• Day Open: Pivot is calculated based on current day opening price.
• PD Close: Pivot is calculated based on previous day closing price.
• PD HL2: Pivot is calculated based on previous day average of High and Low.
• PD HLC3: Pivot is calculated based on previous day average of High, Low and Close.
"Time (Vertical Lines)"
• This is a marker of every 1 hour.
• Usually major price movement happen between previous day last 1 hour to today first 1 hour.
• Two swings can happen between first 2 hour of current day.
• At the end of the day last 1 hour another important movement will happen.
• Usually rest of the time won't show any interesting movement.
To the Users
• Certain symbols may show the levels as a single line. For such symbols choose a different Source or Timeframe from the indicator menu.
• Please inform if any of the Symbol's price levels don't react to the pivots , include the Symbol a well.
• Also inform if you notice any wrong values, errors or abnormal behavior in the indicator.
• Feel free to suggest or adding new features and options.
General Tips
• It is good if Stock trend is same as that of Index trend.
• Lots of indicators creates lots of confusion.
• Keep the chart simple and clean.
• Buy Low and Sell High.
• Master averages or 50%.
• Previous Swing High and Swing Low are crucial.
Important Note
• Currently the levels are in testing stage.
• Eventually the levels of certain symbols will be corrected after each update and test.

Average Daily Range (ADR) (Multi Timeframe, Multi Period)Average Daily Range (ADR)
(Multi Timeframe, Multi Period, Extended Levels)
Tips
• Narrow Zones are an indication of breakouts. It can be a very tight range as well.
• Wider Zones can be Sideways or Volatile.
What is this Indicator?
• This is Average Daily Range (ADR) Zones or Pivots.
• This have Multi Timeframe, Multi Period (Up to 3 Levels) and Extended Target Levels.
Advantages of this Indicator
• This is a Leading indicator, not Dynamic or Repaint.
• Helps to identify the reversal points.
• The levels are more accurate and not like the old formulas.
• Can practically follow the Buy Low and Sell High principle.
• Helps to keep minimum Stop Loss.
Who to use?
• Highly beneficial for Day Traders
• It can be used for Swing and Positions as well.
What timeframe to use?
• Any timeframe.
When to use?
• Any market conditions.
How to use?
Entry
• Long entry when the Price reach at or closer to the Green Support zone.
• Long entry when the Price retrace to the Red Resistance zone.
• Short entry when the Price reach at or closer to the Red Resistance zone.
• Short entry when the Price retrace to the Green Support zone.
• Long or Short at the Pivot line.
Exit
• Use past ADR levels as targets.
• Or use the Target levels in the indicator for breakouts.
• Use the Pivot line as target.
• Use Support or Resistance Zones as targets in reversal method.
What are the Lines?
Gray Line:
• It the day Open or can be considered as Pivot.
Red & Green ADR Zones:
• Red Zone is Resistance.
• Green Zone is Support.
• Mostly price can reverse from this Zones.
• Multiple Red and Green Lines forms a Zone.
• These lines are average levels of past days which helps to figure out the maximum and minimum price range that can be moved in that day.
• The default number of days are 5, 7 and 14. This can be customized.
Red & Green Target Lines:
• These are Target levels.
What are the Labels?
• First Number: Price of that level.
• Numbers in (): Percentage change and Change of price from LTP (Last Traded Price) to that Level.
General Tips
• It is good if Stock trend is same as that of the Index trend.
• Lots of indicators creates lots of confusion.
• Keep the chart simple and clean.
• Buy Low and Sell High.
• Master averages or 50%.

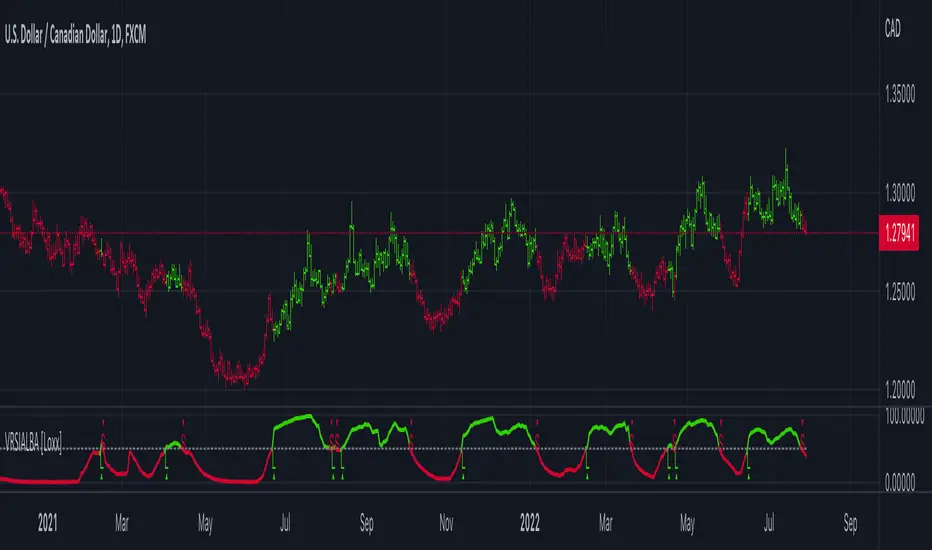
Variety RSI of Adaptive Lookback Averages [Loxx]Variety RSI of Adaptive Lookback Averages uses an adaptive lookback algorithm in order to determine dynamic length inputs to get used to smooth the input price source before calculating your choice of 6 different types of RSI. This ALB algorithm counts bars back until X many swing counts are reached.
Included:
Bar coloring
2 signal variations w/ alerts
Turk Pivot Candle Order BlocksOrder Blocks based on pivot reversal candle
When a pivot High or Pivot Low is found and confirmed, a box will be plotted on the open and close values of that pivot candle
You also have the ability to change the amount of candles the box stretches over as well as the colors of the bullish and bearish boxes
How To Use:-
Pivot points often provide Support and Resistance points on their own,
one way of marking up order blocks is by taking the pivot candle and marking that up as a resistance area where you could be looking for price to reverse
High and Low Fibonacci Pivot PointsThis is a standard fibonacci retracement level indicator and free to use for all. I couldn't find any decent retracement levels that works for me (and definitely wasted money on paid script access that didn't work so well for my trading style), so I created this for my own use and now sharing it with the TradingView community. Fibonacci retracement levels help traders predict key areas where a stock/security may find support or resistance. The common ratios are available, such as 23.6, 38.2, 61.8 and so forth. You can choose from Day, Week or Month for your fibonacci retracement lines. In order to keep in sync with my particular style of keeping charts nice and clean, I've created this indicator with defaults to use friendly color schemes. You can of course, choose another color, etc... that fits your own taste. All of my published scripts utilize TradingView's version 5 scripting.
Main Features:
- Show or hide pre-market high and lows (the pre-market high & lows are hidden by default)
- Show or hide the 1-hour 20 EMA line (hidden by default, as this is more uncommon than the 1-hour 50 EMA line for potential support or resistance)
- Show or hide the 1-hour 50 EMA line
- Show or hide the fibonacci retracement lines (the 50% line is hidden by default)
- Option to allow the fibonacci retracement lines to start out the first few minutes of market open to use the pre-market high & low. Once the stock/security price breaks either the pre-market high or pre-market low, it reverts to using the day's high and low. This only works on chart timeframes under the daily time frame.
FYI:
All customizable settings have a help/info window. Please refer to the help/info window, if you're unsure of what a setting does what. Also, note that I wrote and published this script after market close, so I haven't had the chance to check/test if everything works, which can only be fully verified during market open hours (for non-crypto securities).
* Please note that this script is in its early beta stage and there could be bugs. This is being provided as is and the information provided by this script is meant for informational/entertainment purposes only.
Pivot Points with Slopes - By Necromancer█ OVERVIEW
- This script draws array-based Pivot Points with the calculated slope on the next connecting point.
- The script works left to right, but could be be modified.
- Looks best with Label-Style on Diamonds, without Slope Text drawn.
█ Thank You!
- Many more to come which will utilize these fundamentals!
🅝🅔🅒🅡🅞🅜🅐🅝🅒🅔🅡
MoonFlag Converging BandsThis script form a cloud that is made from multiple lines that are each similar to a moving average.
However, each line is different to moving averages as it uses an algorithm that is nonlinear, 'overshoot moving averages' better explains how they work.
A cloud (visible on the indicator plot) is formed from multiple 'overshoot moving average' lines, each with a different lookback length.
A single variable is provided in the settings which extends all lines which form the cloud.
So the cloud is formed from the max and min from multiple 'nonlinear' moving averages.
What is interesting here is that, ....when the cloud lines narrow or converge..... ,this signifies that all moving averages are narrowing.
However, as the algo does not use standard moving averages - it is a bit more spicy and has some merit with predicting a big or biggish move in advance, before it happens.
So, the overshoot moving averages have a predictive quality.
Whereas, standard moving averages always lag the present time price action.
Indeed, most indicators are based on moving averages and lag the price action.
I'll try and explain how the overshoot moving average works...
Each line which forms the cloud gives an indication of the price trend momentum.
So if the price action rises above a line. the line will follow and move up, however, when the price action reduces momentum or starts to move downwards, the underlying momentum will push the line to overshoot the price action. Hence the price action crossing lines (or extending beyond the cloud) can indicate a change in momentum of a price trend.
There is also a median line shown which can be quite useful. If the price action stays about the median, this would suggest increasing bullish momentum. Then if the price action crosses the median - this is reasonable grounds to think about getting out of a trade as a change in momentum, on multiple timeframes has occured.
So, ... why is this wavecloud important or how is it useful.
When the wavecloud gets narrow - this generally means that all moving averages are converging. However, moving averages lag real-time price action and therefore lack a predictive speculation. With the waveclound presented in this indicator, when the wavecloud narrows this can suggest/predict a sizeable move is about to happen. In the settings, there is a narrowing % variable which can be adjusted depending on which coin or timeframe someone is working with. If there is a lot of background shading (faster timeframes)- decrease the % narrowing. Conversely, if there is insufficient background lines (with longer timeframes), increase the narrowing %.
There are a few trends which are exceptions to predicting a big move. One is that the price trend continues at a steady pace and hence the wavecloud narrows on a steadily increasing or decreasing price.
Another is that the price is choppy and just goes up and down throwing all moving averages or most indicators into a non useful state. However, adjust the narrowing % for whatever price action is in play at the time and you might find you can neatly pick out a big price change.
So, which way does a big price action move go, up or down, I'll leave this one to you. If one is trying to find the end point of a massive bull run - there might be a wavecloud narrowing at the top, just before the price suddenly drops. If its sometime after a big crash and the price action has already been through a choppy phase, its possibly time for a big rise after one last sharp drop. There are all sorts of price action wavecloud formations however, nothing very predictive in terms of suggesting when a big move might be soon to happen is otherwise available. (Although I did find my other script 'Volume Effectiveness' has some merits.)
Timeframe is an important factor with this algorithm. I think the 4hour timeframe with bitcoin is reasonable. I've not extensively tested with other coins however, faster timeframes always render unpredictable results. Also if the timeframe is too long - its difficult to suggest what is going to happen in the near future.

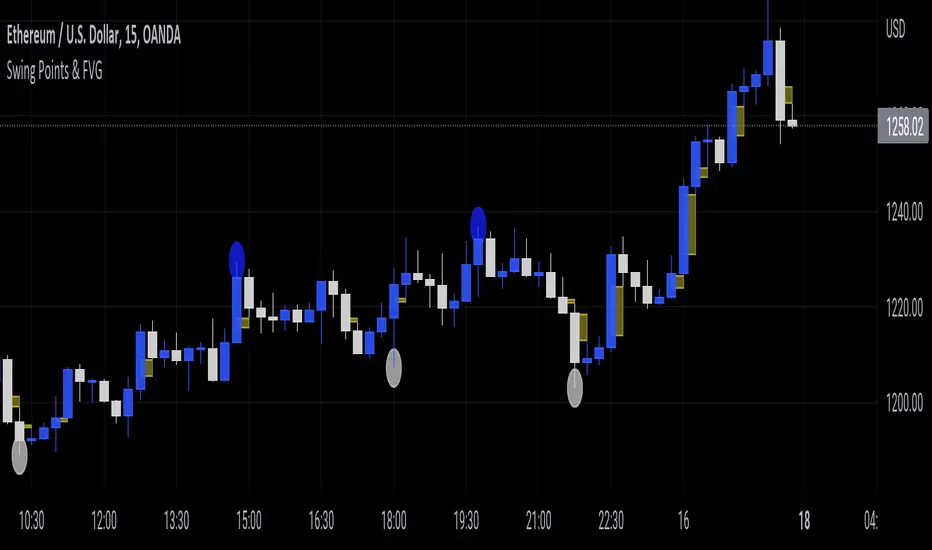
Swing Points & FVGClassic ITH/ITL
Intermediate Term High - High that has short term high on either of it's side.
Intermediate Term Low - Low that has short term low on either of it's side.
FVG
The indicator also marks Fair Value Gaps which is a very important concept in price action trading. FVGs are formed when there is ineffeciency,or imbalance, in the market.
Rebalanced ITH/ITL
Rebalanced ITH - A short term high that rebalanced the ineffeciency in price can be considered as an Intermediate Term High.
Rebalanced ITL - A short term low that rebalanced the ineffeciency in price can be considered as an Intermediate Term Low.
Use the ITH and ITL points marked by the indicator to determine the structure of the market.
Indicator repaints only when it tries to identify the latest ITH/ITL.
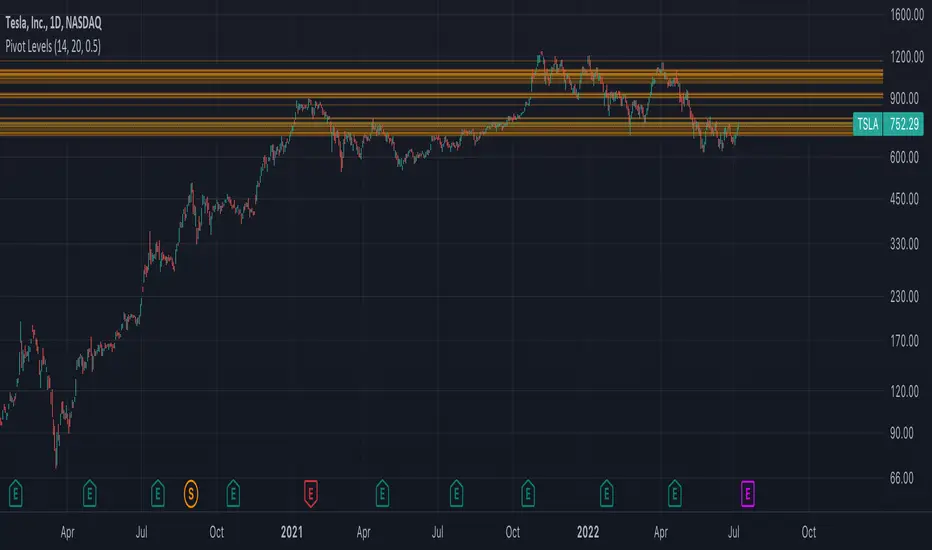
Autodrawn Pivot Levels IndicatorAn experiment with pinescript's line.new() function. The Autodrawn Pivot Levels indicator draws horizontal lines in areas where prices have been flat, which serve as pivot points. This can be useful for pivot trading as it visually shows several critical levels
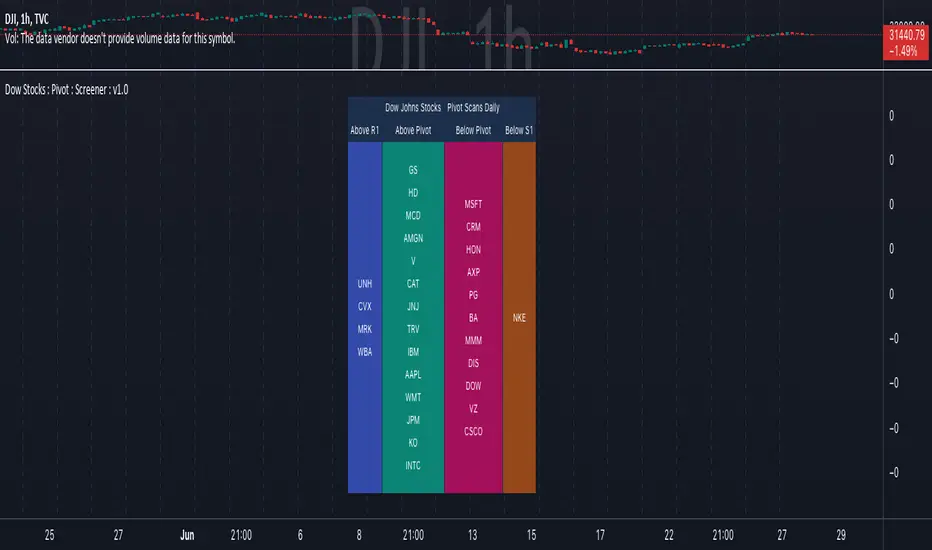
Dow Jones Stocks : Pivot : ScreenerWith the Dow Jones Stocks Pivot Screener, you can scan a list of the 30 stocks / companies included in the Dow Jones Industrial Average index in real-time.
By using the indicator, you can monitor pivot breakouts and enter trades based on them.
As soon as the DJIA Index list is updated, I will update this List
The indicator includes three types of pivots . Classic, Fibonacci, and Standard.
You have the option to select between Daily, Weekly, and Monthly time frames as well
Market Structure Patterns (Nephew_Sam_)This market structure indicator plots HH/LL labels with a little twist - it can identify upto 14 custom patterns of your choice!
Indicator settings:
Pivot strength - highest or lowest point in a number of x left+right bars
Show - show zigzag lines, HHLL labels, Pattern Matches
Patterns - upto 14 patterns (7 bear, 7 bull) with custom label text
Styles - for labels and lines
Disclaimer
- Although 90% of this indicator is custom coded, I have to give credits to LonesomeTheBlue (www.tradingview.com) for his "Double Zig Zag with HHLL" indicator where I got the logic on how to plot the labels in real time.
- This indicator repaints labels in realtime (not historical candle)

TradingCube : Crypto : Pivot ScreenerThe Crypto Pivot Screener is a real-time scanner of a list of top crypto assets.
You can use the indicator to monitor the pivots of about 40 crypto assets.
At least once a month, I will update the List of Crypto assets.
The indicator includes three types of pivots . Classic, Fibonacci, and Standard.
You have the option to select between Daily, Weekly, and Monthly time frames as well

Support and Resistance Multiperiod (Zig Zag Based)Support and Resistance Multiperiod (Zig Zag Based)
What is the indicator?
• The indicator is a multi period (up to 5 lengths) Support and Resistance indicator calculated based on Zig Zag.
Who can use?
Scalpers to Long term investors
What timeframe to use?
• Any timeframe
What are the lines?
• Green lines are Support levels.
• Orange lines are Resistance levels.
How to use?
• Buy Low and Sell High.
• Brighter zones means strong Support or Resistance.
• Weaker zones appear lighter.
• Brighter zones are formed by overlapping of lines from multiple levels of support or resistance.
Indicator Menu
• The indicator can input 5 different Lengths.
• The default settings uses 13, 21, 52, 100 & 200.
• Every option are customizable.

ATRvsDTR + ADR Zone + SSS50%This Script is to be used for intra day as far as the adr zones. The adr zones are used as support and resistance but also can be used to determine whether the stock is breaking out or not. Also being that the adr zones are calculated using a 5 or 10 day period unless you change the settings, and are set when price opens. It does really help you know whether a stock is moving more than it does on average to me it just signifies its directional. So I added the atr vs dtr so you can see what a stock moves on average versus what it has moved today.
The atr period is calculated based on the daily period unless you change the settings. I added to the original script 3 more percentages the atr vs dtr will change as it goes higher so that you can be aware when the stock is getting closer to moving 100% of its atr. Even though a stock breaks above or below the adr that doesn't mean it has moved more than it normally moves.
I also have the weekly open on the script as I trade the strat and I want to know, at what price the the week will change from bearish to bullish and vice versa. So that I can understand the trend when I am trading intraday.
The 50% lines were added for Sara strat snipers 50% rule and you can change the timeframes on them. This is used to know whether a candle will go 3. This also can help with retracements vs reversals, because in traditional technical analysis 50% is around where people start think its a reversal more so than a retracement.
I believe the script will be very help as it can show you price being directional but can also let you know when the stock is getting close to moving more than it normally has or if it has moved more than it normally has. As well as being able to see if something is a retracement vs a reversal. I trade TheStrat strategy so this can be very helpful in that regard
The 50% retracement levels are default 1h and daily. You can change them and whether or not they show
In the example chart you can see we are below weekly open which is bearish and you can also see where price reverses out of the upper adr zone. As well as how much of the atr we have moved on this day in time.

Pivot Points Standard Higher Timeframe█ OVERVIEW
This indicator was intended as educational purpose only and alternative way to write pine script in version 5 for Pivot Points Standard.
█ CREDITS
Credits to TradingView for original built-in source code.
█ FEATURES
Display price or percentage.
Change color for labels and lines.
█ USAGE EXAMPLES

Relative Strength Index - Divergences - LibertusHello all,
To ease everyone's trading experience I made this script which colors RSI overbought and oversold conditions and as a bonus displays bullish or bearish divergences in last 50 candles (by default, you can change it).
Script is open source, part of code is from Trading View examples. If you have suggestions or you already made some improvements, please report in comment.
Happy trading and good luck!

Camarilla PivotsA slimmed down/cleaner version of the "Pivot Points Standard" indicator. This is for Camarilla pivots only. The S and R pivots are renamed to L/H and the colors of pivot 1 and 2 are faded out by default since those pivots are less used in the Camarilla trading system. They can also be disabled of course.

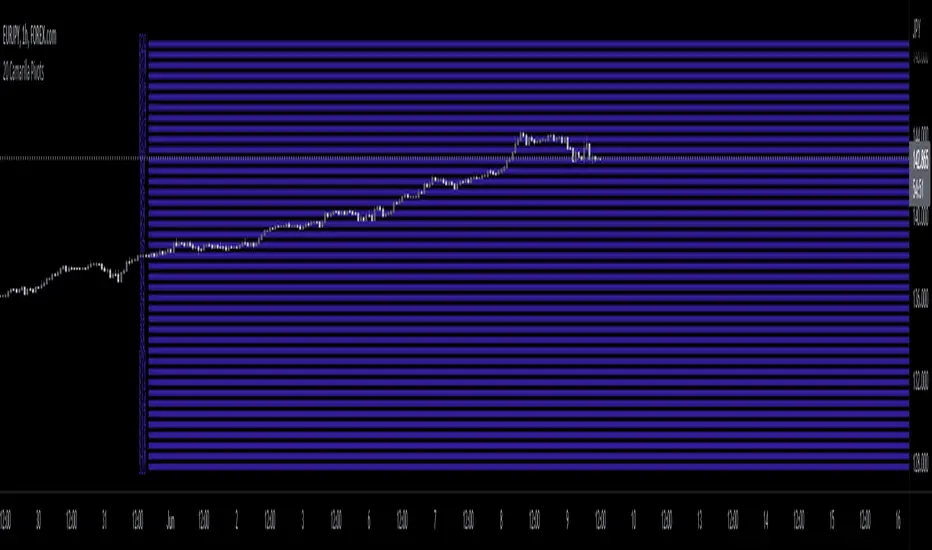
20 Camarilla Pivot PointsThis indicator plots 20 Camarilla pivot points above and below the pivot based on the selected time frame. This is useful when price goes between the standard 3 and 4 pivots and above 4. Note that the normal 4 pivot point is labeled as 6 in this indicator. You can change the color of each set of pivots so you can mark the standard Camarilla pivots if you wish. The image is using monthly Camarilla pivots on a 1 hour time frame.
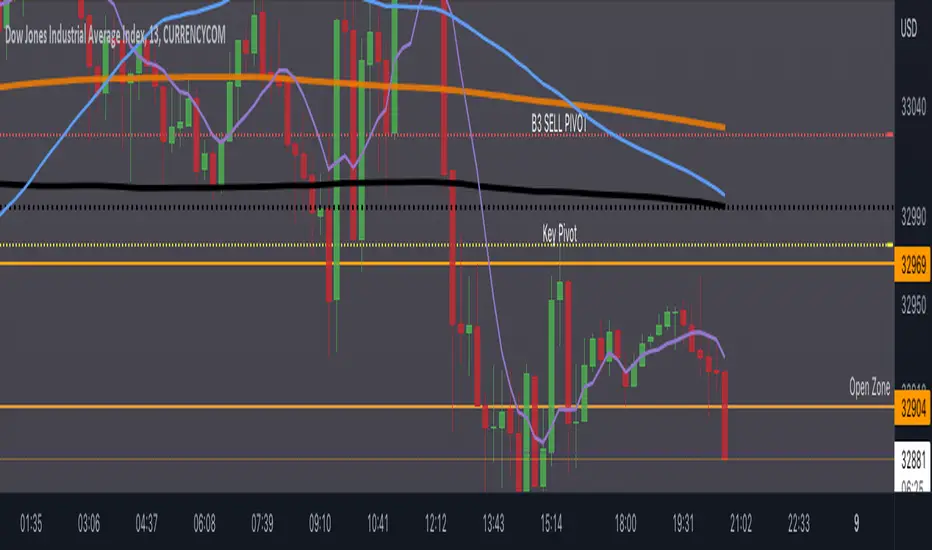
Eazi Money Pro+ Pivot [ 4Reel ]This Indicator is designed to catch the daily low / high pivot point!
If you're looking to maximize your pip count, then this is the tool you need to catch that ULTIMATE ENTRY.
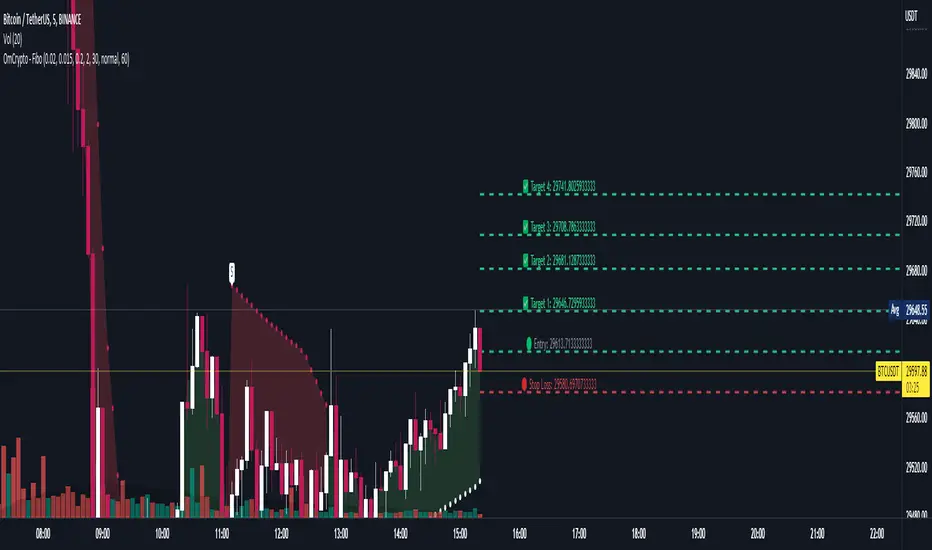
OmCrypto - PSAR with TargetOmCrypto - PSAR with Target
This script uses PSAR as it's main buy and sell signal with automatic target to take profit, entry and stop loss
It also supports alert so you can use it for bots
You can set your own period (timeframe) for the target lines in settings, default is 60 minutes (1h)