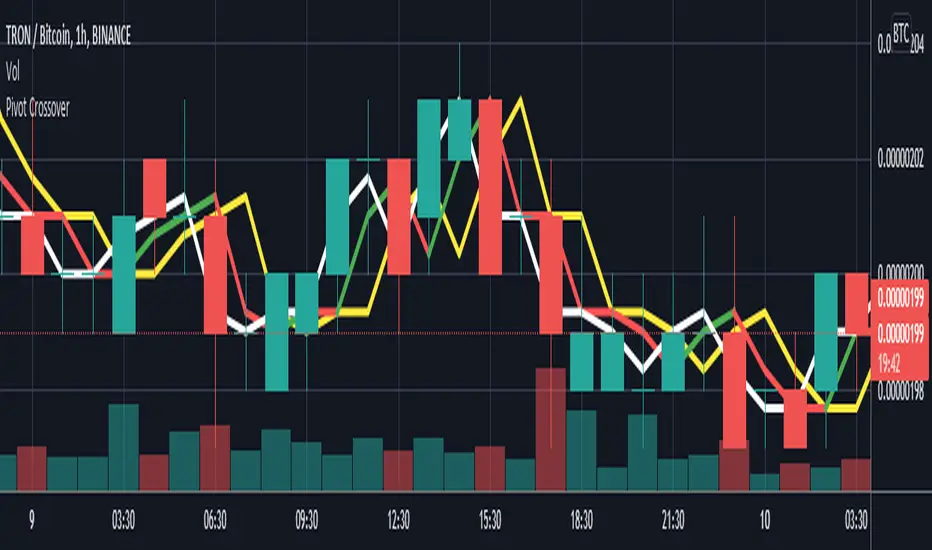
Pivot CrossoverThis indicator work on pivot point crossover. In this indicator use three pivot point
White color line is Pivot point for current bar.
Green/Red color line is Pivot point for last bar.
Yellow color line is Pivot point for 2nd last bar.
For long
if last pivot crossover above 2nd last pivot then go long
if current pivot crossover below last pivot then exit long
For short
if last pivot crossover below 2nd last pivot then go short
if last pivot crossover above last pivot then exit short
Pivotstrategy
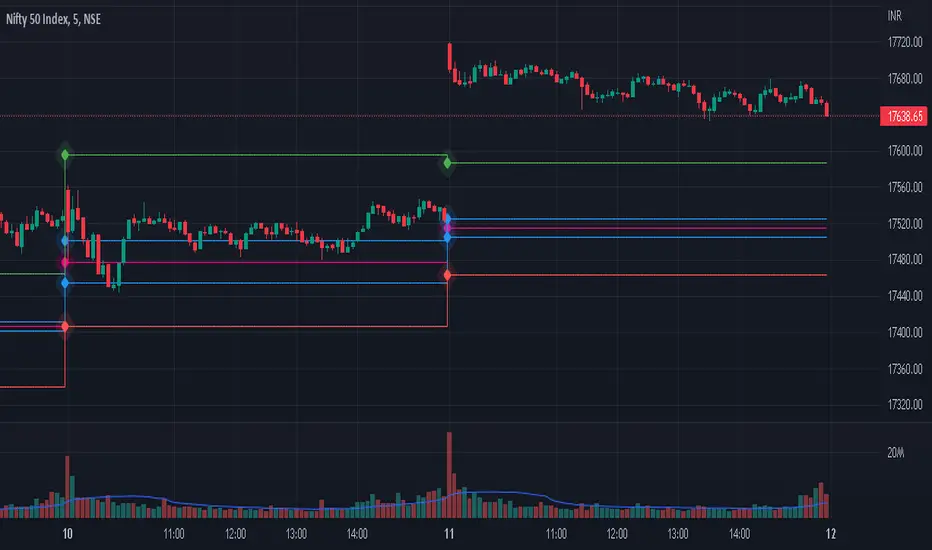
CPR by WsrWe recommend some preconditions for Intraday Trading Strategy with CPR (Central Pivot Range)
Rules For BUY Setup with CPR
1) Today's Pivot Level Should be higher than Previous Day's Pivot Level
2) The previous day's close should be near day's high.
Rules For SELL Setup with CPR
1) Today's Pivot Level Should be lower than Previous Day's Pivot Level
2) The previous day's close should be near day low.
CPR or central pivot range is the best tool available for the trader to see the price base indicator. You can use this tool i.e CPR (central pivot range) to check the price indicator in the stock market. You know the price of shares sometimes goes up or sometimes goes down in the stock market. So it will be best to stay updated and know it before the time the share market/stock market fall or rises.
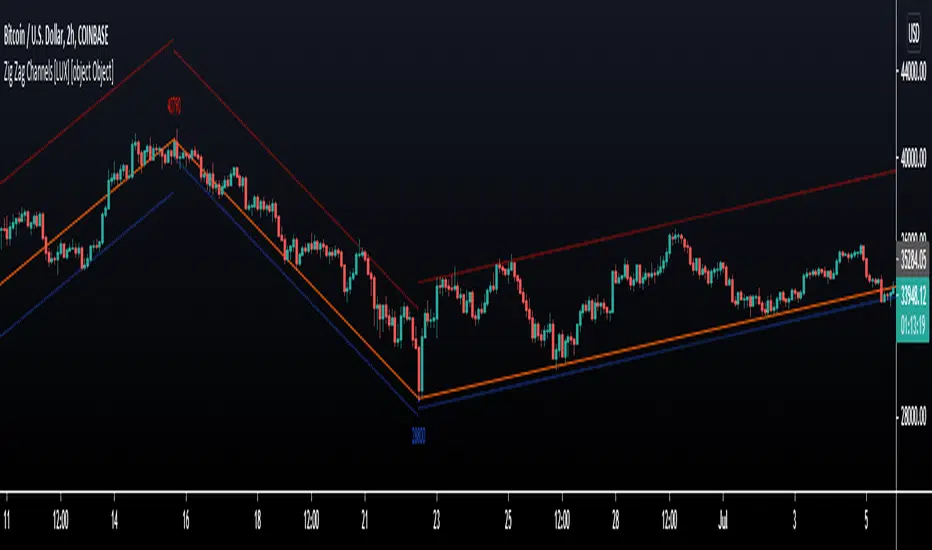
Zig Zag Channels [LuxAlgo]The Zig Zag indicator is a useful indicator when it comes to visualizing past underlying trends in the price and can make the process of using drawing tools easier. The indicator consists of a series of lines connecting points where the price deviates more than a specific percentage from a maximum/minimum point ultimately connecting local peaks and troughs.
This indicator by its very nature backpaints by default, meaning that the displayed components are offset in the past.
🔶 USAGE
The Zig Zag indicator is commonly used to returns points of references for the usage of specific drawing tools, such as Fibonacci retracements, fans, squares...etc.
The proposed indicator estimates peaks and troughs by using rolling maximums/minimums with a window size determining their significance. This window size approach allows us to have an indicator that works with a certain regularity no matter the scale of the price, something the percentage-based approach struggles with. Additionally, one upper and lower extremity are displayed, highlighting the price point that deviates the most from the Zig Zag lines.
A common usage also includes the easy determination of Elliot wave patterns in the price.
The Zig Zag indicator above highlights a downtrending motive wave.
🔹 Extremities
The novel approach taken by this Zig Zag indicator is the addition of two extremities derived from the distance between the price and the Zig Zag line, thus returning channels. It is uncommon seeing extremities in Zig Zag indicators since the line connecting peaks and troughs has rarely any other utility than seeing trend variations with more clarity and is not meant to provide an accurate estimate of underlying local trends in the price.
This channel can be useful to study the potential relationship between underlying trends and the Zig Zag line. A low width between the Zig Zag and the upper extremity indicates price variations mostly located below the Zig Zag while equal width indicates more linear trends.
When the indicator is extended to the last line, the extremities provide potential support and resistances, thus making this indicator able to forecast price variations.
🔶 SETTINGS
Length: Determines the significance of the detected peaks and troughs.
Extend To Last Bar: Extend the most recent line to the most recent closing price value.
Show Extremities: Displays the extremities.
Show Labels: Display labels highlighting the high/low prices located at peaks and troughs.
🔹 Style
Upper Extremity Color: Color of the upper extremity displayed by the indicator.
Zig Zag Color: Color of the ZigZag lines.
Lower Extremity Color: Color of the lower extremity displayed by the indicator.
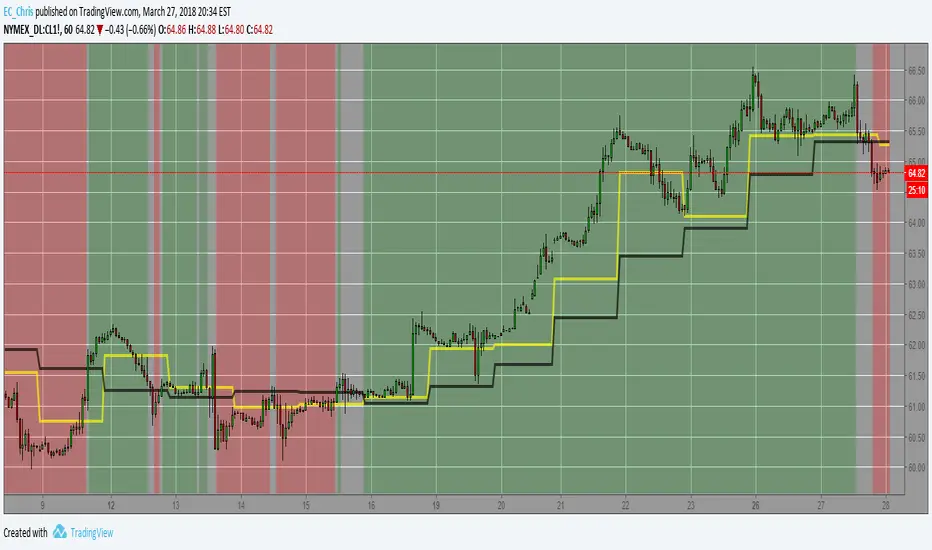
Developing Pivot Range [Swastik]This is the developing cpr indicator made by Swastik.
It shows how the cpr is developing as the day is progressing.
The colour of the range is red when tc is below bc and green when tc is above bc .
While calculating the value of cpr , the high is the high from starting of the session and low is the low from starting of the session till that specific candle.
This also shows that the trend is developing.
If the colour is red and the range starts widening, it means downtrend has started to develop and
when the colour is green and range starts widening, it means uptrend is developing.

CPR, Camarilla & Moving AverageThis script is created primarily for Intraday trading but can also be used for short and long term trading. This is a combination of Central Pivot Range (CPR), Moving Averages and Camarilla Pivot levels (with inner levels). This helps you to combine the strategies of CPR and Moving Averages to identify the best trading opportunities with greater edge. Central Pivot Range and Camarilla pivots are taken from PivotBoss by Franc Ochoa.
Key features:
# Daily CPR levels
# Weekly CPR levels
# Monthly CPR levels
# Previous Day High and Lows
# Previous Week Highs and Lows
# Previous Month Highs and Lows
# Camarilla Pivots with inner Levels
# CPR Levels for the next Day, Week and Month
# 5 Simple moving averages and 5 Exponential Moving Averages
What separates this script from other scripts with CPR and Moving averages?
# One of the few indicators (if not the only one) which combines the 2 types of Moving Averages, CPR and also Camarilla Pivots.
# CPR Levels for not just the next Day, but for next Week(Weekly CPR) and Month(Monthly CPR) also.
# Hide the previous day's levels according to your wish. This is the most unique feature of this indicator. You can set the number of Daily CPR levels you want to load in the chart. This is not just for the Daily CPR but also for the Weekly and Monthly CPR also. This makes the chart less cluttered and prevents the candles from getting buried in the indicators. Please notice how the previous day's CPR levels are hidden in the displayed demo chart on the script page. In the chart, only one trading day's data is shown(by default).
# This script is OPEN SOURCE.
Strategies :
For CPR & Camarilla Strategies for intraday trading and swing trading refer to the book 'Secrets of a Pivot Boss: Revealing Proven Methods for Profiting in the Market' by Franklin O. Ochoa.
Moving averages strategies :
Moving averages can be combined and also used individually for several strategies
* 9 EMA can be used as trailing stop loss for strong moving trends that helps you to catch big moves.
* 20sma can be used not just trailing stop loss but also for taking re-entry to the trend.
* Golden cross - The golden cross occurs when a short-term moving average crosses over a major long-term moving average to the upside. This indicates a bullish turn in the market. Eg: 50 SMA cuts 200 SMA from below.
* Death Cross - The death cross occurs when the short term moving average crosses the long-term average from above. This indicates a bearish turn in the market. Eg: 50 SMA cuts 200 SMA from above.
* When 20 SMA is above 50 SMA and 20 SMA and 50 SMA are angling up like parallel lines, then it denotes bullish strength. If this happens right after Golden Cross, big moves to the upside can be expected.
* When 20 SMA is below 50 SMA and 20 SMA and 50 SMA are angling down like parallel lines, then it denotes bearish strength. If this happens right after Death Cross, big moves to the downside can be expected.
* When 20SMA and 50 SMA are going flat and crossing each other, then it denotes sideways sentiment.
Moving average strategies are taken from the book 'How to Make Money in Intraday Trading' by Ashwani Gujral. For learning more about how to combine CPR and Moving averages in your trading please refer to this book.

Derivative Pivot HL Points Hello.
This script aims to take into account mutable variable Pivot Points' periods.
While doing this, it takes the period between 2 signals that I use in the script:
And these periods in my Pivot HL function integrated into len length (Mutable variables) :
The cornerstone of the script is these facts.
Pivot can be optimized by playing with reversal periods.
These pre-formed levels can be used as Supply and Demand levels.
Regards.

Pivot Reversal AlertsPivot Reversal Study script, for generating Alerts and visual plotting of Pivot Reversal lines on the charts. Use a Strategy script (like Figs & Dates), for backtesting different settings on various time frames and charts.

Fibonacci Pivot PointsI have included the main support and resistance pivot point levels for the Fibonacci Pivot Points. I changed the bar colors to reflect buy and sell points so if a bar is green then that means to buy it and if it is red then sell it
Let me know if you would like to see me do any other indicators!

BEST Pivots CloudHello traders,
This script is an adaption of an FXCM indicator called Pivots Cloud
Takes in input two timeframes, build the pivots based on them and fill the space between those pivots
Should be non-repainting
Best
Dave

BEST Long Term Levels Breakout ScreenerHello traders
Continuing deeper and stronger with the screeners' educational serie one more time (#daft #punk #private #joke)
We don't have to wait for TradingView to allow screener based on custom indicator - we can build our own ^^
I - Long Terms concept
I had the idea from @scarff.
I think it's genius and I use this long terms level in my trading across all assets.
The screener, in particular, analyzes whenever the price breaks out a weekly/monthly/quarterly/yearly level on candle close .
Triggering events on candle close = we get rid of the REPAINTING = we remove the fake signals (in that case the fake breakouts).
The candle close is based on the close of the current chart => if the chart displays candlesticks on the weekly timeframe, then the considered close will be the weekly close.
If in daily timeframe, the close will be .............................. 4h (#wrong)..... kidding :) .............. DAILY obviously
II - How did I set the screener
The visual signals are as follow:
- square: breakout of a high/low weekly level
- circle: breakout of a high/low monthly level
- diamond: breakout of a high/low quarterly level
- flag: breakout of a high/low yearly level
- dash: none of the above
Then the colors are:
- green when bullish
- red when bearish
- orange/dash when none of the above
Cool Hacks
"But sir... what can we do with only 3 instruments for a screener?" I agree not much but...
As said previously... you can add multiple times the same indicator on a chart :)
Wishing you all the BEST trading and.... wait for it... BEST weekend
Dave

QuantNomad - Significant Pivot Reversal Strategy AlertsAlerts for "Significant Pivot Reversal Strategy":
As one of the ways to filter out insignificant levels I decided to check that pivot point is not above/below neighbors, but check that it's above/below at least by a certain amount.
I use ATR, so in params, you can set length of ATR and also ATR multiplier. The new level will be calculated only if PP will be above/below neighbors by atr * atr_mult.
It seems this approach might help in some cases.

QuantNomad - Pivot Points AlertsVery simple scripts that will allow you to receive alerts for new Pivot Lows/Highs Points.
A solid arrow points to actual point low/high point, transparent - to the bar, you'll receive alerts for (Shifter by rightBars).
And remember:
Past performance does not guarantee future results.

Pivot Points, by @juanmirocks# Advantages over TV's indicator "Pivot Points Standard"
1. Show pivot lines for all history, which lets you gauge trading strategies throughout time
2. More sensible Default/Auto time frame; e.g. on intradays only and always the market values of yesterday's Day are used
3. The halves between the key levels are also shown, which it's useful for some trading strategies
4. Arguably out-of-the-box nicer interface
Pivot Points as an indicator is a traditional strategy to draw resistance and support levels. It's best suited for intraday trading: the pivot points and resulting key levels are calculated from yesterday's market values (H, L, C). More details in the script's source.
Pivot Points trading is suitable for any market, and best for intraday (e.g. 3 min).

True Rolling Pivot Range IndicatorHere is the actual 3 day rolling pivot range indicator as detailed in Mark Fisher's book The Logical Trader.