Pivot Support & ResistanceHere signals are based on the pivot high and pivot lows. Factors taken into account in understanding the breakout or breakdown are:
volume
candle bar is not opening candle
must be near pivot high or low
Recommendation:
Use once candle closes else you might get trapped in certain cases so be careful
Pivotstrategy

RSI Centered PivotsJust a simple RSI central pivot strategy I made for a friend.
Backtested on BYBIT:BTCUSD, 155m.
DISCLAIMER : Please do your own research into anything you use before using it to trade.

Pivot Reversal Strategy + alerts via TradingConnector to indicesSoftware part of algotrading is simpler than you think. TradingView is a great place to do this actually. To present it, I'm publishing each of the default strategies you can find in Pinescript editor's "built-in" list with slight modification - I'm only adding 2 lines of code, which will trigger alerts, ready to be forwarded to your broker via TradingConnector and instantly executed there. Alerts added in this script: 14 and 22.
How it works:
1. TradingView alert fires.
2. TradingConnector catches it and forwards to MetaTrader4/5 you got from your broker.
3. Trade gets executed inside MetaTrader within 1 second of fired alert.
When configuring alert, make sure to select "alert() function calls only" in CreateAlert popup. One alert per ticker is required.
Adding stop-loss, take-profit, trailing-stop, break-even or executing pending orders is also possible. These topics have been covered in other example posts.
This routing works for Forex, indices, stocks, crypto - anything your broker offers via their MetaTrader4 or 5.
Disclaimer: This concept is presented for educational purposes only. Profitable results of trading this strategy are not guaranteed even if the backtest suggests so. By no means this post can be considered a trading advice. You trade at your own risk.
If you are thinking to execute this particular strategy, make sure to find the instrument, settings and timeframe which you like most. You can do this by your own research only.

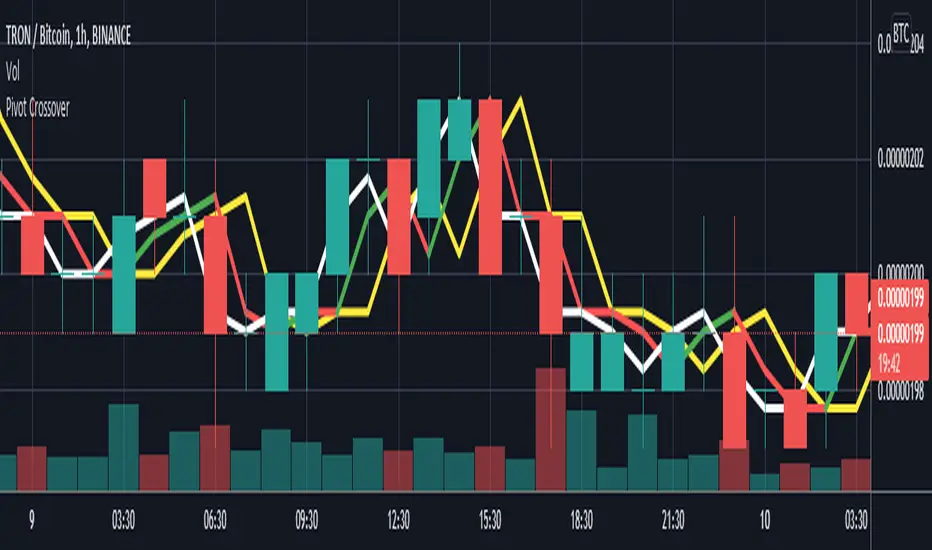
Pivot CrossoverThis indicator work on pivot point crossover. In this indicator use three pivot point
White color line is Pivot point for current bar.
Green/Red color line is Pivot point for last bar.
Yellow color line is Pivot point for 2nd last bar.
For long
if last pivot crossover above 2nd last pivot then go long
if current pivot crossover below last pivot then exit long
For short
if last pivot crossover below 2nd last pivot then go short
if last pivot crossover above last pivot then exit short
CPR by WsrWe recommend some preconditions for Intraday Trading Strategy with CPR (Central Pivot Range)
Rules For BUY Setup with CPR
1) Today's Pivot Level Should be higher than Previous Day's Pivot Level
2) The previous day's close should be near day's high.
Rules For SELL Setup with CPR
1) Today's Pivot Level Should be lower than Previous Day's Pivot Level
2) The previous day's close should be near day low.
CPR or central pivot range is the best tool available for the trader to see the price base indicator. You can use this tool i.e CPR (central pivot range) to check the price indicator in the stock market. You know the price of shares sometimes goes up or sometimes goes down in the stock market. So it will be best to stay updated and know it before the time the share market/stock market fall or rises.
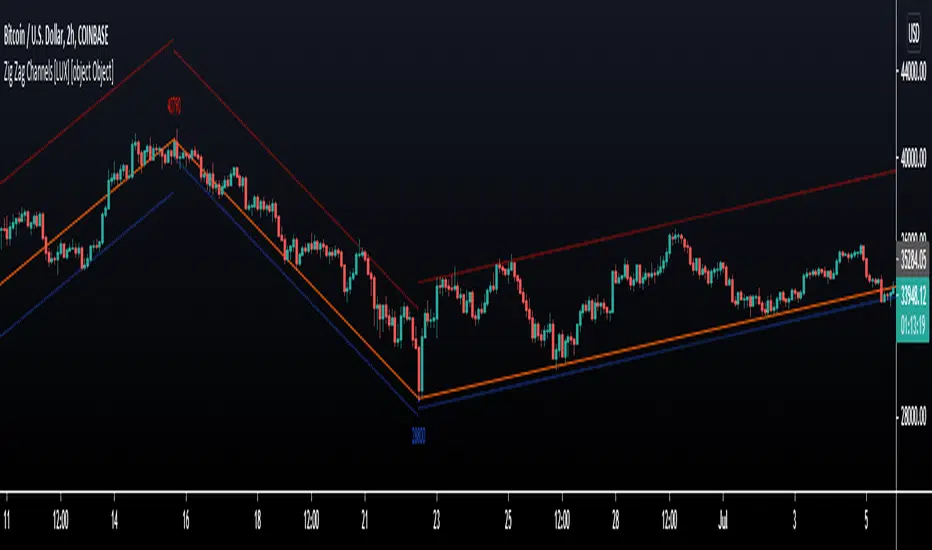
Zig Zag Channels [LuxAlgo]The Zig Zag indicator is a useful indicator when it comes to visualizing past underlying trends in the price and can make the process of using drawing tools easier. The indicator consists of a series of lines connecting points where the price deviates more than a specific percentage from a maximum/minimum point ultimately connecting local peaks and troughs.
This indicator by its very nature backpaints by default, meaning that the displayed components are offset in the past.
🔶 USAGE
The Zig Zag indicator is commonly used to returns points of references for the usage of specific drawing tools, such as Fibonacci retracements, fans, squares...etc.
The proposed indicator estimates peaks and troughs by using rolling maximums/minimums with a window size determining their significance. This window size approach allows us to have an indicator that works with a certain regularity no matter the scale of the price, something the percentage-based approach struggles with. Additionally, one upper and lower extremity are displayed, highlighting the price point that deviates the most from the Zig Zag lines.
A common usage also includes the easy determination of Elliot wave patterns in the price.
The Zig Zag indicator above highlights a downtrending motive wave.
🔹 Extremities
The novel approach taken by this Zig Zag indicator is the addition of two extremities derived from the distance between the price and the Zig Zag line, thus returning channels. It is uncommon seeing extremities in Zig Zag indicators since the line connecting peaks and troughs has rarely any other utility than seeing trend variations with more clarity and is not meant to provide an accurate estimate of underlying local trends in the price.
This channel can be useful to study the potential relationship between underlying trends and the Zig Zag line. A low width between the Zig Zag and the upper extremity indicates price variations mostly located below the Zig Zag while equal width indicates more linear trends.
When the indicator is extended to the last line, the extremities provide potential support and resistances, thus making this indicator able to forecast price variations.
🔶 SETTINGS
Length: Determines the significance of the detected peaks and troughs.
Extend To Last Bar: Extend the most recent line to the most recent closing price value.
Show Extremities: Displays the extremities.
Show Labels: Display labels highlighting the high/low prices located at peaks and troughs.
🔹 Style
Upper Extremity Color: Color of the upper extremity displayed by the indicator.
Zig Zag Color: Color of the ZigZag lines.
Lower Extremity Color: Color of the lower extremity displayed by the indicator.
Fractal Fire Zones/Wave RiderMulti timeframe confluence reader: This indicator plots fractals on any specific timeframe selected, multi time frame ema cross that changes color with the trend, multi timeframe 200ema and a calculation that shows potential turning points with a multi timeframe stochastic oscillator confluence. The fire zones are preferred in a ranging market or for potential scalps while the ema trend is designed to keep you with the main trend in any given session. The accumulation/distribution candles can be used to gauge pull backs for re entry or exits based on time or multiple confirmations.

Developing Pivot Range [Swastik]This is the developing cpr indicator made by Swastik.
It shows how the cpr is developing as the day is progressing.
The colour of the range is red when tc is below bc and green when tc is above bc .
While calculating the value of cpr , the high is the high from starting of the session and low is the low from starting of the session till that specific candle.
This also shows that the trend is developing.
If the colour is red and the range starts widening, it means downtrend has started to develop and
when the colour is green and range starts widening, it means uptrend is developing.

CPR, Camarilla & Moving AverageThis script is created primarily for Intraday trading but can also be used for short and long term trading. This is a combination of Central Pivot Range (CPR), Moving Averages and Camarilla Pivot levels (with inner levels). This helps you to combine the strategies of CPR and Moving Averages to identify the best trading opportunities with greater edge. Central Pivot Range and Camarilla pivots are taken from PivotBoss by Franc Ochoa.
Key features:
# Daily CPR levels
# Weekly CPR levels
# Monthly CPR levels
# Previous Day High and Lows
# Previous Week Highs and Lows
# Previous Month Highs and Lows
# Camarilla Pivots with inner Levels
# CPR Levels for the next Day, Week and Month
# 5 Simple moving averages and 5 Exponential Moving Averages
What separates this script from other scripts with CPR and Moving averages?
# One of the few indicators (if not the only one) which combines the 2 types of Moving Averages, CPR and also Camarilla Pivots.
# CPR Levels for not just the next Day, but for next Week(Weekly CPR) and Month(Monthly CPR) also.
# Hide the previous day's levels according to your wish. This is the most unique feature of this indicator. You can set the number of Daily CPR levels you want to load in the chart. This is not just for the Daily CPR but also for the Weekly and Monthly CPR also. This makes the chart less cluttered and prevents the candles from getting buried in the indicators. Please notice how the previous day's CPR levels are hidden in the displayed demo chart on the script page. In the chart, only one trading day's data is shown(by default).
# This script is OPEN SOURCE.
Strategies :
For CPR & Camarilla Strategies for intraday trading and swing trading refer to the book 'Secrets of a Pivot Boss: Revealing Proven Methods for Profiting in the Market' by Franklin O. Ochoa.
Moving averages strategies :
Moving averages can be combined and also used individually for several strategies
* 9 EMA can be used as trailing stop loss for strong moving trends that helps you to catch big moves.
* 20sma can be used not just trailing stop loss but also for taking re-entry to the trend.
* Golden cross - The golden cross occurs when a short-term moving average crosses over a major long-term moving average to the upside. This indicates a bullish turn in the market. Eg: 50 SMA cuts 200 SMA from below.
* Death Cross - The death cross occurs when the short term moving average crosses the long-term average from above. This indicates a bearish turn in the market. Eg: 50 SMA cuts 200 SMA from above.
* When 20 SMA is above 50 SMA and 20 SMA and 50 SMA are angling up like parallel lines, then it denotes bullish strength. If this happens right after Golden Cross, big moves to the upside can be expected.
* When 20 SMA is below 50 SMA and 20 SMA and 50 SMA are angling down like parallel lines, then it denotes bearish strength. If this happens right after Death Cross, big moves to the downside can be expected.
* When 20SMA and 50 SMA are going flat and crossing each other, then it denotes sideways sentiment.
Moving average strategies are taken from the book 'How to Make Money in Intraday Trading' by Ashwani Gujral. For learning more about how to combine CPR and Moving averages in your trading please refer to this book.

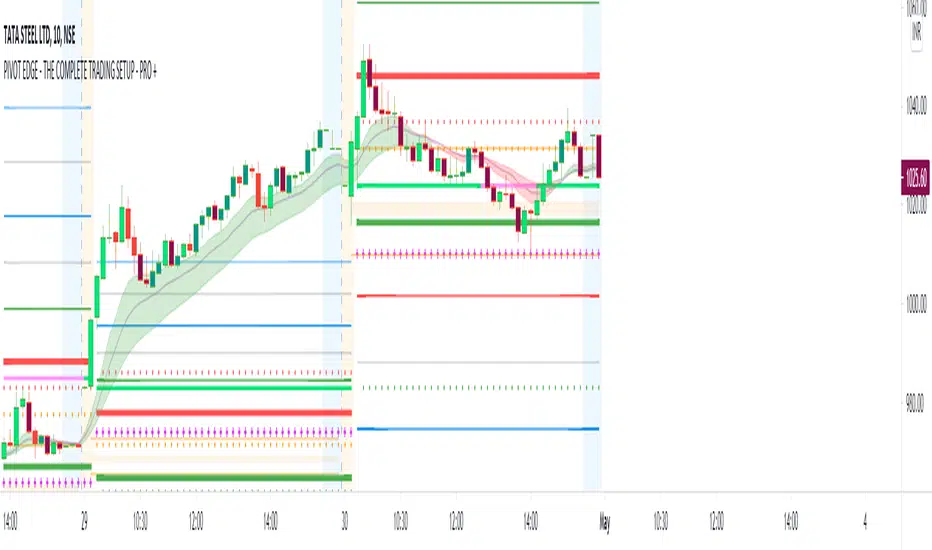
PIVOT EDGE - THE COMPLETE TRADING SETUP - PRO +Introduction to the Indicator " PIVOT EDGE - The complete trading setup - PRO+ "
The Foundation layout for this indicator is based on PIVOT's which are nothing but the most important levels that the price has respected in the past.The values for the pivots are derived from the key attributes of the price in any timeframe such as the OPEN, HIGH, LOW and CLOSE. These define the mood of the price and where it intends to move in relation to the previous range formed.Earlier HIGH - LOW i.e the RANGE indicates the possible movement that a stock can make in the current session and as per the calculated pivots we can possible find out the tentative supports and resistances. In addition to this indicator, It is advisable to use the price action theory which helps in taking a right decision for entries.
This indicator by itself is complete in nature, i.e it guides the user for possible entry levels and the projected targets that we can achieve and also the likely stop loss limit in case the price reverses. So beforehand even before entering into a trade position, the user can ascertain what can be his loss or max profit and then he can chose an optimum position size for favorable results.
The beauty of this Indicator lies in the fact that it can be used for all types of trading like Scalping, Intra day, Swing or Positional and Investments also. It works on all timeframes and across all market segments like EQUITY, COMMODITIES , FUTURES , OPTIONS , FOREX etc.
This indicator can be used for any exchange and any time zone also without any changes or adjustments needed.
Now let us understand the features of this Indicator in detail.
TIMEFRAME - It has options to choose between Day, week and month as timeframe. By default it is set to Day timeframe
DISPLAY MAJOR LEVELS - These are the important support and resistance levels calculated based on the past price data. Most important ones are marked in BOLD RED and BOLD GREEN between which the price tends to move generally.
Apart from these, We have breakout level marked in light green and if price breaks this level we can expect targets upto extended levels and beyond marked in blue.
we also have breakdown level marked in light red and if price breaks this level we can expect targets down up to extended levels and below it marked in blue.
In addition I have coded intermediate target levels that appear in light gray between the extended levels or blue lines. Sometimes when the gap between these targets are huge, price cannot reach the targets and reverses at these intermediate targets. You can use them as targets or trailing stop loss based on your plan
DISPLAY HIDDEN LEVELS - These levels are intermediate supports and resistances that can be used whenever the present day indicated range is very wide. Whenever we have an explosive moments in market the range of that day is very huge and so he next day support and resistance band becomes very wide indicating the sideways movement day within that range. And on those days we can switch on the hidden levels and the price respects these levels and most of the days it is inside this range only.
DISPLAY PREVIOUS HIGH / LOW / CLOSE - I have included Daily / Weekly and monthly levels. It is important to know the earlier highs / lows and close since price respects it very must just like support and resistance .
PEMA - This is an important EMA based indicator which potentially indicates curves of support and resistance during retracements or pullbacks. If the curves are breached then the trend is reversed and the price will tend to move to the next pivots .
VALUE AREA - One of the most important feature of this Indicator is this which is derived from the Volume profile concepts. It indicates the fair value area Indicated by orange band and the upper and lower limits indicated by orange lines. Whenever the price is overvalued or undervalued, it is pushed back to its fair value and we can judge the present price position in relation to the value area and then take position in anticipation of the price reaching its fair value area. This must be coupled with price action for favorable results.
IMPORTANT NOTE : This indicator does not guarantee any favorable results nor protect your from any loss. You own the complete risk of your trades. It is suggested that you use this indicator and do back testing for considerable period to understand how it works the the potential win rate it can give.
If you have any doubts or need any clarifications of assistance in understanding, you can message me and I will try to help.
Happy and Safe trading - Mohan from PIVOT EDGE
Pivot Points AlgoThis is a Pivot Points Algo (PPA).
PPA uses an adaptive pivot algorithm that adapts to different market situations based on various factors.
PPA also includes depth filtering to make it more precise at its signal decision.
======= Signal Types ======
Main Signal of BUY and SELL shown by buy/sell labels.
Mini Signals of BUY and SELL shown by buy/sell arrows and shows additional breakouts after the Main Signal occurred.
Optional reversal signals show a possible reversal in trend (small triangle).
======= Alerts =======
Main Signals alerts - Alerts when a main Buy or Sell is triggered (Shown as Labels).
Combo Alerts - Alerts when main or mini signals of Buy and Sell are triggered (Shown as Arrows).
======= Assets and Time frames =======
Can be used on various assets, stocks, forex, crypto and works great for day trading as well as swing trading and long term investing.
PPA is designed to adjust to any time frame!
======= General info =======
The purpose of this indicator is to signal possible breakouts with a high rate of success.
PPA has been extensively tested and fine tuned to provide traders and investors with a valuable tool for timing long and short entries. However, no system is 100% perfect, and it is good practice to have a plan in place and use stop losses or other tools to mitigate unforeseen risk.
Also, note, I don't hide what PPA is doing as opposed to some other commercial indicators on the market. You can view pivot lines and pivot bands and so on.
The magic is the inner system itself which works for you to pinpoint the best entrance possible, I recommend confirming your own methods to make sure you want to take the trade.
To subscribe to Pivot Points Algo service see “Author's instructions” below.
For any question you can PM me.
Happy and profitable trading!

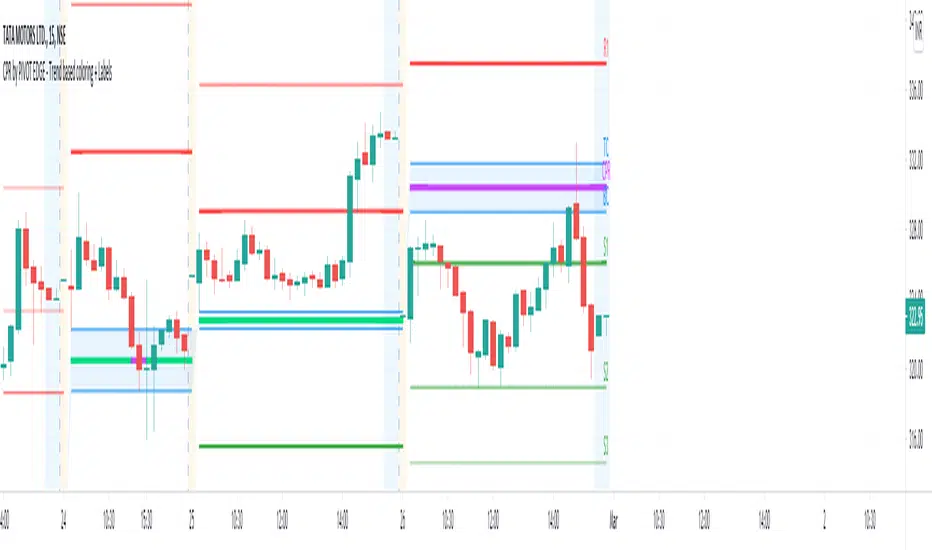
CPR by PIVOT EDGE - Trend based coloring + LabelsIntroduction to the Indicator " CPR by PIVOT EDGE - Trend based coloring + Labels "
The Foundation layout for this indicator is based on PIVOT's which are nothing but the most important levels that the price has respected in the past.The values for the pivots are derived from the key attributes of the price in any timeframe such as the OPEN, HIGH, LOW and CLOSE. These define the mood of the price and where it intends to move in relation to the previous range formed.Earlier HIGH - LOW i.e the RANGE indicates the possible movement that a stock can make in the current session and as per the calculated pivots we can possible find out the tentative supports and resistances. In addition to this indicator, It is advisable to use the price action theory which helps in taking a right decision for entries.
This indicator by itself is complete in nature, i.e it guides the user for possible entry levels and the projected targets that we can achieve and also the likely stop loss limit in case the price reverses. So beforehand even before entering into a trade position, the user can ascertain what can be his loss or max profit and then he can chose an optimum position size for favorable results.
The beauty of this Indicator lies in the fact that it can be used for all types of trading like Scalping, Intra day, Swing or Positional and Investments also. It works on all timeframes and across all market segments like EQUITY, COMMODITIES , FUTURES , OPTIONS , FOREX etc.
This indicator can be used for any exchange and any timezone also without any changes or adjustments needed.
Now let us understand the features of this Indicator in detail.
TIMEFRAME - It has options to choose between Day,week and month as timeframe. By default it is set to Day timeframe
DISPLAY CPR BAND - This displays the CPR range that consists of Pivot, TC and BC. This Band or Range is the core of this indicator and this givesa detailed information about the tentative range and momentum of the market for the present period
as well a prediction for next session and also can tell you the history of its pior period. This level acts as both support and resistance based on the direction of the trend. The unique feature built in this indicator is that
the Pivot changes its color based on the trend in the market and by looking at the color of the pivot itself you can make out what the current trend in the market is.
DISPLAY SUPPORT RESISTANCE - This indicates the important support and resitance levels for the day which is derived from the price details of prior period that is based on HIGH / LOW / CLOSE of prior period.
DISPLAY PREVIOUS HIGH / LOW / CLOSE - I have included Daily / Weekly and monthly levels. It is important to know the earlier highs / lows and close since price respects it very must just like support and resistance.
DISPLAY TOMORROW CPR - This displays the CPR band and support / resistance for tomorrow.It give an advance information of tomorrows trend and momentum today itself if you study the CPR concepts you can be prepared for tomomorrows market and can very well know in advance if it will be a sideways market or a trending day.
MINOR TREND - This displays a combination of 2 moving averages. By default I have coded for 20 and 50 period which can be modified as per your needs. These 2 moving averages depicts the prevailing minor trend in the market and you can take decision to enter trade based on this trend projection.
For users ease, I have conditionally coded the moving average curves and also the background color to depict the present trend i.e red denoted bearish trend and green denoting bullish trend. The colors change automatically based on the change in price behaviour.
MAJOR TREND - This displays the prevailing major trend in the market and I have used as 200 period moving average by default which you can change to suit your needs. You can check the major trend of the market by using higher timeframes above 1Hr.
IMPORTANT NOTE : This indicator does not guarantee any favorable results nor protect your from any loss. You own the complete risk of your trades. It is suggested that you use this indicator and do back testing for considerable period to understand how it works the the potential win rate it can give.
If you have any doubts or need any clarifications of assistance in understanding, you can message me and i will try to help.
I will soon try to make a Video and explain the use of this indicator for better clarity and understanding.
Happy and Safe trading - Mohan from PIVOT EDGE
Derivative Pivot HL Points Hello.
This script aims to take into account mutable variable Pivot Points' periods.
While doing this, it takes the period between 2 signals that I use in the script:
And these periods in my Pivot HL function integrated into len length (Mutable variables) :
The cornerstone of the script is these facts.
Pivot can be optimized by playing with reversal periods.
These pre-formed levels can be used as Supply and Demand levels.
Regards.

Stock Breakout Algo by Technicaltrader615This is a Breakout Algo Suited for trading Stocks in NSE ( India) . The code looks for breakout above yesterday high and low with respect to the pivot R1 and S1. The order pings as Bracket order with 2R as target and 1R as risk. Time frame to be used is 5 mins.
We need to feed stocks with narrow range prior day for better performance.
You need to define risk in the Bridge for Each of the Stock. Lets say the stop loss is 10 points and Risk is 1000. The bridge will ping 1000/10 = 100 Shares to buy/ sell with 2R as target. the Target can be set to 3R also . This some times get rejected as Indian Stock exchange has upper circuit limit set. So we can go for 2R for ill-liquid stoks and 3R for liquid Stocks.
Similarly if 1000 Rs risk and 50 points sl , the bridge will place 1000/50 = 20 Share qty.
Breakout / Breakdown candles are Denoted by Colour change in the chart for visual purpose.
For more Details you can contact thru trading view chat window. You can also scroll down for my signature. This is only for the Students of Mine.

Pivot Reversal AlertsPivot Reversal Study script, for generating Alerts and visual plotting of Pivot Reversal lines on the charts. Use a Strategy script (like Figs & Dates), for backtesting different settings on various time frames and charts.

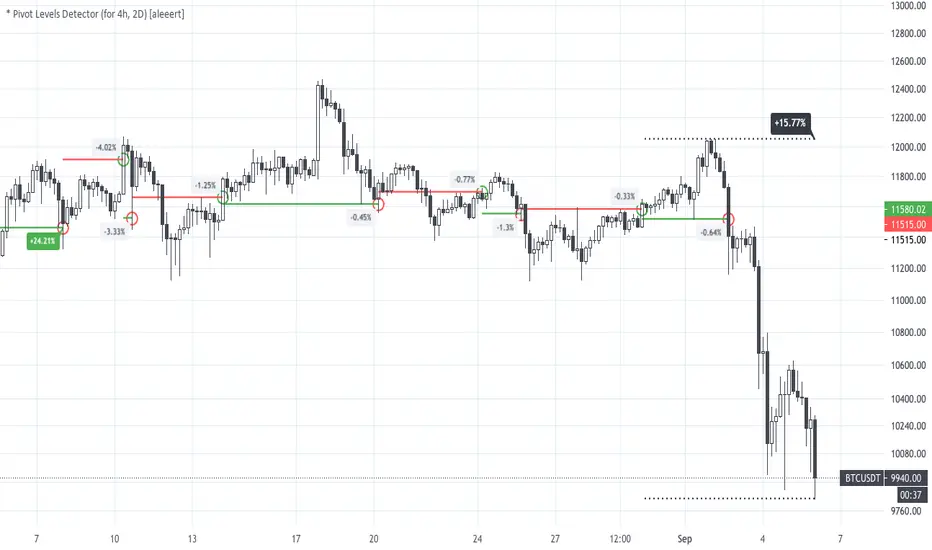
* Pivot Levels Detector (for H4, D2) [aleeert]Pivot Levels Detector is the script based on idea about breakouts of pivot levels which based on certain numbers of bars used for reaching the target and breakout the level. Working timeframes are H4 and 2D . The script works better with BTCUSD, ETHUSD, EOSBTC, AAPL, TSLA.
No repainting!
The script doesn't use any moving averages or other relative methods which cancel or change data on previous bars. Once the signal is showed it will stay forever.
NOTE: The results from Strategy Tester could slight vary from results you see on the chart. It's because of calculation method used on Strategy Tester, which uses a data from closed bars only, not by target reaching. So the results you see on the chart are more correct.
Follow me for receiving more scripts and indicators.
Regards,
aleeert
Smoothed Pivot Reversal Alerts [QuantNomad]This is study with alerts for my "Smoothed Pivot Reversal Strategy". Strategy script is open to the public so you can use it freely.
When creating alerts - choose "Once Per Bar Close"
It's a pro indicator, you can have access to it for a small fee. Link to my PRO indicators you can find in my signature.

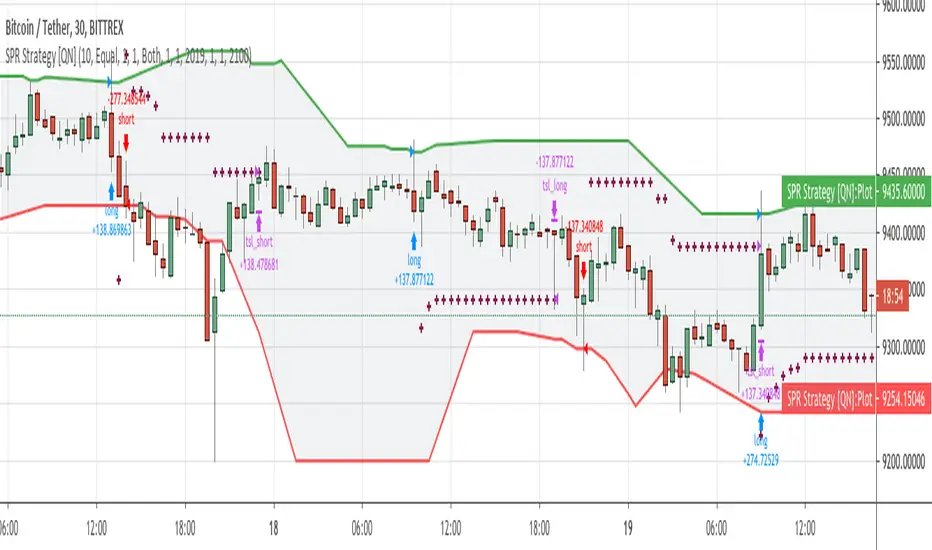
Smoothed Pivot Reversal Strategy [QuantNomad]With this strategy trying to rethink the standard pivot reversal strategy.
Don't like the idea that for 10/10 pivot you have to wait for 10points to confirm it. So I used multiple pivot levels and calculated the average line. This way when we have a new high level approaching it smoothly.
This way you can have a bit better price for entries but the risk of fake entries bit bigger as well.
I'm using the usual trailing stop loss as an exit for this strategy.
Parameters for this strategy is pretty simple:
Left/Right bars for pivot points.
Additional smoothing - you can additionally smooth pivot lines with EMA
% for Traling SL
PRP - Pivot Reversal + PSAR Alerts [QuantNomad]This is study with alerts for my "PRP - Pivot Reversal + PSAR Strategy".
When creating alerts - choose "Once Per Bar Close"
It's a pro indicator, you can have access to it for a small fee. Link to my PRO indicators you can find in my signature.

Fibonacci Pivot PointsI have included the main support and resistance pivot point levels for the Fibonacci Pivot Points. I changed the bar colors to reflect buy and sell points so if a bar is green then that means to buy it and if it is red then sell it
Let me know if you would like to see me do any other indicators!

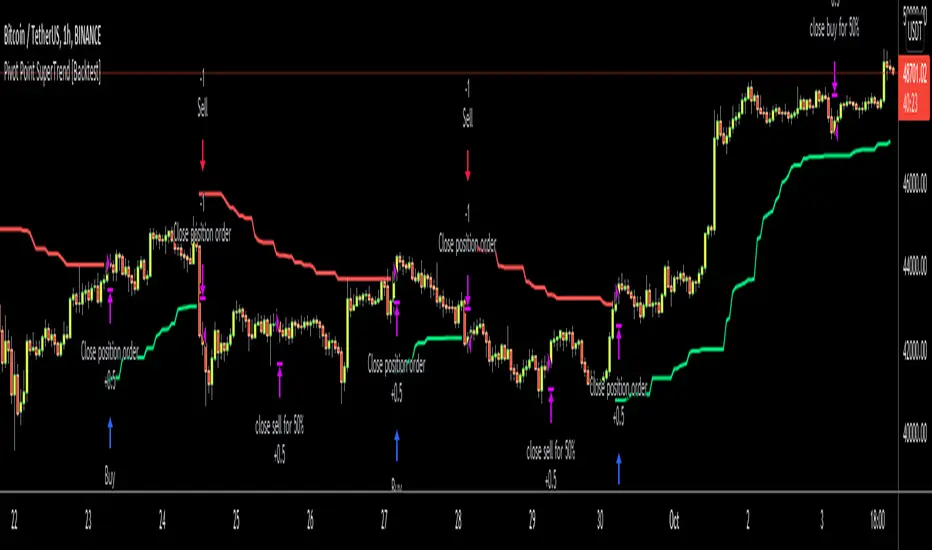
Pivot Point SuperTrend [Backtest]Hello All,
This is backtesting result of following indicator/strategy. I didn't work on adding other indicators. maybe in the future I can try to combine this with other indicators.
You can visit following link to see "Pivot Point SuperTrend" . by using this backtesting tool, you can test&find better options
There is option "Use Center Line to Close Entry for 50%" . by default it's not enabled. if you enable this option, pivot point center line may push you to close your entry for 50% (can be used as early stoploss/take profit line if you think it's risky)
Enjoy!
CPRFibonacciPivots By EquityDuraiThe Central Pivot Range (CPR) is one of the most versatile price-based indicators available to traders. ... At any given time, the range can be support or resistance, it can forecast trending or sideways price behavior, dictate the day's direction, or serve as an integral part of a trend.
Keep in mind that depending on the market’s behavior, the formula for TC may in fact create the level for BC, and vice versa. I always refer to the highest level as TC, and the lowest level as BC, regardless of which formula led to the level’s creation.

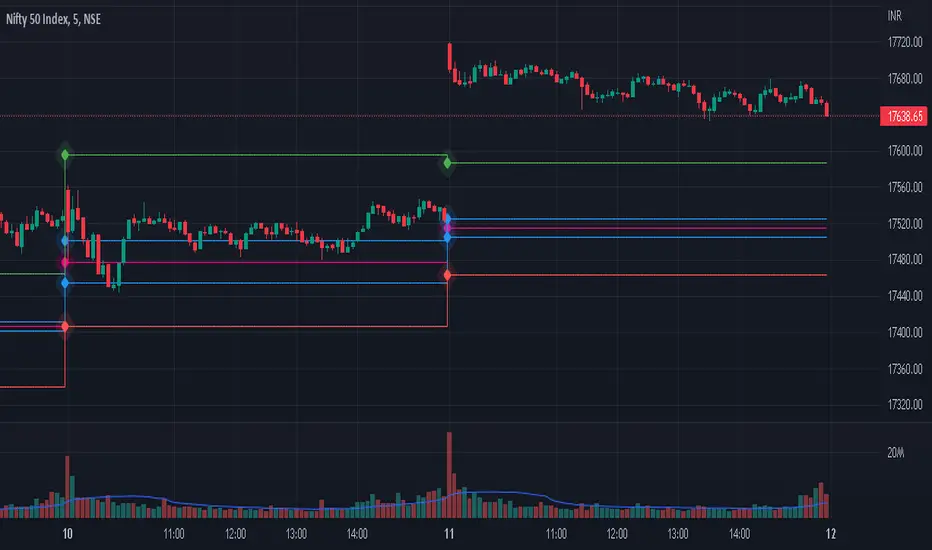
TFi Pivot Reversal StudyThe Pivot Reversal Study script uses pivot points to create a support and resistance level; based on this levels the script creates virtual stop-market orders to catch the trend if the price is crossing the pivot lines.
A configurable trailing-stop and stop-loss is being used to exit an open position.
The entry and exit points are visualized in the chart via green arrows and crosses; the position follows the exact behavior of the strategy script.
The study also creates alerts, which follow the exact position of the entry/exit markers. Via the input parameter "Alert Message Type" it is possible to select a predefined alertcondition message; right now the script supports a generic default message and a trading setup for Alertatron.
How to use
The study works with all timeframes; the current chart setting is using a 15min timeframe. The strategy enters about 10 trades per day, depending on the used settings.
I'm also providing a "strategy" version of this study, which can be used to backtest the strategy.
How to access
This strategy is a "Invite Only" script. You can can subscribe or purchase the strategy ; please use the link below or send me a message via Tradingview to obtain access to the strategy and study script.
For enabling the script in your Tradingview chart window, click on "Indicators" and select "Invite-Only Scripts".
Full list of alerts:
'Enter Long' ... Enter long position
'Enter Short' ... Enter short position
'Exit Long PT' ... Exit long position - profit-target reached
'Exit Short PT' ... Exit short position - profit-target reached
'Exit Long SL' ... Exit long position - stop-loss
'Exit Short SL' ... Exit short position - stop-loss
Full list of parameters:
"Pivot Left Bars" ... Number of bars on the left of the pivot point - used for pivot/peak detection
"Pivot Right Bars" ... Number of bars on the right of the pivot point - used for pivot/peak detection
"Entry Offset " ... Entry price offset after crossing pivot line (in %)
"Trailing Activation Level " ... Trailing stop activation level above/below average price (in %)
"Trailing Offset " ... Trailing stop price (in %)
"Stop Loss " ... Absolute stop-loss (in %)
"Alert Message Type" ... Alert message type: generic or Alertatron
"Backtest ..." ... Backtest timeframe; area outside this timeframe will be grayed out
I'm looking forward to any feedback, reviews and change requests!
