BEST Pivots CloudHello traders,
This script is an adaption of an FXCM indicator called Pivots Cloud
Takes in input two timeframes, build the pivots based on them and fill the space between those pivots
Should be non-repainting
Best
Dave
Pivotstrategy

Pivot Points Daily and WeeklyThis will let trader see Daily and Weekly Pivot points with R/S5.
Daily Pivot point line --> Orange Color
Daily R1-5 ---> Black circles
Daily S1-5 ---> Black circles
Weekly Pivot lines ---> Purple Color
Weekly R1-5 ---> Red Circles
Weekly S1-5 ---> Red Circles

CPR with Pivot LevelsWe recommend some preconditions for Intraday Trading Strategy with CPR (Central Pivot Range)
Rules For BUY Setup with CPR
1) Today's Pivot Level Should be higher than Previous Day's Pivot Level
2) The previous day's close should be near day high.
Rules For SELL Setup with CPR
1) Today's Pivot Level Should be lower than Previous Day's Pivot Level
2) The previous day's close should be near day low.
CPR or central pivot range is the best tool available for the trader to see the price base indicator. You can use this tool i.e CPR (central pivot range) to check the price indicator in the stock market. You know the price of shares sometimes goes up or sometimes goes down in the stock market. So it will be best to stay updated and know it before the time the share market/stock market fall or rises.

Pivot of Pivot Reversal Strategy [QuantNomad]Continue looking for more signifcant pivot points.
This script is based on my "Significant Pivot Reversal Strategy".
In this strategy I use concept of pivot of pivot points.
So for PoP I require that pivot highs point should have 2 lower pivot highs points around them and pivot low 2 higher pivot lows points.
Transparent lines represent usual pivot levels ints.
Not transparent lines represent pivot of pivot levels.
Link to original script:

BEST Long Term Levels Breakout ScreenerHello traders
Continuing deeper and stronger with the screeners' educational serie one more time (#daft #punk #private #joke)
We don't have to wait for TradingView to allow screener based on custom indicator - we can build our own ^^
I - Long Terms concept
I had the idea from @scarff.
I think it's genius and I use this long terms level in my trading across all assets.
The screener, in particular, analyzes whenever the price breaks out a weekly/monthly/quarterly/yearly level on candle close .
Triggering events on candle close = we get rid of the REPAINTING = we remove the fake signals (in that case the fake breakouts).
The candle close is based on the close of the current chart => if the chart displays candlesticks on the weekly timeframe, then the considered close will be the weekly close.
If in daily timeframe, the close will be .............................. 4h (#wrong)..... kidding :) .............. DAILY obviously
II - How did I set the screener
The visual signals are as follow:
- square: breakout of a high/low weekly level
- circle: breakout of a high/low monthly level
- diamond: breakout of a high/low quarterly level
- flag: breakout of a high/low yearly level
- dash: none of the above
Then the colors are:
- green when bullish
- red when bearish
- orange/dash when none of the above
Cool Hacks
"But sir... what can we do with only 3 instruments for a screener?" I agree not much but...
As said previously... you can add multiple times the same indicator on a chart :)
Wishing you all the BEST trading and.... wait for it... BEST weekend
Dave

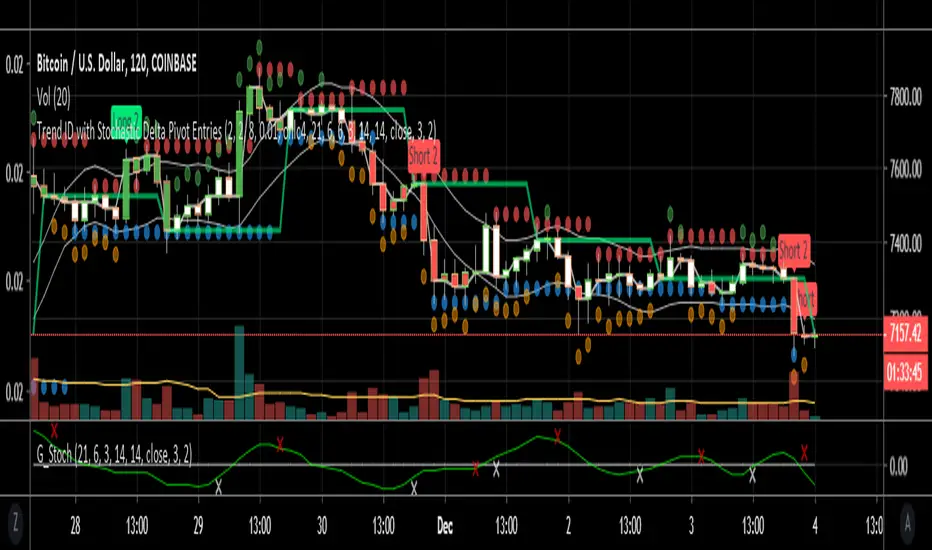
Trend ID with early entry signalsThis script is a combination of two. Firstly a trend is identified as up down or sideways. Higher highs and higher lows makes for an uptrend, lower highs and lower lows similarly allows for a downtrend to be registered. Users can adjust the number of bars to include for detection of the pivot points to increase the accuracy of trend changes but this significantly reduces signals. Sideways movement is determined if the average candle price is within a variance of a short SMA. The SMA follows the close of each candle going back 6 candles by default. The variance is 1% by default so if the price is within 1% of the SMA it's considered sideways and no entries can be issued in this condition.
The indicator is designed to identify the trend for longing or shorting, and then provides the entries based on stochastics converging or diverging (not crosses). The convergence and divergence of stochastics is amalgamated into a short EMA which also has length 6 and can be tuned by the user.
The default values of this script best work on 1h and 2h timeframes for specific pairs like BTCUSD. For other time frames and pairs the settings will need to be tweaked but is possible to identify specific parameters for many different pairs and time frames.
I've written several scripts for personal use however this is my first published script so please use at your own risk! It's not perfect!
QuantNomad - Significant Pivot Reversal Strategy AlertsAlerts for "Significant Pivot Reversal Strategy":
As one of the ways to filter out insignificant levels I decided to check that pivot point is not above/below neighbors, but check that it's above/below at least by a certain amount.
I use ATR, so in params, you can set length of ATR and also ATR multiplier. The new level will be calculated only if PP will be above/below neighbors by atr * atr_mult.
It seems this approach might help in some cases.

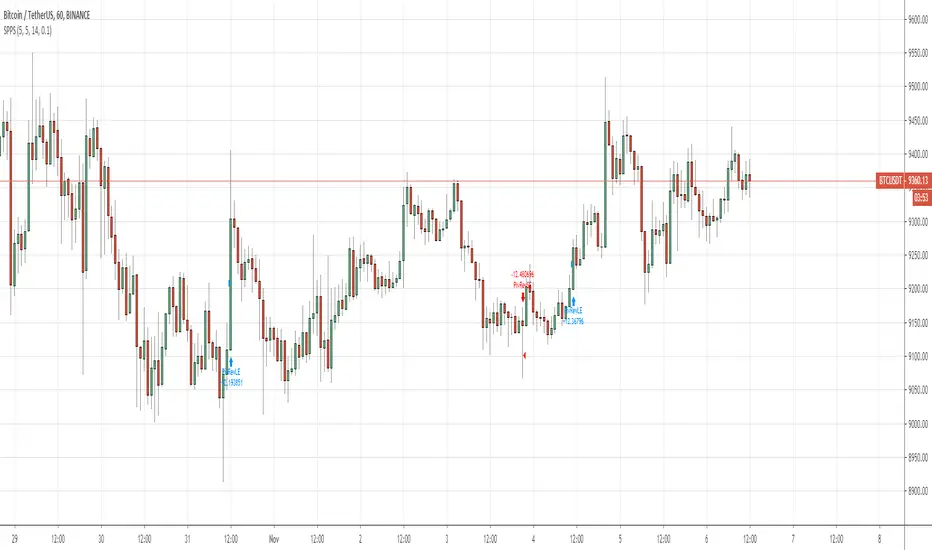
QuantNomad - Significant Pivot Reversal StrategyI'm working on improving the Pivot Points Reversal Strategy.
As one of the ways to filter out insignificant levels I decided to check that pivot point is not above/below neighbors, but check that it's above/below at least by a certain amount.
I use ATR, so in params, you can set length of ATR and also ATR multiplier. The new level will be calculated only if PP will be above/below neighbors by atr * atr_mult.
It seems this approach might help in some cases.
Here I have PivotPoint + RSI strategy:
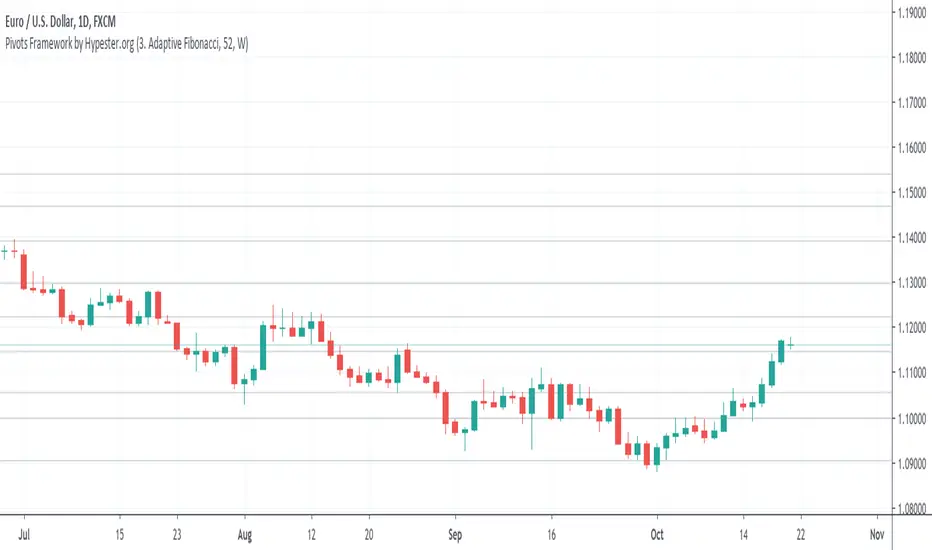
Pivots Framework by HypesterThis is the first release of the basic pivot framework with the three most used ones by our Alpha Community.
You can easily switch between modes, adjust the lookback period, and it works multi-resolution.
Right now, we have:
BB Fibo
Murrey's Channels
Adaptive Fibonacci
The next release will be ATR based pivot formula.
Pivot Points MTFStandart pivot points which auto switching with higher TF ones.
4h pivots on 5min
1D pivots on 15min
1W pivots on 4 hours
1M pivots on daily
1Y pivots on weekly

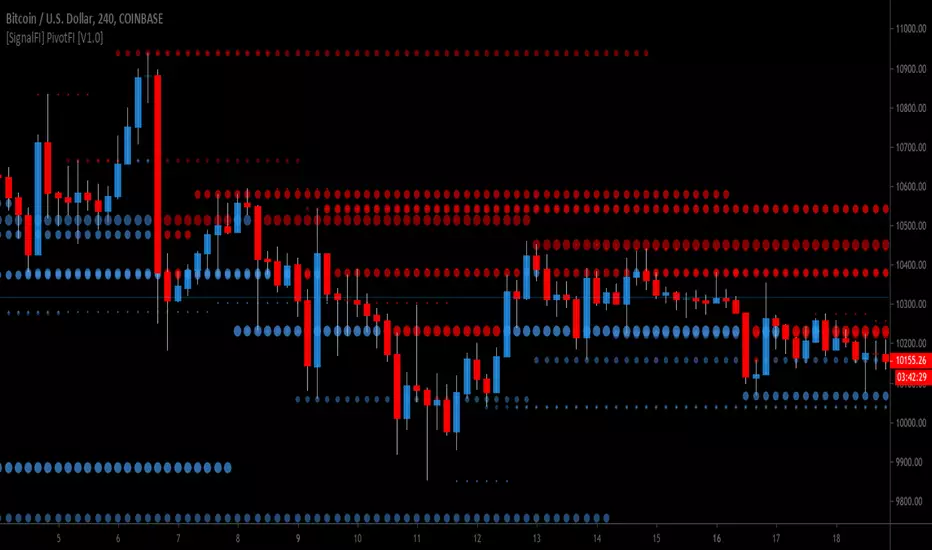
[SignalFI] PivotFI [V1.0]PivotFI provides support and resistance lines based on Fibonacci pivots lengths in any timeframe of your choosing.
Pivots included:
5,8,13,21,34,55
Timeframes:
Any
SignalFI was created to help traders and investors to effectively analyze the market based on the Golden Mean Ratio (Fibonacci numbers), plan a trade and ultimately execute it. To help inform and educate market decisions we developed a set of Trading Indicators which are available on TradingView , the most advanced and yet easy to use charting platform available on the web.
SignalFI indicators are just that, indicators. Our indicators are generally configured to use completely historical data (negating repaint), and we advise all alerts created with SignalFI indicators to be fired upon "close" of the current candle. Our indicators can provide valuable context and visualization support when performing market analysis and executing buy and sell decisions. However. we are not financial experts, and all information presented on this site or our other media outlets are for educational purposes only.
For subscription information, visit www.signalfi.net and follow us on twitter: @signalfi_
QuantNomad - Pivot Points AlertsVery simple scripts that will allow you to receive alerts for new Pivot Lows/Highs Points.
A solid arrow points to actual point low/high point, transparent - to the bar, you'll receive alerts for (Shifter by rightBars).
And remember:
Past performance does not guarantee future results.

(JS) Multi-Time Frame Pivot Point DetectorSick of flipping through Pivot Point settings to change the time frame?
Or to hide certain ones because it screws up the auto-zoom?
Or are you just wishing there was something out there that was simple and effective?
Well - me too, that's why I made this automatic Pivot Points detector. Right now it only goes to S3/R3 (will expand in the future), but I made this specifically for my day trading template.
So this automatically detects the nearest Pivot Points above and below price - and it does Daily, Weekly, and Monthly, so there should be 6 lines showing at all times.
Speaking of which....
Blue - Daily
Green - Weekly
Red- Monthly
You'll also notice a really thick line will appear time to time - that thick line (on all time frames is the Pivot line, so obviously above it is the resistance lines and below it lies the support lines.
All you have to do is turn it on and you'll be completely aware of your surroundings across multiple time frames all at once, hope you like it!
Pivot Points, by @juanmirocks# Advantages over TV's indicator "Pivot Points Standard"
1. Show pivot lines for all history, which lets you gauge trading strategies throughout time
2. More sensible Default/Auto time frame; e.g. on intradays only and always the market values of yesterday's Day are used
3. The halves between the key levels are also shown, which it's useful for some trading strategies
4. Arguably out-of-the-box nicer interface
Pivot Points as an indicator is a traditional strategy to draw resistance and support levels. It's best suited for intraday trading: the pivot points and resulting key levels are calculated from yesterday's market values (H, L, C). More details in the script's source.
Pivot Points trading is suitable for any market, and best for intraday (e.g. 3 min).

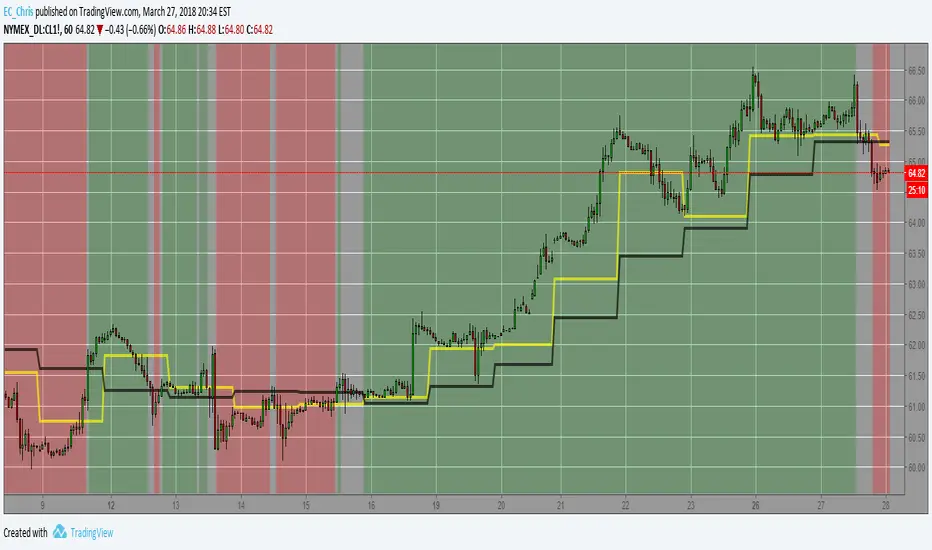
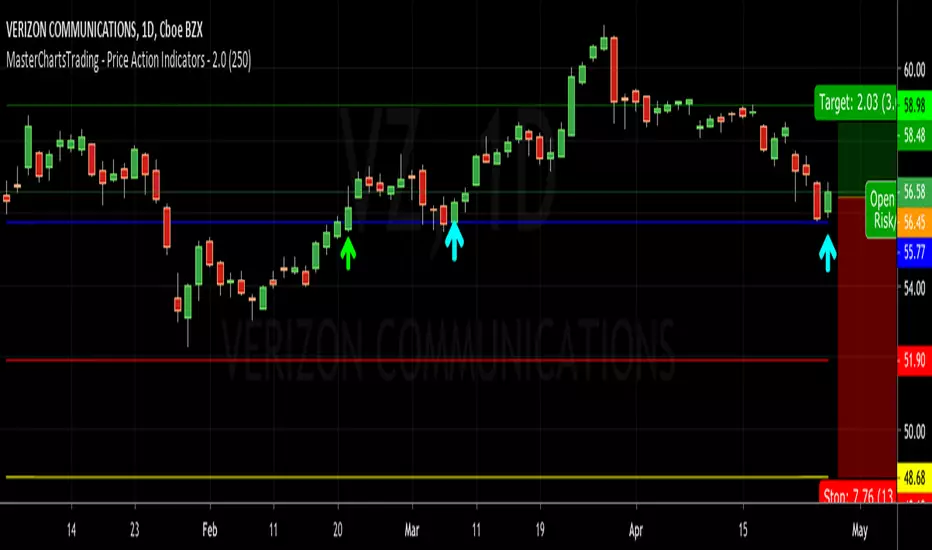
MasterChartsTrading - Price Action Indicators - 2.0Price action is easy to visualize.
It is very easy to read price action if you have a reference point. These support/resistance lines are there to help you read where the buyers and sellers are likely to make a stand.
You can also think of these indicators as moving pivot points.
MasterChartsTrading Price Action Indicators show good price levels to enter or exit at trade.
The Blue indicator line serves as a Bullish Trend setter.
If your instrument closes above the Blue line, we think about going Long (buying).
For commodities and Forex, when your trading instrument closes below the Red line, we think about Shorting (selling).
For Stocks, I prefer to use the Yellow line as my Bearish Trend setter (on Daily charts ).
Be sure to hit that Follow button! Please find me on social networks via the link on my profile page for more ideas from @MasterCharts!
Flow Trend Indicator Strategy V2Incorporated some strategies into one strategy. Every strategy can be tested using the TV StrategyTester.

True Rolling Pivot Range IndicatorHere is the actual 3 day rolling pivot range indicator as detailed in Mark Fisher's book The Logical Trader.