Realtime Position CalculatorRisk management is the single most important factor in trading success. This indicator automates the process of position sizing in real-time based on your account risk and a dynamic technical Stop Loss. It eliminates the need for manual calculations and helps you execute trades faster while adhering to strict risk management rules.
How it Works
The indicator visually places a Stop Loss line based on recent market structure (Highs/Lows) and instantly calculates the required position size (Contracts/Lots) to match your defined monetary risk.
1. Dynamic Stop Loss : It identifies the highest high (for Shorts) or lowest low (for Longs) over a user-defined lookback period.
2. Position Calculation : It calculates the distance between the current price and the Stop Loss level.
3. Formula : Contract Size = Risk Amount / (Distance * Point Value)
4. Actual vs. Target Risk : Because of the rounding, the script calculates and displays the Actual Risk (e.g., $95) alongside your Target Risk (e.g., $100), so you know exactly what is at stake.
Key Features
Real-time Calculation : Updates instantly as price moves.
Copy Trading Support : Includes an "Account Multiplier" setting. If you trade 10 accounts via a copy trader, set the multiplier to 10. The indicator will show the total contract size needed across all accounts.
Point Value Support : Works for Stocks/Crypto (Point Value = 1) and Futures (e.g., ES = 50, NQ = 20).
Customizable UI : Toggle specific data on/off in the label (e.g., hide price, show only contracts). Adjustable label offset to keep the chart clean.
Settings Guide
Trade Direction : Toggle between Long and Short setups. Add the indicator two times and set another for Longs and another for Shorts so you can see both direction at the same time.
Risk Amount : Your max risk in currency (e.g., $100).
Lookback : How many bars back to look for the SL pivot (e.g., 10 bars).
Point Value : Crucial for Futures. Use 1.0 for Crypto/Stocks. Use tick value/point value for futures (e.g., 50 for ES).
Account Multiplier : Multiply the position size for multiple accounts.
Label Offset : Move the information label to the right to avoid overlapping with price action.
Disclaimer
This tool is for informational and educational purposes only. Always verify calculations manually before executing trades. Past performance is not indicative of future results.
Positionsizing

DCA Ladder CalculatorThis script is a DCA (Dollar-Cost Averaging) Ladder Calculator with Risk & Leverage Management baked in.
It’s designed for both LONG and SHORT positions, and helps you:
🎯 Strategically scale into positions across multiple entry points
🔐 Control risk exposure via defined capital allocation
⚖️ Utilize leverage responsibly — for efficiency, not destruction
🧮 Visualize risk, stop loss level, and entry distribution
🔁 Adapt to trend reversals or key zones, especially when combined with reversal indicators or higher timeframe signals
🧠 How It Works
This tool takes a capital allocation approach to building a ladder of positions:
1. You define:
- Portfolio value
- Risk per trade (as %)
- Leverage
- Number of DCA levels
- Entry multiplier (e.g. 1x, 2x, 4x...)
2. The script then:
- Calculates total margin to risk = Portfolio × Risk %
- Calculates total leveraged position size = Margin × Leverage
- Distributes entries according to exponential weights (1x, 2x, 4x...), totaling 7 for 3 levels
- Calculates per-entry:
- Entry price (based on price zone spacing)
- Multiplier
- Exact margin per entry
- Leverage per entry (margin × leverage)
- Computes:
- Average entry price (margin-weighted)
- Approximate stop loss level based on recent ATR and price structure
- % drawdown to SL
- Total margin and position size
3. Displays all this in a clean on-chart table.
📈 How to Use It
1. Apply the indicator to a chart (default: 1D — ideal for clean zones).
2. Configure your:
- Portfolio Value (total trading capital)
- Risk per Trade (%) (your acceptable loss)
- Leverage (exchange or strategy-based)
- DCA Levels (e.g. 3 = anchor + 2 entries)
- Multiplier (typically 2.0 for doubling)
3. Choose LONG or SHORT mode depending on direction.
4. The table will show:
- Entry price ladder
- Margin used per entry
- Total position size
- Approx. stop loss (where your full risk is defined)
Use in conjunction with price action, S/R zones, trendline breaks, volume divergence, or reversal indicators.
✅ Best Practices for Using This Tool
- Leverage is a tool, not a weapon. Use it to scale smartly — not recklessly.
- Use fewer, higher-conviction entries. Don’t blindly ladder; combine with price structure and signals.
- Stick to your risk percent. Never risk more than you can afford to lose. Let this calculator enforce discipline.
- Combine with other confirmation tools, like RSI divergence, momentum shifts, OB zones, etc.
- Avoid martingale-style over-exposure. This is not a gambling tool — it’s for capital efficiency.
🛡️ What This Tool Does NOT Do
- This is not a trade signal indicator.
- It does not place trades or auto-manage positions.
- It does not replace personal responsibility or strategy — it's a tool to help apply structure.
⚠️ Disclaimer
This script is for educational and informational purposes only.
It does not constitute financial advice, nor is it a recommendation to buy or sell any financial instrument.
Always consult a licensed financial advisor before making investment decisions.
Use of leverage involves high risk and can lead to substantial losses.
The author and publisher assume no liability for any trading losses resulting from use of this script.

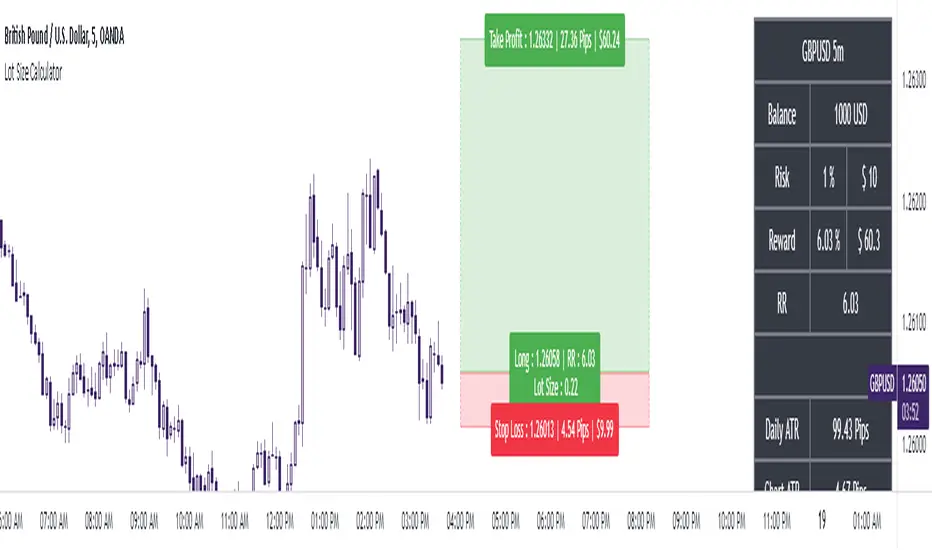
Position Size Calculator + Live R/R Panel — SMC/ICT (@PueblaATH)Position Size + Live R/R Panel — SMC/ICT (@PueblaATH)
Position Size + Live R/R Panel — SMC/ICT (@PueblaATH) is a professional-grade risk management and execution module built for Smart Money Concepts (SMC) and ICT Traders who require accurate, repeatable, institution-style trade planning.
This tool delivers precise position sizing, R:R modeling, leverage and margin projections, fee-adjusted PnL outcomes, and real-time execution metrics—all directly on the chart. Optimized for crypto, forex, and futures, it provides scalpers, day traders, and swing traders with the clarity needed to execute high-quality trades with confidence and consistency.
What the Indicator Does
Institutional Position Sizing Engine
Calculates position size based on account balance, % risk, and SL distance.
Supports custom minimum lot size rounding across crypto, FX, indices, and derivatives.
Intelligent direction logic (Auto / Long / Short) based on SMC/ICT structure.
Advanced Risk/Reward & Profit Modeling
Real-time R:R ratio using actual rounded position size.
Live PnL readout that updates with price movements.
Gross & net profit projections with full fee deduction.
Execution Planning with Draggable Levels
Entry, SL, and TP levels fully draggable for fast scenario modeling.
Automatic projected lines backward/forward with clean label alignment.
TP and SL tags include % movement from Entry, ideal for SMC/ICT journaling.
Precise modeling of real exchange fee structures
Maker fee per side
Taker fee per side
Mixed fee modes (Maker entry, Taker exit, Average, etc.)
Leverage & Margin Forecasting
Margin requirements displayed for 3 customizable leverage settings.
Helps traders understand capital commitment before executing the trade.
Useful for futures, crypto perps, and CFD setups.
Clean HUD Panel for Rapid Decision-Making
A full professional trading panel displays:
Target & actual risk
Position size
Entry / SL / TP
TP/SL percentage distance
Gross profit
Net profit (after fees)
Fees @ TP and @ SL
Live PnL
Margin requirements
Optimized for SMC & ICT Workflows
Perfect for traders using:
Breakers, FVGs, OBs
Liquidity sweeps
Session models
Precision entries (OTE, Displacement, Rebalancing)
Leverage-based execution (crypto perps, futures)
How to Use It
Attach the indicator to your chart.
Set account balance, risk %, fee model, and leverage presets.
Drag Entry, SL, and TP to shape the setup.
View instant calculations of: Position size; R:R; Net PnL after fees; Margin required
Use it as your pre-trade checklist & execution model.
Originality & Credits
This script is an original creation by @PueblaATH, released under the MPL 2.0 license.
It does not copy, modify, or repackage any existing TradingView code.
All logic—including the fee engine, margin calculator, responsive HUD, dynamic risk model, and visual execution system—is authored specifically for this indicator.

Position Sizing Calculator (Real-Time) - Futures Edition█ SUMMARY
The following indicator is a Position Sizing Calculator based on Average True Range (ATR), originally developed by market technician J. Welles Wilder Jr., intended for real-time trading.
This script utilizes the user's account size, acceptable risk percentage, and a stop-loss distance based on ATR to dynamically calculate the appropriate position size for each trade in real time.
█ BACKGROUND
Developed for use on the Micro E-mini Nasdaq-100 futures (MNQ), this script provides traders with continuously updated dynamic position sizes. It enables traders to instantly determine the exact number of contracts to use when entering a trade while staying within their acceptable risk tolerance.
This real-time position sizing tool helps traders make well-informed decisions when planning trade entries and calculating maximum stop-loss levels, ultimately enhancing risk management.
█ USER INPUTS
Trading Account Size: Total dollar value of the user's trading account.
Acceptable Risk (%): Maximum percentage of the trading account that the user is willing to risk per trade.
ATR Multiplier for Stop-Loss: Multiplier used to determine the distance of the stop-loss from the current price, based on the ATR value.
ATR Length: The length of the lookback period used to calculate the ATR value.
Show Target Risk Row: Toggle to hide/show the Target Risk Row
SL Levels Display: Option to see Both, Long Only, Short Only, or None of the Stop Loss Level Values.
Contract Point Value ($): Point value per contract. Tooltip highlights common values.
Tick Size: Minimum Price Movement (Default set to 0.25)
Minimum Contracts: Override the Minimum Contracts per trade to a user selected value.
(May Exceed User's Target Risk)

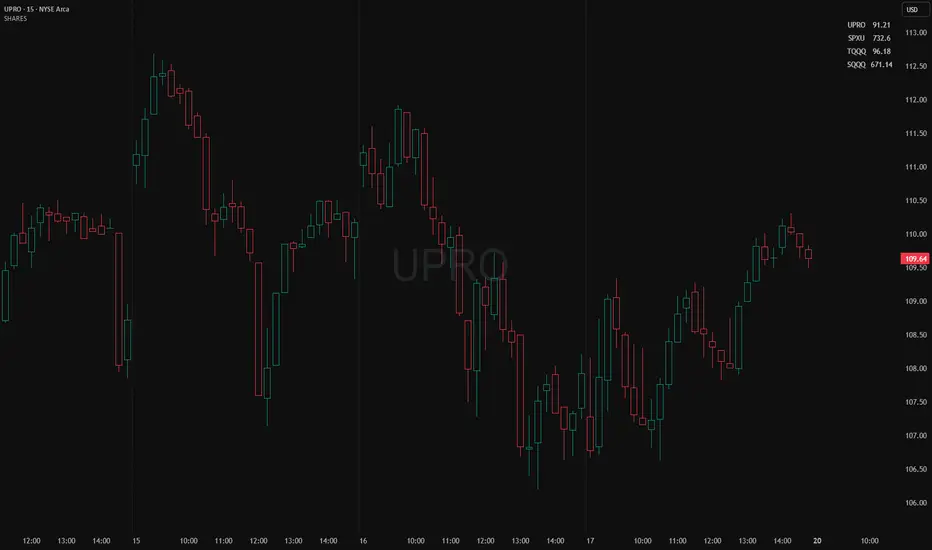
Position Size ToolPosition Size Tool
What it does:
Shows a small on-chart table that converts per-ticker dollar amounts into share counts (shares = amount ÷ current price) for up to 4 configurable tickers.
Inputs (indicator settings)
Ticker 1–4 — select the symbol (TradingView will show the exchange-qualified form like BATS:TQQQ in the settings).
Ticker N $ Amount — dollar amount to convert into shares for that ticker.
Show Ticker N — toggle each row on/off.
Table Text Color — color of the table text.
Table Position — screen location (Top/ Middle/ Bottom × Left/Center/Right).
Font Size — Small / Medium / Large.
Show Empty Top Row — optional spacer row.
What the table displays
Left column: the ticker symbol only (the script strips the exchange prefix for display, so BATS:TQQQ appears as TQQQ in the table).
Right column: the calculated share count, formatted to two decimal places (or "—" if price is not available or zero).
Table updates on the chart’s timeframe using live/last bar prices.
How to use
Add the indicator to a chart.
Open the indicator’s settings panel.
In Ticker 1–4, type/select the symbols you want (you may see the exchange prefix there; that’s TradingView’s UI).
Enter the dollar amounts for each ticker.
Use Show Ticker N to hide/show rows.
Adjust text color, font size, and table position as desired.
Notes
The settings field will always show the exchange-qualified symbol (TradingView behavior); the script strips the exchange only for the on-chart display.
If the selected symbol has no price data on the chart/timeframe, the table shows "—".
Shares are computed as amt ÷ current close from the requested symbol and timeframe.
Example of how to use this tool:
Monitor an index and execute trades on leveraged derivative products. This tool will determine the quantity of shares that can be purchased with a pre-determined dollar amount. Ex: Monitor SPX for entry/exit signals and execute trades on UPRO/SPXU/SPXL/SPXS.
Input a ticker and a dollar amount for position size, shares that can be purchased will be calculated based on the current asset price.
This tool can be helpful for those that use multiple platforms simultaneously to monitor and execute trades.
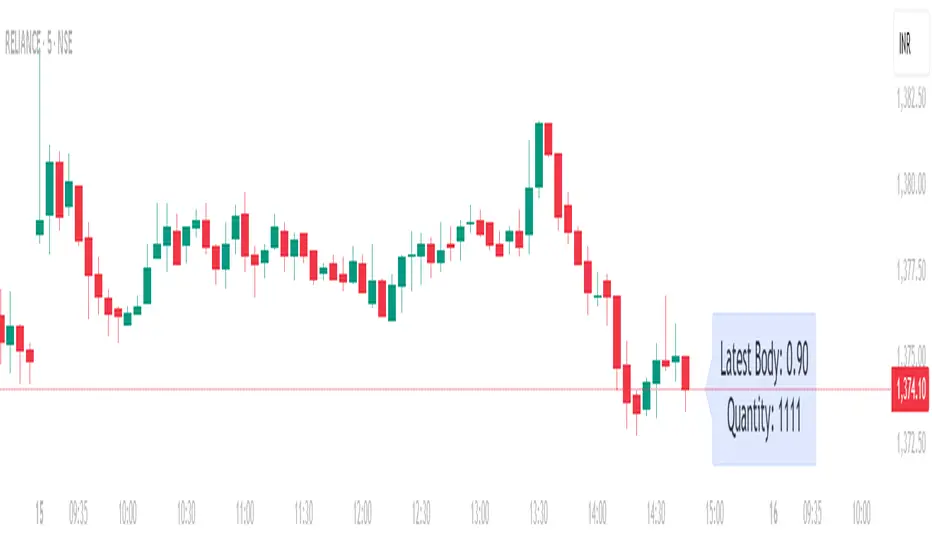
Position Size calculatorOverview
This indicator automatically calculates the average candle body size (|open − close|) for the current trading day and derives a position size (quantity) based on your fixed risk per trade (default ₹1000).
For example:
If today’s average candle body = ₹3.50 and risk = ₹1000 → Quantity = 285
How It Works:
The indicator calculates the absolute difference between open and close (the candle’s body) for every bar of the current day.
It averages those body sizes to estimate the average daily volatility.
Then it divides your chosen risk per trade by the average body size to estimate an appropriate quantity.
It automatically resets at the start of each new day.
Why Use It
While risk size can be derived manually or using TradingView’s built-in Long/Short Position Tool, this indicator provides a faster, more practical alternative when you need to make quick trade decisions — especially in fast-moving intraday markets .
It keeps you focused on execution rather than calculation.
Tip
You can still verify or fine-tune the quantity using the Long/Short Position Tool or a manual calculator, but this indicator helps you react instantly when opportunities appear.
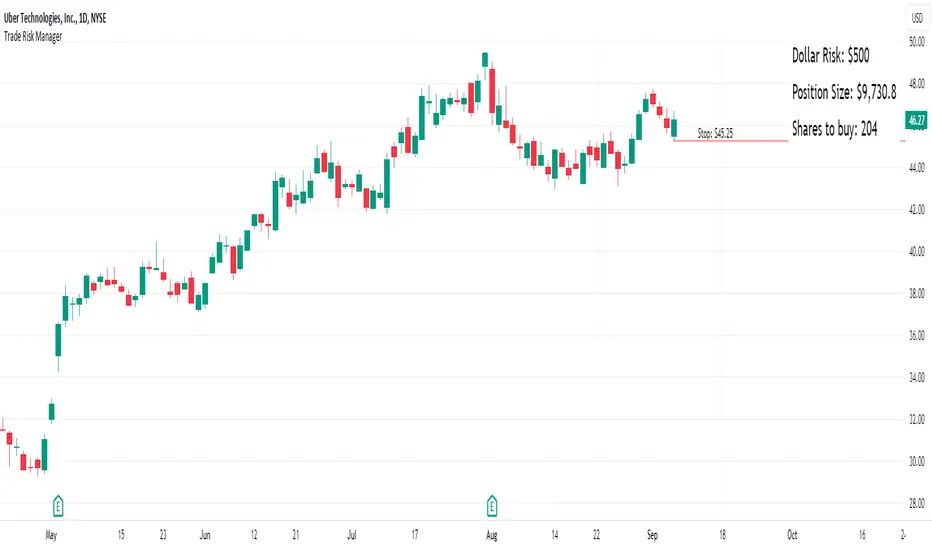
Risk ModuleThis indicator provides a visual reference for position sizing and approximate stop and target placement. It supports trade planning by calculating equalized risk per trade and maintaining consistent exposure across different markets.
For more information about the concept, see the post Position Sizing and Risk Management .
Fixed Fractional Risk
The indicator calculates the number of shares that can be traded to maintain consistent monetary risk. The formula is based on the distance between the current price and stop reference, adjusting position size proportionally. A closer stop results in a larger position size, while a wider stop results in a smaller one.
Position Size = (Account Size × Risk %) ÷ (Entry Price – Stop Price)
Stop and Target
Stop placement is derived from volatility using the Average True Range (ATR). The target is plotted as a multiple of the stop distance, defining the risk-to-reward relationship in R units.
Stop = Price ± ATR × Multiplier
Target = Price ± (R × Risk Distance)
Chart Elements
The stop and target levels are plotted above and below the current price, with the stop marked by a red dot and the target by a green dot. The information table displayed on the chart shows the number of shares to trade, stop level, and target level.
Setup and Configuration
This configuration only needs to be set once, but can be adjusted later if preferred.
1. Start by setting the account size and risk percentage per trade to define the monetary amount risked on each trade. These values form the basis for position size calculation.
2. Set the ATR multiplier to determine stop distance, common values range between 1 and 3 ATR. Lower values place stops closer to price, increasing sensitivity but risking short-term noise. Higher values widen the stop, which reduces noise impact but extends time in risk.
3. Set the R-multiple to determine target distance relative to the stop. A value of 1 represents a 1:1 risk-to-reward relationship. Lower values reduce potential reward but tend to increase win rate, whereas higher values increase potential reward but tend to reduce win rate. The selection depends on system characteristics and trade expectancy.
When the parameters are defined, the indicator displays the stop, target, and calculated position size on the chart. All that remains is to enter the trade with the number of shares shown in the table and place bracket orders at the plotted stop and target levels.
Settings Overview
Account Size / Risk %: Defines account capital and per-trade exposure.
ATR Multiplier: Adjusts stop distance relative to volatility.
R Multiple: Sets target distance relative to stop (risk-reward ratio).
Position: Choose Long or Short direction.
Table Position: Controls information table placement and scale.

Risk Recommender — (Heatmap)📊 Risk Recommender — Per-Trade & Annualized (Heatmap Columns)
Estimate the optimal risk percentage for any market regime.
This tool dynamically recommends how much of your account equity to risk — either per trade or at a portfolio (annualized) level — using volatility as the guide.
⚙️ How it works
Two distinct modes give you flexibility:
1️⃣ Per-Trade (ATR-based)
• Calculates the current Average True Range (ATR) compared to its long-term baseline.
• When volatility is high (ATR ↑), risk per trade decreases to maintain constant dollar risk.
• When volatility is low (ATR ↓), risk per trade increases within your defined floor and ceiling.
• The display is normalized by stop distance (× ATR) and smoothed to avoid noise.
2️⃣ Annualized (Volatility Targeting)
• Computes realized volatility (standard deviation of log returns) and an EWMA forecast of future volatility.
• Blends current and forecast volatilities to estimate “effective” volatility.
• Scales your base risk so that portfolio volatility converges toward your chosen annual target (e.g., 20%).
• Useful for portfolio-level or systematic strategies that maintain constant volatility exposure.
🎨 Heatmap Visualization
The vertical column graph acts like a thermometer:
• 🟥 Red → “Reduce risk” (volatility high).
• 🟩 Green → “Increase risk” (volatility low).
• Smoothed and bounded between your Floor and Ceiling risk levels.
• Optional dotted guides mark those bounds.
• Label shows the current mode, recommended risk %, and key metrics (ATR ratio or effective volatility).
🔧 Key Inputs
• Base max risk per trade (%) — your normal per-trade risk budget.
• ATR length / Baseline ATR length — control sensitivity to short- vs. long-term volatility.
• Target annualized volatility (%) — portfolio volatility target for quant mode.
• λ (lambda) — smoothing factor for the EWMA volatility forecast (0.90–0.99 typical).
• Floor & Ceiling — clamps the output to avoid extreme sizing.
• Smoothing & Hysteresis — prevent rapid changes in risk recommendations.
🧮 Interpreting the Output
• “Recommended Risk (%)” = suggested portion of equity to risk on the next trade (or current exposure).
• In Per-Trade mode: reflects current ATR ÷ baseline ATR .
• In Annualized mode: reflects target volatility ÷ effective volatility .
• Use the color and height of the column as a quick visual cue for aggressiveness.
💡 Typical Use Cases
• Position-sizing overlay for discretionary traders.
• Volatility-targeting component for algorithmic or multi-asset systems.
• Educational tool to understand how volatility governs prudent risk management.
📘 Notes
• This indicator provides risk suggestions only ; it does not place trades.
• Works on any symbol or timeframe.
• Combine with your own strategy or alerts for full automation.
• All calculations use built-in Pine functions; no proprietary logic.
Tags:
#RiskManagement #ATR #Volatility #Quant #PositionSizing #SystematicTrading #AlgorithmicTrading #Portfolio #TradingStrategy #Heatmap #EWMA #Risk

Position Sizer SimplifiedThis is a Pine Script® indicator for TradingView called "Position Sizer Simplified". Its primary function is to help a trader quickly calculate the appropriate position size for a trade based on their chosen risk tolerance, account size, and the trade's entry/stop-loss levels. The results are displayed neatly in a customizable table on the chart.
This tool is essential for proper risk management in trading.
Core Functionality & Inputs
The script uses a few key inputs to perform its calculations:
Account & Risk Configuration
Account Size: You can define and switch between two account sizes (account_size_1 and account_size_2) using the account_option toggle ("P1" or "P2"). The chosen size determines the total capital.
Risk % per Trade (risk_percent): This is the percentage of your chosen account size that you are willing to lose on a single trade. Example: 0.5% risk on a $180,000 account means you risk $900 per trade.
Trade Parameters
Entry Price, Stop Loss Price, Target Price: These are the manual prices a trader enters for their planned trade.
Reset All Inputs (enable_reset): A toggle to quickly clear the three price inputs by setting them to 0.
🧮 Key Calculations
The script calculates several critical values to determine the position size:
Risk per Trade: The actual dollar amount you are risking:
Account Size×(100Risk %)
Stop Distance: The price difference between the entry and stop-loss:
Entry Price−Stop Loss Price
(This assumes a Long trade; for a Short trade, the calculation would be reversed, but the magnitude must be positive for the next step).
Position Size: The maximum number of shares/contracts you can buy/sell while keeping the dollar risk within your Risk per Trade amount. This is the main output:
Position Size=Floor(Stop DistanceRisk per Trade)
The math.floor() function ensures the position size is a whole number (no fractional shares).
Capital Required: The total cost to open the calculated position:
Position Size×Entry Price
Risk/Reward (R:R) Ratio: The potential reward compared to the risk taken:
Stop DistanceTarget Price−Entry Price
Table Display & Customization
The script's output is displayed in a customizable table on the chart.
Display Toggles
A large section of boolean (input.bool) variables (e.g., show_position_size, show_rr_ratio) allows the user to turn on/off individual rows in the results table, customizing what information is shown.
Visual Settings
Table Position: The user can select one of four corners for the table (Top Right, Bottom Right, Top Left, Bottom Left).
Colors and Size: Extensive inputs are provided to customize the table's background, border, font size, and text colors.
Conditional Coloring
The script uses colors to provide quick visual warnings and checks on key metrics:
Risk % per Trade:
Green/Lime for ≤1.0% (Low Risk)
Orange for >1.0% and ≤2.0% (Medium Risk)
Red for >2.0% (High Risk)
R:R Ratio:
Green/Lime for ≥2 (Good)
Red for <2 (Bad)
Capital Check:
Green if Capital Required ≤ Account Size (Within Limit)
Red if Capital Required > Account Size (Exceeds Account)
Displayed Outputs
The table provides a comprehensive set of calculated metrics, including:
Current Ticker: The symbol of the asset being traded.
Position Size: The calculated share/contract quantity.
Risk per Trade: The dollar amount risked.
Stop Distance (pts/%): How far the stop-loss is from the entry price, in both price points and a percentage of the entry price.
Target Reward ($/%): The potential profit in dollars and as a percentage.
R:R Ratio: The calculated Risk/Reward ratio.
Target 1 (50%): Half the distance to the full target (potential partial take profit).
Target 2 (100%): The full target_price.
Capital Check: A quick status on whether the trade exceeds the total account size.
Summary: A single line detailing the trade direction (Long/Short), prices, size, and R:R ratio.
This indicator is a powerful tool for traders who want to maintain strict, quantifiable risk control on every position they take.

Kelly Optimal Leverage IndicatorThe Kelly Optimal Leverage Indicator mathematically applies Kelly Criterion to determine optimal position sizing based on market conditions.
This indicator helps traders answer the critical question: "How much capital should I allocate to this trade?"
Note that "optimal position sizing" does not equal the position sizing that you should have. The Optima position sizing given by the indicator is based on historical data and cannot predict a crash, in which case, high leverage could be devastating.
Originally developed for gambling scenarios with known probabilities, the Kelly formula has been adapted here for financial markets to dynamically calculate the optimal leverage ratio that maximizes long-term capital growth while managing risk.
Key Features
Kelly Position Sizing: Uses historical returns and volatility to calculate mathematically optimal position sizes
Multiple Risk Profiles: Displays Full Kelly (aggressive), 3/4 Kelly (moderate), 1/2 Kelly (conservative), and 1/4 Kelly (very conservative) leverage levels
Volatility Adjustment: Automatically recommends appropriate Kelly fraction based on current market volatility
Return Smoothing: Option to use log returns and smoothed calculations for more stable signals
Comprehensive Table: Displays key metrics including annualized return, volatility, and recommended exposure levels
How to Use
Interpret the Lines: Each colored line represents a different Kelly fraction (risk tolerance level). When above zero, positive exposure is suggested; when below zero, reduce exposure. Note that this is based on historical returns. I personally like to increase my exposure during market downturns, but this is hard to illustrate in the indicator.
Monitor the Table: The information panel provides precise leverage recommendations and exposure guidance based on current market conditions.
Follow Recommended Position: Use the "Recommended Position" guidance in the table to determine appropriate exposure level.
Select Your Risk Profile: Conservative traders should follow the Half Kelly or Quarter Kelly lines, while more aggressive traders might consider the Three-Quarter or Full Kelly lines.
Adjust with Volatility: During high volatility periods, consider using more conservative Kelly fractions as recommended by the indicator.
Mathematical Foundation
The indicator calculates the optimal leverage (f*) using the formula:
f* = μ/σ²
Where:
μ is the annualized expected return
σ² is the annualized variance of returns
This approach balances potential gains against risk of ruin, offering a scientific framework for position sizing that maximizes long-term growth rate.
Notes
The Full Kelly is theoretically optimal for maximizing long-term growth but can experience significant drawdowns. You should almost never use full kelly.
Most practitioners use fractional Kelly strategies (1/2 or 1/4 Kelly) to reduce volatility while capturing most of the growth benefits
This indicator works best on daily timeframes but can be applied to any timeframe
Negative Kelly values suggest reducing or eliminating market exposure
The indicator should be used as part of a complete trading system, not in isolation
Enjoy the indicator! :)
P.S. If you are really geeky about the Kelly Criterion, I recommend the book The Kelly Capital Growth Investment Criterion by Edward O. Thorp and others.

[TCV] - Position Tool Position Tool by TheCryptoVizier is a trade-planning widget that lets you drop Entry, Take-Profit and Stop-Loss levels directly on the chart, instantly calculates risk-to-reward and position size, and shows only the numbers you actually need. It’s designed for traders who plan visually and don’t want to juggle spreadsheets or external calculators.
WHAT PROBLEM DOES IT SOLVE?
When you drag price levels on TradingView you still have to:
work out how many contracts / coins you can buy for a fixed $ risk,
check that your R:R is acceptable,
copy the final values somewhere else.
The Position Tool automates all of that inside the chart and keeps the screen clean.
HOW TO USE
Add the indicator to any chart.
Drag the blue (Entry), green (TP) and red (SL) lines to your desired levels.
Set your Risk in USDT and toggle the check-boxes to show / hide extra fields.
Read off the position size, risk and R:R in the corner table or copy the exact numbers from the Data Window.
Place your order with confidence – the maths is already done.
Whether you scalp lower-timeframes or swing trade higher ones, the Position Tool removes friction from trade preparation and lets you focus on execution.
KEY FEATURES
Drag-and-drop Entry / TP / SL lines – plan the trade visually.
Fixed-risk position sizing – enter how much you’re willing to lose in USDT (or account currency) and the script tells you the exact position value and quantity.
Live R-to-R ratio – instantly see whether the reward compensates the risk as you move levels.
Smart info panel – overlay table shows Entry, TP, SL, R:R and – optionally via check-boxes – position in USDT, position in $TICKER and risk in USDT. Hide what you don’t need.
Copy-ready Data Window values – the same numbers appear in TradingView’s Data Window, so you can click any cell to copy it straight to the clipboard.
----------
Disclaimer: This indicator is provided for educational purposes only. Trading involves substantial risk, and nothing here should be construed as financial advice or a recommendation to trade. Always do your own research and consult a qualified professional.

Risk and Position Sizing📏 Why Position Size Should Be Based on Risk?
Let’s say you are ready to lose 1,000 in a trade. Based on your stop loss level, you can calculate how many shares (or quantity) to buy, so that if the stop hits, you only lose that ₹1,000.
This is called risk-based position sizing. It makes your trade size dynamic — small when SL is wide, bigger when SL is tight. No more random position sizes — just systematic.
Portfolio size is multiplied by the selected risk % to get money risk per trade.
This amount is then used to calculate how many shares can be bought for the given stop-loss.
So chose your portfolio size in settings. Default Portfolio size is 1,00,000 .
You can select your risk % per portfolio in the settings — for example:
0.25% for conservative style
0.5% to 1% for balanced traders
1.25% or 1.5% for aggressive ones (not recommended for beginners)
This script will automatically calculate how much quantity you should buy, for each stop-loss scenario.
📈 Progressive & Inverse-Progressive Risk Styles
Some traders follow progressive position sizing — they start with small risk when the trend is just starting, and increase the risk % as the trend confirms.
Others follow inverse-progressive sizing — they take high risk at early stages of a bull market, and reduce risk as the trend matures (when upside becomes limited).
📌 This script allows you to manually control the risk % in settings, so you can adjust it based on your trading phase and style.
📋 Three SL Scenarios – Choose What Matches Your Style
The table shows three different stop-loss conditions, and for each one it calculates:
Today’s Low – tightest stop loss
Yesterday’s Low – slightly safer, ideal for short-term swing trades
EMA Stop (configurable) – gives more breathing room.
You can visually compare all 3 in the table and choose whichever fits your strategy and comfort.
Also, you can customize:
Theme: dark or light
Font size
Table position (upper/lower corners)
🧠 Designed for traders who take risk management seriously.
Let this script handle the math. You focus on execution.
Happy Trading!
– LensOfChartist

EMA 12/26 With ATR Volatility StoplossThe EMA 12/26 With ATR Volatility Stoploss
The EMA 12/26 With ATR Volatility Stoploss strategy is a meticulously designed systematic trading approach tailored for navigating financial markets through technical analysis. By integrating the Exponential Moving Average (EMA) and Average True Range (ATR) indicators, the strategy aims to identify optimal entry and exit points for trades while prioritizing disciplined risk management. At its core, it is a trend-following system that seeks to capitalize on price momentum, employing volatility-adjusted stop-loss mechanisms and dynamic position sizing to align with predefined risk parameters. Additionally, it offers traders the flexibility to manage profits either by compounding returns or preserving initial capital, making it adaptable to diverse trading philosophies. This essay provides a comprehensive exploration of the strategy’s underlying concepts, key components, strengths, limitations, and practical applications, without delving into its technical code.
=====
Core Philosophy and Objectives
The EMA 12/26 With ATR Volatility Stoploss strategy is built on the premise of capturing short- to medium-term price trends with a high degree of automation and consistency. It leverages the crossover of two EMAs—a fast EMA (12-period) and a slow EMA (26-period)—to generate buy and sell signals, which indicate potential trend reversals or continuations. To mitigate the inherent risks of trading, the strategy incorporates the ATR indicator to set stop-loss levels that adapt to market volatility, ensuring that losses remain within acceptable bounds. Furthermore, it calculates position sizes based on a user-defined risk percentage, safeguarding capital while optimizing trade exposure.
A distinctive feature of the strategy is its dual profit management modes:
SnowBall (Compound Profit): Profits from successful trades are reinvested into the capital base, allowing for progressively larger position sizes and potential exponential portfolio growth.
ZeroRisk (Fixed Equity): Profits are withdrawn, and trades are executed using only the initial capital, prioritizing capital preservation and minimizing exposure to market downturns.
This duality caters to both aggressive traders seeking growth and conservative traders focused on stability, positioning the strategy as a versatile tool for various market environments.
=====
Key Components of the Strategy
1. EMA-Based Signal Generation
The strategy’s trend-following mechanism hinges on the interaction between the Fast EMA (12-period) and Slow EMA (26-period). EMAs are preferred over simple moving averages because they assign greater weight to recent price data, enabling quicker responses to market shifts. The key signals are:
Buy Signal: Triggered when the Fast EMA crosses above the Slow EMA, suggesting the onset of an uptrend or bullish momentum.
Sell Signal: Occurs when the Fast EMA crosses below the Slow EMA, indicating a potential downtrend or the end of a bullish phase.
To enhance signal reliability, the strategy employs an Anchor Point EMA (AP EMA), a short-period EMA (e.g., 2 days) that smooths the input price data before calculating the primary EMAs. This preprocessing reduces noise from short-term price fluctuations, improving the accuracy of trend detection. Additionally, users can opt for a Consolidated EMA (e.g., 18-period) to display a single trend line instead of both EMAs, simplifying chart analysis while retaining trend insights.
=====
2. Volatility-Adjusted Risk Management with ATR
Risk management is a cornerstone of the strategy, achieved through the use of the Average True Range (ATR), which quantifies market volatility by measuring the average price range over a specified period (e.g., 10 days). The ATR informs the placement of stop-loss levels, which are set at a multiple of the ATR (e.g., 2x ATR) below the entry price for long positions. This approach ensures that stop losses are proportionate to current market conditions—wider during high volatility to avoid premature exits, and narrower during low volatility to protect profits.
For example, if a stock’s ATR is $1 and the multiplier is 2, the stop loss for a buy at $100 would be set at $98. This dynamic adjustment enhances the strategy’s adaptability, preventing stop-outs from normal market noise while capping potential losses.
=====
3. Dynamic Position Sizing
The strategy calculates position sizes to align with a user-defined Risk Per Trade, typically expressed as a percentage of capital (e.g., 2%). The position size is determined by:
The available capital, which varies depending on whether SnowBall or ZeroRisk mode is selected.
The distance between the entry price and the ATR-based stop-loss level, which represents the per-unit risk.
The desired risk percentage, ensuring that the maximum loss per trade does not exceed the specified threshold.
For instance, with a $1,000 capital, a 2% risk per trade ($20), and a stop-loss distance equivalent to 5% of the entry price, the strategy computes the number of units (shares or contracts) to ensure the total loss, if the stop loss is hit, equals $20. To prevent over-leveraging, the strategy includes checks to ensure that the position’s dollar value does not exceed available capital. If it does, the position size is scaled down to fit within the capital constraints, maintaining financial discipline.
=====
4. Flexible Capital Management
The strategy’s dual profit management modes—SnowBall and ZeroRisk—offer traders strategic flexibility:
SnowBall Mode: By compounding profits, traders can increase their capital base, leading to larger position sizes over time. This is ideal for those with a long-term growth mindset, as it harnesses the power of exponential returns.
ZeroRisk Mode: By withdrawing profits and trading solely with the initial capital, traders protect their gains and limit exposure to market volatility. This conservative approach suits those prioritizing stability over aggressive growth.
These options allow traders to tailor the strategy to their risk tolerance, financial goals, and market outlook, enhancing its applicability across different trading styles.
=====
5. Time-Based Trade Filtering
To optimize performance and relevance, the strategy includes an option to restrict trading to a specific time range (e.g., from 2018 onward). This feature enables traders to focus on periods with favorable market conditions, avoid historically volatile or unreliable data, or align the strategy with their backtesting objectives. By confining trades to a defined timeframe, the strategy ensures that performance metrics reflect the intended market context.
=====
Strengths of the Strategy
The EMA 12/26 With ATR Volatility Stoploss strategy offers several compelling advantages:
Systematic and Objective: By adhering to predefined rules, the strategy eliminates emotional biases, ensuring consistent execution across market conditions.
Robust Risk Controls: The combination of ATR-based stop losses and risk-based position sizing caps losses at user-defined levels, fostering capital preservation.
Customizability: Traders can adjust parameters such as EMA periods, ATR multipliers, and risk percentages, tailoring the strategy to specific markets or preferences.
Volatility Adaptation: Stop losses that scale with market volatility enhance the strategy’s resilience, accommodating both calm and turbulent market phases.
Enhanced Visualization: The use of color-coded EMAs (green for bullish, red for bearish) and background shading provides intuitive visual cues, simplifying trend and trade status identification.
=====
Limitations and Considerations
Despite its strengths, the strategy has inherent limitations that traders must address:
False Signals in Range-Bound Markets: EMA crossovers may generate misleading signals in sideways or choppy markets, leading to whipsaws and unprofitable trades.
Signal Lag: As lagging indicators, EMAs may delay entry or exit signals, causing traders to miss rapid trend shifts or enter trades late.
Overfitting Risk: Excessive optimization of parameters to fit historical data can impair the strategy’s performance in live markets, as past patterns may not persist.
Impact of High Volatility: In extremely volatile markets, wider stop losses may result in larger losses than anticipated, challenging risk management assumptions.
Data Reliability: The strategy’s effectiveness depends on accurate, continuous price data, and discrepancies or gaps can undermine signal accuracy.
=====
Practical Applications
The EMA 12/26 With ATR Volatility Stoploss strategy is versatile, applicable to diverse markets such as stocks, forex, commodities, and cryptocurrencies, particularly in trending environments. To maximize its potential, traders should adopt a rigorous implementation process:
Backtesting: Evaluate the strategy’s historical performance across various market conditions to assess its robustness and identify optimal parameter settings.
Forward Testing: Deploy the strategy in a demo account to validate its real-time performance, ensuring it aligns with live market dynamics before risking capital.
Ongoing Monitoring: Continuously track trade outcomes, analyze performance metrics, and refine parameters to adapt to evolving market conditions.
Additionally, traders should consider market-specific factors, such as liquidity and volatility, when applying the strategy. For instance, highly liquid markets like forex may require tighter ATR multipliers, while less liquid markets like small-cap stocks may benefit from wider stop losses.
=====
Conclusion
The EMA 12/26 With ATR Volatility Stoploss strategy is a sophisticated, systematic trading framework that blends trend-following precision with disciplined risk management. By leveraging EMA crossovers for signal generation, ATR-based stop losses for volatility adjustment, and dynamic position sizing for risk control, it offers a balanced approach to capturing market trends while safeguarding capital. Its flexibility—evident in customizable parameters and dual profit management modes—makes it suitable for traders with varying risk appetites and objectives. However, its limitations, such as susceptibility to false signals and signal lag, necessitate thorough testing and prudent application. Through rigorous backtesting, forward testing, and continuous refinement, traders can harness this strategy to achieve consistent, risk-adjusted returns in trending markets, establishing it as a valuable tool in the arsenal of systematic trading.

BTC/ETH Lot Size for Dexin - V1.0
█ Overview - This tool is specifically tailored for Delta Exchange India’s users.
I use this interactive tool before taking a position in the BTC’s futures perpetual market . With only 3 mouse clicks, I see all the necessary information, whether a Long or Short position.
A visual of Liquidation Price Level, Stop Loss Price Level, Entry Price Level, Break-even Price Level, and Take Profit Price Level can be immediately seen.
On the top right corner of the chart, which Leverage is to be used, No. of Lots to be taken, expected Profit amount, Loss amount, Brokerage Fees, Risk to Reward Ratios, and Return on Investment are shown, excluding brokerage travel. To get the correct answer in the table that suits your account and risk-taking appetite, the user needs to enter the account balance and Risk per trade.
It also does live tracking of the position, and alerts can be configured too.
█ How to Use
Load the indicator on an active chart.
In the Trading View, ensure that the Magnets is enabled (on the left panel). This will precisely select the price levels you want to choose from OHLC for a candle.
When you first load the tool on the bottom of the chart, you will see a blue box with text in white color guiding you on what you need to do.
Before the first click, the box shall prompt “On the signal candle, set the entry level, where the position would be executed”.
Once the entry price level is selected, the next prompt in the blue box shall be “Set the stop loss level where the position would be exited”. Thus, you need to click the stop loss price level.
Now that the two clicks of Entry and Stop Loss are already done, the last remaining is for the take profit. The last prompt shall be “Set the profit level where the position would be exited”. Therefore, you need to select your take-profit level
Finally, when all three points are selected, the tool shall draw trade zones.
The tool automatically determines whether it is a Long Position or Short Position from the Stop loss and take-profit price levels concerning the entry price level
If the take profit level is above the entry price, the stop must be below, and vice versa; otherwise, an error occurs.
You can change levels by dragging the handles that appear when you select the indicator, or by entering new values in the settings.
Once the position tool is on a chart, it will appear at the same levels on all symbols you use.
If you select the position tool on your chart and delete it, this will also delete the indicator from the chart. You will need to re-add it if you want to draw another position tool. You can add multiple instances of the indicator if you need a position tool on more than one of your charts.
█ Features
Display
The tool displays the following information as graphical visuals
The Liquidation to Stop Loss, Stop Loss to Entry, Entry to Break-even, and Entry to Take Profit zones shall be initiated from the entry candle point.
If you want to be from the candle that crossed the level at a different time from the entry candle, you may go to the settings and adjust the time accordingly. Please note that the time interval is 15 minutes, so at times you may not be able to see the graphical display; however, once the 15-minute time interval is over, you will see the graphical display on the chart.
The tool displays the following information in a tabulated manner
The first row indicates the Leverage that is best suited. The leverage selection by default is greater than or equal to the risk distance.
The second row indicates the number of lots that is computed in relation to the account balance, Risk appetite, Entry price, and Stop Loss price.
The third row indicates estimated profit considering taker's fees and is computed in relation to the number of Lots, Entry price, and Take-Profit price.
The fourth row indicates estimated loss considering taker's fees and is computed in relation to the number of Lots, Entry price, and Stop Loss price.
The fifth row indicates the actual Risk to Reward Ratio, ignoring the travel that pertains to fees.
The sixth row indicates actual Return on Investment, ignoring the travel that pertains to fees.
The intent is to allow the user to make an informed decision prior to taking a position by seeing “$/Rs.” or “% of R O I” or “R : R”.
In case the user wants to know beforehand what the expected charges are that need to be borne before taking a position, that too is made available in the seventh and eighth rows. Both sides' charges are made available for ready reference, irrespective of the outcome of the trade, the user knows the consequences beforehand.
█ Settings
'Trade Sizing'
The tool's input menu is divided into various parts. The first part is 'Trade Sizing'. The user needs to key in the exact number that appears in the Delta Exchange India account against 'Account Balance ($)'. The second thing the user needs to do is key in the 'Risk per Trade'. By default,t it is set to 0.25 and has a default stop change of 0.25. Alternatively, the user can key in any number (Whole number or Rational number) within 100 if that suits their risk management criterion.
'Trade Levels'
Allows users to manually set the Entry, Time, Stop Loss, and Take Profit Price Levels.
'Aggressive Mode Selection'
As the Liquidation zone is shown on the chart, if the user feels that the liquidation price level is too far from the stop loss, this option of 'Use Aggressive Leverage?' allows to increase the leverage, thus reducing the investment amount and in return increasing the Return on Investment %.
The second option in this category is 'Compute Lots based on invested Margin?' itself is self-explanatory, and thus the tabulated data shall be populating the data based on the number entered by the user against 'Margin to be invested ($)'. It is for the user to ensure that the estimated outcomes are within their risk management criterion.
'Conversion & Charges'
If the user wants to see the Profit, Loss, and Fees amount in 'Rs.', all that needs to be done is simply enable the 'Show P&L in Rs.?' The conversion shall take place considering 1 USD = 85 Rs. Same as that carried out by Delta Exchange India.
If the user wants to see the Brokerage Fees, all that needs to be done is simply enable the 'Show Brokerage Fees?'. On enabling this, the table shall show Profitable Trade's (PT) Fees and Lost Trade's (LT) Fees irrespective of the outcome of the trade. The intent is to allow the user to make informed decisions to avoid regrets or surprises at the end of the trade.
'Table'
The division of the input section is related to table position, font size and colors for text and background.
█ Alerts
Alerts can be configured by clicking 'More' (the three dots that appear when you place the cursor on the indicator title that appears on the top left corner of the chart). Alternatively, one can configure alerts by right-clicking on either of the two price levels - Stop Loss price level or Take Profit Price level. Upon right clicking, a window shall appear and the topmost line on that window shall display 'Add alert on ……….' The user can thus put alerts on either of the key levels, such as Stop Loss, Take Profit, and Break Even, or on all of them one by one.

AccumulationPro Money Flow StrategyAccumulationPro Money Flow Strategy identifies stock trading opportunities by analyzing money flow and potential long-only opportunities following periods of increased money inflow. It employs proprietary responsive indicators and oscillators to gauge the strength and momentum of the inflow relative to previous periods, detecting money inflow, buying/selling pressure, and potential continuation/reversals, while using trailing stop exits to maximize gains while minimizing losses, with careful consideration of risk management and position sizing.
Setup Instructions:
1. Configuring the Strategy Properties:
Click the "Settings" icon (the gear symbol) next to the strategy name.
Navigate to the "Properties" tab within the Settings window.
Initial Capital: This value sets the starting equity for the strategy backtesting. Keep in mind that you will need to specify your current account size in the "Inputs" settings for position sizing.
Base Currency: Leave this setting at its "Default" value.
Order Size: This setting, which determines the capital used for each trade during backtesting, is automatically calculated and updated by the script. You should leave it set to "1 Contract" and the script will calculate the appropriate number of contracts based on your risk per trade, account size, and stop-loss placement.
Pyramiding: Set this setting at 1 order to prevent the strategy from adding to existing positions.
Commission: Enter your broker's commission fee per trade as a percentage, some brokers might offer commission free trading. Verify Price for limit orders: Keep this value as 0 ticks.
Slippage: This value depends on the instrument you are trading, If you are trading liquid stocks on a 1D chart slippage might be neglected. You can Keep this value as 1 ticks if you want to be conservative.
Margin for long positions/short positions: Set both of these to 100% since this strategy does not employ leverage or margin trading.
Recalculate:
Select the "After order is filled" option.
Select the "On every tick" option.
Fill Orders: Keep “Using bar magnifier” unselected.
Select "On bar close". Select "Using standard OHLC"
2. Configuring the Strategy Inputs:
Click the "Inputs" tab in the Settings window.
From/Thru (Date Range): To effectively backtest the strategy, define a substantial period that includes various bullish and bearish cycles. This ensures the testing window captures a range of market conditions and provides an adequate number of trades. It is usually favorable to use a minimum of 8 years for backtesting. Ensure the "Show Date Range" box is checked.
Account Size: This is your actual current Account Size used in the position sizing table calculations.
Risk on Capital %: This setting allows you to specify the percentage of your capital you are willing to risk on each trade. A common value is 0.5%.
3. Configuring Strategy Style:
Select the "Style" tab.
Select the checkbox for “Stop Loss” and “Stop Loss Final” to display the black/red Average True Range Stop Loss step-lines
Make sure the checkboxes for "Upper Channel", "Middle Line", and "Lower Channel" are selected.
Select the "Plots Background" checkboxes for "Color 0" and "Color 1" so that the potential entry and exit zones become color-coded.
Having the checkbox for "Tables" selected allows you to see position sizing and other useful information within the chart.
Have the checkboxes for "Trades on chart" and "Signal Labels" selected for viewing entry and exit point labels and positions.
Uncheck* the "Quantity" checkbox.
Precision: select “Default”.
Check “Labels on price scale”
Check “Values in status line”
Strategy Application Guidelines:
Entry Conditions:
The strategy identifies long entry opportunities based on substantial money inflow, as detected by our proprietary indicators and oscillators. This assessment considers the strength and momentum of the inflow relative to previous periods, in conjunction with strong price momentum (indicated by our modified, less-lagging MACD) and/or a potential price reversal (indicated by our modified, less-noisy Stochastic). Additional confirmation criteria related to price action are also incorporated. Potential entry and exit zones are visually represented by bands on the chart.
A blue upward-pointing arrow, accompanied by the label 'Long' and green band fills, signifies a long entry opportunity. Conversely, a magenta downward-pointing arrow, labeled 'Close entry(s) order Long' with yellow band fills, indicates a potential exit.
Take Profit:
The strategy employs trailing stops, rather than fixed take-profit levels, to maximize gains while minimizing losses. Trailing stops adjust the stop-loss level as the stock price moves in a favorable direction. The strategy utilizes two types of trailing stop mechanisms: one based on the Average True Range (ATR), and another based on price action, which attempts to identify shifts in price momentum.
Stop Loss:
The strategy uses an Average True Range (ATR)-based stop-loss, represented by two lines on the chart. The black line indicates the primary ATR-based stop-loss level, set upon trade entry. The red line represents a secondary ATR stop-loss buffer, used in the position sizing calculation to account for potential slippage or price gaps.
To potentially reduce the risk of stop-hunting, discretionary traders might consider using a market sell order within the final 30 to 60 minutes of the main session, instead of automated stop-loss orders.
Order Types:
Market Orders are intended for use with this strategy, specifically when the candle and signal on the chart stabilize within the final 30 to 60 minutes of the main trading session.
Position Sizing:
A key aspect of this strategy is that its position size is calculated and displayed in a table on the chart. The position size is calculated based on stop-loss placement, including the stop-loss buffer, and the capital at risk per trade which is commonly set around 0.5% Risk on Capital per Trade.
Backtesting:
The backtesting results presented below the chart are for informational purposes only and are not intended to predict future performance. Instead, they serve as a tool for identifying instruments with which the strategy has historically performed well.
It's important to note that the backtester utilizes a tiny portion of the capital for each trade while our strategy relies on a diversified portfolio of multiple stocks or instruments being traded at once.
Important Considerations:
Volume data is crucial; the strategy will not load or function correctly without it. Ensure that your charts include volume data, preferably from a centralized exchange.
Our system is designed for trading a portfolio. Therefore, if you intend to use our system, you should employ appropriate position sizing, without leverage or margin, and seek out a variety of long opportunities, rather than opening a single trade with an excessively large position size.
If you are trading without automated signals, always allow the chart to stabilize. Refrain from taking action until the final 1 hour to 30 minutes before the end of the main trading session to minimize the risk of acting on false signals.
To align with the strategy's design, it's generally preferable to enter a trade during the same session that the signal appears, rather than waiting for a later session.
Disclaimer:
Trading in financial markets involves a substantial degree of risk. You should be aware of the potential for significant financial losses. It is imperative that you trade responsibly and avoid overtrading, as this can amplify losses. Remember that market conditions can change rapidly, and past performance is not indicative of future results. You could lose some or all of your initial investment. It is strongly recommended that you fully understand the risks involved in trading and seek independent financial advice from a qualified professional before using this strategy.

Prop Firm Guard: Risk & Sizing Tracker by TFTProp Firm Guard: Risk & Sizing Tracker by TFT
Overview:
This script is designed to help prop firm traders stay within risk rules and avoid emotional overtrading. It tracks your max loss limits, daily loss rules, and gives real-time position sizing suggestions based on your account status.
This tool is especially helpful for newer traders navigating prop firm challenges and rules like trailing drawdowns and daily stopouts.
Key Features:
✅ Real-time tracking of max loss and daily loss limits
✅ Supports both Intraday and End-of-Day (EOD) drawdown styles
✅ Calculates remaining “distance” to max/daily loss levels
✅ Automatically locks max loss once it trails up to starting balance
✅ Provides smart, tier-based position sizing suggestions (5%–50%)
✅ Shows profit target progress and live daily P&L
Use Case Example:
Let’s say you’re trading a $50,000 prop account with a $2,000 max drawdown limit.
If you're using Intraday Drawdown:
• You start the day at $50,000.
• During the day, your balance grows to $51,000 (including unrealized profits).
• The drawdown logic will trail this intraday high — so your new max loss limit becomes $49,000 (51K - 2K).
• If your balance drops to $49,400, this tool will show you’re $400 away from breaching the limit.
• Sizing suggestions will adjust accordingly to keep you in a safe range.
If you're using End-of-Day (EOD) Drawdown:
• The same scenario (account grows to $51,000 intraday) won’t affect your max loss limit immediately.
• EOD drawdown is only updated based on your end-of-day closing balance.
• So even if you hit $51K intraday, your max loss limit still remains at $48,000 (50K - 2K) until the trading day closes and updates your best equity.
• This mode offers more flexibility during the day — and the tool reflects this in how it calculates distances and sizing.
📌 It will then suggest a conservative sizing range — maybe 5–10% of your allowed contract size — until you're safer again.
📌 Make sure you update your current balance after each trade and follow your risk settings.
Inputs Explained (with Tips):
• Overall Account Starting Balance: Your full prop account size (e.g., 50000 or 100000, 150000, 300000, so on)
• Day Start Balance: What your balance was when the trading day started
• Daily Max Loss: How much you’re allowed to lose in one day (used only for EOD drawdown)
• Daily Profit Target: Your goal for the day (e.g., 500 or 1000 or so on)
• Allowed Overall Drawdown: Usually 4% for prop firms — like 2000 on 50K, or 6000 on 300K
• Drawdown Mode:
→ Intraday: Includes floating/unrealized profits in drawdown logic
→ EOD: Uses only end-of-day equity for drawdown logic
• Best Day High: Your highest balance to date. If not above your starting balance, this is ignored
• Intraday High (Manual): Optional override if your peak balance isn’t same as equity (used only for intraday drawdown mode)
• Current Equity: Update this during the session to reflect your live balance — everything else updates automatically
What You’ll See on the Chart:
🟩 Equity Section: Start balance, current balance, intraday high, best day high
🟥 Risk Section:
• Max loss limit (based on trailing logic)
• Distance from current balance to that limit
• Daily loss limit and distance (EOD mode only)
🟦 Performance Metrics:
• Daily P&L in $ and %
• Progress to profit target (shows ✅ Accomplished when goal is hit)
📦 Sizing Suggestion:
Based on how close you are to a drawdown breach, and your total drawdown tier.
Ranges from ⚠️ 5–10% to ✅ 40–50% of your max allowed contract size.
Who It's Best For:
• Built and optimized for 50K prop firm accounts
• Works well with 100K, 150K, or even 300K — but the sizing logic is most precise at 50K
• Best suited for futures or forex prop firm traders using account challenge-style rules
Manual Input Required:
Due to TradingView limitations, we cannot read your actual trades or live balance.
You'll need to update the Current Equity field yourself — but the rest is auto-calculated from there.
Most inputs (like overall balance and drawdown) are set once and rarely changed.
Beta Notice:
This tool is currently in beta and under testing. It's free for now and designed to help the trading community — but accuracy may vary.
Please send feedback if you'd like to suggest improvements or report bugs.
Disclaimer:
This tool is for educational purposes only and does not provide trading advice or signal any trades.
Always trade according to your firm’s rules. The author is not responsible for losses resulting from use of this script.

Metatrader CalculatorThe “ Metatrader Calculator ” indicator calculates the position size, risk, and potential gain of a trade, taking into account the account balance, risk percentage, entry price, stop loss price, and risk/reward ratio. It supports the XAUUSD, XAGUSD, and BTCUSD pairs, automatically calculating the position size (in lots) based on these parameters. The calculation is displayed in a table on the chart, showing the lot size, loss in dollars, and potential gain based on the defined risk.

Nasan Risk Score & Postion Size Estimator** THE RISK SCORE AND POSITION SIZE WILL ONLY BE CALCUTAED ON DIALY TIMEFRAME NOT IN OTHER TIMEFRAMES.
The typically accepted generic rule for risk management is not to risk more than 1% - 2 % of the capital in any given trade. It has its own basis however it does not take into account the stocks historic & current performance and does not consider the traders performance metrics (like win rate, profit ratio).
The Nasan Risk Score & Position size calculator takes into account all the listed parameters into account and estimates a Risk %. The position size is calculated using the estimated risk % , current ATR and a dynamically adjusted ATR multiple (ATR multiple is adjusted based on true range's volatility and stocks relative performance).
It follows a series of calculations:
Unadjusted Nasan Risk Score = (Min Risk)^a + b*
Min Risk = ( 5 year weighted avg Annual Stock Return - 5 year weighted avg Annual Bench Return) / 5 year weighted avg Annual Max ATR%
Max Risk = ( 5 year weighted avg Annual Stock Return - 5 year weighted avg Annual Bench Return) / 5 year weighted avg Annual Min ATR%
The min and max return is calculated based on stocks excess return in comparison to the Benchmark return and adjusted for volatility of the stock.
When a stock underperforms the benchmark, the default is, it does not calculate a position size , however if we opt it to calculate it will use 1% for Min Risk% and 2% for Max Risk% but all the other calculations and scaling remain the same.
Rationale:
Stocks outperforming their benchmark with lower volatility (ATR%) score higher.
A stock with high returns but excessive volatility gets penalized.
This ensures volatility-adjusted performance is emphasized rather than absolute returns.
Depending on the risk preference aggressive or conservative
Aggressive Risk Scaling: a = max (m, n) and b = min (m, n)
Conservative Scaling: a = min (m, n) and b = max (m, n)
where n = traders win % /100 and m = 1 - (1/ (1+ profit ratio))
A default of 50% is used for win factor and 1.5 for profit ratio.
Aggressive risk scaling increases exposure when the strategy's strongest factor is favorable.
Conservative risk scaling ensures more stable risk levels by focusing on the weaker factor.
The Unadjusted Nasan risk is score is further refined based on a tolerance factor which is based on the stocks maximum annual drawdown and the trader's maximum draw down tolerance.
Tolerance = /100
The correction factor (Tolerance) adjusts the risk score based on downside risk. Here's how it works conceptually:
The formula calculates how much the stock's actual drawdown exceeds your acceptable limit.
If stocks maximum Annual drawdown is smaller than Trader's maximum acceptable drawdown % , this results in a positive correction factor (indicating the drawdown is within your acceptable range and increases the unadjusted score.
If stocks maximum Annual drawdown exceeds Trader's maximum acceptable drawdown %, the correction factor will decrease (indicating that the downside risk is greater than what you are comfortable with, so it will adjust the risk exposure).
Once the Risk Score (numerically equal to Risk %) The position size is calculated based on the current market conditions.
Nasan Risk Score (Risk%) = Unadjusted Nasan Risk Score * Tolerance.
Position Size = (Capital * Risk% )/ ATR-Multiplier * ATR
The ATR Multiplier is dynamically adjusted based on the stocks recent relative performance and the variability of the true range itself. It would range between 1 - 3.5.
The multiplier widens when conditions are not favorable decreasing the position size and increases position size when conditions are favorable.
This Calculation /Estimate Does not give you a very different result than the arbitrary 1% - 2%. However it does fine tune the % based on sock performance, traders performance and tolerance level.

Position Size CalculatorPosition Size Calculator – Trading Risk Management Tool
📌 Overview:
The Position Size Calculator is a powerful and easy-to-use TradingView script designed to help traders calculate optimal position sizing, stop-loss levels, and potential profit/loss before entering a trade. By using this tool, traders can effectively manage risk and maximize reward with precise capital allocation.
🛠 Key Features:
✅ User-Friendly Inputs: Customize your entry price, portfolio size, position size, stop-loss %, and risk/reward ratio.
✅ Automatic Position Sizing: Calculates the capital required, quantity to buy, stop-loss, and target price dynamically.
✅ Risk & Reward Calculation: Displays potential profit/loss and risk on total capital (%) for better trade decisions.
✅ Customizable Display Options: Supports dark mode, adjustable table size, and flexible positioning.
✅ Visual Markers (Optional): Plots horizontal rays for stop-loss and target levels on the chart for better visualization.
✅ Optimized for All Markets: Works seamlessly with stocks, forex, crypto, and commodities.
🎯 How to Use:
1️⃣ Enter your entry price and portfolio amount.
2️⃣ Adjust the position size (%) and stop-loss % according to your risk appetite.
3️⃣ Set the risk/reward ratio to determine the profit target.
4️⃣ The script automatically calculates capital required, quantity to buy, stop-loss & target prices.
5️⃣ Use the display table to review trade metrics before executing your order.
🚀 Why Use This Script?
🔹 Helps traders avoid over-leveraging and control risk effectively.
🔹 Ensures consistent position sizing for disciplined trading.
🔹 Works across any time frame and instrument on TradingView.
🔹 Perfect for beginners and experienced traders to improve trade management.
⚡ Maximize your trading potential with proper risk management! Add this script to your chart and start making smarter trade decisions today! 🚀
The Ultimate Lot Size Calculator Backstory
I created this Pine Script tool to calculate lot sizes with precision. While there are many lot size calculators available on TradingView, I found that most had significant flaws. I started teaching myself Pine Script over three and a half years ago with the sole purpose of building this tool. My first version was messy and lacked accuracy, so I never published it. I wanted it to be better than any other available tool, but my limited knowledge back then held me back.
Recently, I received a request to create a similar tool, as the current options still fail to deliver the precision and reliability traders need. This inspired me to revisit my original idea. With improved skills and a better understanding of Pine Script, I redesigned the tool from scratch, making it as precise, reliable, and efficient as possible.
This tool features built-in error detection to minimize mistakes and ensure accuracy in lot size calculations. I've spent more time on this project than on any other, focusing on delivering a solution that stands out on TradingView. While I plan to add more features based on user feedback, the current version is already a powerful, dependable, and easy-to-use tool for traders who value precision and efficiency in their lot size calculations.
How to use the tool ?
At first it might seem complicated, but it is quite easy to use the tool. There are two modes: auto and manual. By default, the tool is set on manual mode. When you apply the tool on the chart, it will ask you to choose the entry price, then the stop-loss price, and at last the take-profit price. Select all of them one by one. These values can be changed later.
Settings
There are various setting given for making the tool as flexible as possible. Here is the explanation for some of most important settings. Play with them and make yourself comfortable.
General settings
Auto mode : Use this mode if you want the the risk reward to be fixed and stop loss to be based on ATR. However the stop loss can be changed to be based on user input.
Manual mode : Use this mode if you want full control over entry, stop loss and take profit.
Contract Size : The tool works perfectly for all forex pairs including gold and silver but as the contract size is different for different assets it is difficult to add every single asset into the script manually so i have provided this option. In case you want to calculate lot size for a asset other then forex, gold or silver make sure to change this. Contract size = Quantity of the asset in 1 standerd lot.
Account settings
Automatic mode settings and ATR stop settings
Manual mode settings
Table and risk-reward box settings are pretty much self-explanatory i guess.
Error handling
A lot size calculator is a complex program. There are numerous points where it may fail and produce incorrect results. To make it robust and accurate, these issues must be addressed and managed properly, which practically all existing lot size calculator scripts fail to do.
Golden tip
When the symbol is changed it will display a symbol change warning as the entry, stop loss and take profit price won't change.
There are 2 ways to get fix this. Either manually enter all three values which i hate the most or remove the script from the chart and re-apply the script on chart again.
So to re-apply the indicator in most easy way follow the following instructions:
Note : If you encounter any other error then read the instruction to fix it and if it is an unknow error pleas report it to me in comments or DM.
Position Sizing Calculator (Real-Time)█ SUMMARY
The following indicator is a Position Sizing Calculator based on Average True Range (ATR), originally developed by market technician J. Welles Wilder Jr., intended for real-time trading.
This script utilizes the user's account size, acceptable risk percentage, and a stop-loss distance based on ATR to dynamically calculate the appropriate position size for each trade in real time.
█ BACKGROUND
Developed for use on the 5-minute timeframe, this script provides traders with continuously updated, dynamic position sizes. It enables traders to instantly determine the exact number of shares and dollar amount to use for entering a trade within their acceptable risk tolerance whenever a trade opportunity arises.
This real-time position sizing tool helps traders make well-informed decisions when planning trade entries and calculating maximum stop-loss levels, ultimately enhancing risk management.
█ USER INPUTS
Trading Account Size: Total dollar value of the user's trading account.
Acceptable Risk (%): Maximum percentage of the trading account that the user is willing to risk per trade.
ATR Multiplier for Stop-Loss: Multiplier used to determine the distance of the stop-loss from the current price, based on the ATR value.
ATR Length: The length of the lookback period used to calculate the ATR value.

Profit & Risk CalculatorThe "Profit & Risk Calculator" script in Pine Script (TradingView) is designed to help users calculate potential profit and risk when trading, and to provide alerts when specific price levels are reached (such as entry price, take profit, or stop loss). It includes several components as described below:
1. Input Fields:
The user can manually input various prices: entry price, stop loss price, and take profit price, with steps of 0.25.
There is also an option to input a custom value (e.g., for personal lot sizing) and a total investment amount.
2. Dynamic Lines:
The script draws dynamic horizontal lines for the input prices: entry line (white), stop loss line (red), and take profit line (green).
These lines are automatically updated based on the entered price levels.
3. Labels for the Lines:
Labels are added to the lines to visually indicate the entry, stop loss, and take profit levels on the chart.
4. Long and Short Position Calculations:
The script calculates potential profit and loss for both long (profit if the price goes up) and short (profit if the price goes down) positions.
It also calculates the distance between entry and take profit, and distance between entry and stop loss, along with the risk/reward ratio (RR).
5. Alerts:
The script generates alerts when one of the following conditions is met:
Entry Condition: The price touches or exceeds the entry price (high >= entryPrice).
Stop Loss Condition: The price touches or drops below the stop loss price (low <= stopLossPrice).
Take Profit Condition: The price touches or exceeds the take profit price (high >= takeProfitPrice).
6. Lot Calculations:
The script calculates both micro and mini lot sizes based on a preset table and the custom value.
The results are displayed in a table on the chart.
7. Profit/Risk Table:
The script shows two tables:
One table calculates the profit, loss, and risk/reward ratio based on the input entry price.
A second table shows the same calculations based on the current price.
8. Chart Display:
The script places tables and other visual data on the chart, such as preset values, profit and loss calculations, and the distance from take profit and stop loss to the entry price.
English Explanation of Each Part of the Script
1. Input Fields
The script starts with several input fields where the user can specify the entry price, stop loss price, take profit price, custom value, and investment amount. These values help define the parameters for risk/reward calculations.
2. Dynamic Horizontal Lines
Three horizontal lines are drawn on the chart, representing the entry price, stop loss price, and take profit price. These lines update dynamically based on user input.
3. Dynamic Line Updates
As the user adjusts their inputs, the position of the lines is updated in real-time to match the new price levels. This keeps the chart visually accurate.
4. Labels for Lines
Labels are placed on the chart next to each price line, allowing the user to clearly see which line represents which price level.
5. Long and Short Position Calculations
The script calculates the potential profit or loss for both long (prices go up) and short (prices go down) positions, providing users with an idea of their potential gains or losses.
6. **6. Risk/Reward Ratio Calculation
This calculates the Risk/Reward Ratio (RR) by dividing the distance between the take profit and entry price by the distance between the entry and stop loss price. This gives the trader an idea of how much risk they're taking relative to the potential reward.
7. Alert Conditions
The alert conditions are defined based on the price hitting the set levels:
Entry Condition: If the price goes up and touches the entry level, the alert is triggered.
Stop Loss Condition: If the price drops and hits the stop loss level, the alert is triggered.
Take Profit Condition: If the price rises and reaches the take profit level, the alert is triggered.
8. Alert Configuration
Each condition is linked to an alert that sends a message when the specific price level is touched. The alerts notify the user when the entry, stop loss, or take profit levels are hit.
9. Lot Calculations
The script includes a function that calculates micro and mini lot sizes based on a preset table and a custom value input by the user. This is useful for adjusting lot sizes to the desired amount and determining position sizes for trades.
10. Entry Price-Based Profit & Loss Table
A table is generated on the chart that displays detailed information about the profit, loss, and risk/reward ratio based on the entry price. It helps traders see the potential outcomes for different lot sizes.
11. Current Price-Based Profit & Loss Table
This second table provides similar information as the first but calculates profit, loss, and risk/reward based on the current price. This allows the trader to see how their position performs as the market price changes in real time.
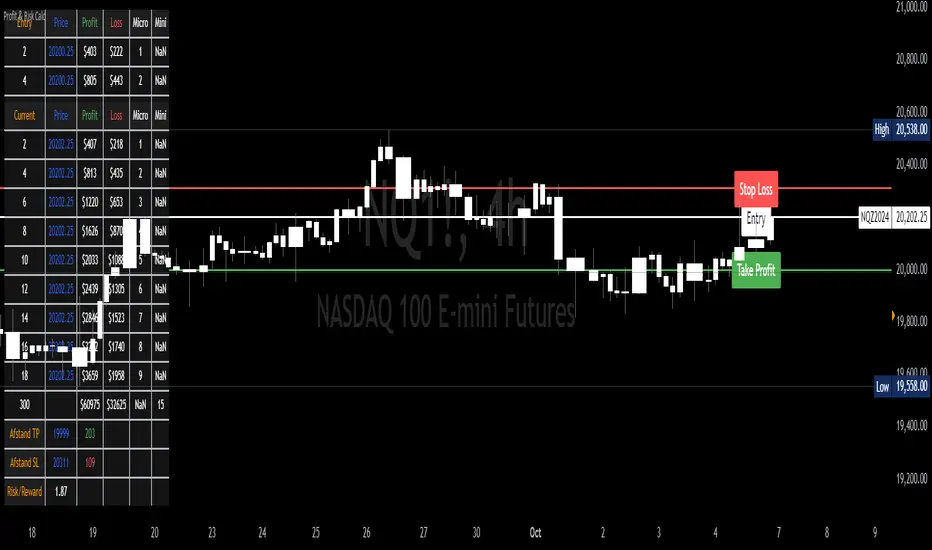
Equity Trade Risk ManagerEquity Trade Risk Manager is a simple indicator that helps you protect your portfolio by going into each trade risk first !
Equity Trade Risk Manager does this by calculating your ideal position size or ideal stop loss based on your account size, purchase price and risk tolerance. This ensures you are never risking more than your predetermined amount on each trade.
Unlike most position size calculators, that will only tell traders how many shares to purchase, Equity Trade Risk Manger allows the trader to choose whether they want to calculate the ideal number of shares to purchase or where to set the trades stop loss based on the number of shares owned. Not only that, but knowing traders need to act fast, the indicator also gives the option to quickly use the current price and low of the day as an entry and stop. Lastly, your stop loss will be plotted onto the chart for a visual aid.
Features:
Dynamic Risk Settings:
Account Customization: Input your account size to get metrics tailored to you.
Calculation Choices: Decide if you want the tool to calculate the number of shares you should buy or where to set your stop-loss.
Custom Risk Parameters: Use preset risk percentages or set your own to match your comfort level.
Price Point Flexibility:
Enter your entry and stop price or opt to use the current price and the low of the day.
Interactive Display Settings:
Customizable Interface: Adjust table positions, text size, and color schemes to match your trading dashboard aesthetic.
On-Chart Stop-Loss Indication: Visualize your stop loss on the chart itself.
Get a snapshot of your dollar risk, position size, shares to buy, and stop-loss.