1 Minute Scalping IndicatorThis is a 1 Minute Scalping Indicator based purely on price action of the current candle compared to the previous candle so there is no lag from using other indicators. It works great on all timeframes, but is designed for getting in and out of positions quickly using the 1 minute chart. The candles will paint according to the direction the price is currently moving in, which is a great way to help reduce anxiety while watching the candles bounce back and forth.
HOW TO USE
It has Scalp Mode and Swing Mode. Both modes use the exact same price action parameters for signals, but Swing Mode will only give signals when the price action parameters are met AND the close is higher than the previous high for bull signals or when the close is lower than the previous low for bear signals.
This scalping indicator will show green up arrows when it detects bullish price action and red down arrows when it detects bearish price action. It will show a yellow arrow if the bullish/bearish price action conditions are met, but it detects a candle pattern that may be a weak signal such as small candle body, large wicks, etc. When this happens, make sure to wait for the next candle to show confirming price action before following the signal. You can also turn the signals off and use only the candle coloring if you prefer cleaner charts.
You can change the candle colors it uses within the input settings, as well as the color of the signal arrows to suit your preferences. You can also turn off the candle coloring if you prefer normal candles. If you are using the indicator’s candle coloring, make sure you go to your chart settings(gear icon top right) and in the symbol tab, turn off body, borders and wick for this to show up properly.
This scalper also includes alerts for bull and bear signals that can be set to alert you on any market and timeframe.
SCANNER
We also made a higher timeframe scanner that uses this same price action formula and shows you if higher timeframes are currently bullish or bearish in real time. It’s titled Higher Timeframe Price Action Scanner and can be found on our profile. I strongly recommend using both of these together to get an idea of the overall trend on longer timeframes. You can also use two of the scanners and set them to two tickers that move together or opposite of each other(like SQQQ and TQQQ) for even more market insight on your ticker's immediate direction.
MARKETS
This 1 Minute Scalping Indicator works well on any market such as stocks, crypto, forex, futures, etc.
TIMEFRAMES
This indicator is designed for scalping on the 1 Minute timeframe, but it works well on all timeframes, since it is using price action to give signals.
TIPS FOR BEST RESULTS
We recommend pairing this indicator with another support & resistance or moving average combo to find great entry areas and use the price action signals as confirmation when price bounces off of those areas. We also recommend using the Higher Timeframe Price Action Scanner with this so you can see the overall trend of higher timeframes on your chart and trade in the direction of the trend.
Scalp Mode
Swing Mode
Candle Coloring Only - No Signals - Scalp Mode
Candle Coloring Only - No Signals - Swing Mode
Priceaction

Percent ResearchPercent Research is an indicator that will plot a color / column on the chart in case custom requirements are met.
The requirements are:
- Price : Price requirement (equal or above input).
- Change % Up : Amount the price have moved up in percent (equal or above input).
- Change % Down : Amount the price have moved down in percent (equal or below input).
- Change Interval : Amount of bars the above move happened over.
- Volume : Volume requirement (equal or above input).
- Volume Interval : Amount of bars in a row that each require the above volume.
Example: In case one wants to plot whenever price has made a 20 percent move up or down in a week with minimum 100 000 volume for each of the last 2 days one can use.
Change % Up: 20
Change % Down: -20
Change Interval: 5
Volume: 100 000
Volume Interval: 2
The indicator will plot a color on the chart whenever the requirements are met, which then can be used to look into price action for each colored time period.
The values can be customized dependent on preference, example 100% movers over a month or 20% movers over a week etc.

Munich GuppyWELCOME to the Munich Guppy!
This is a simple moving average indicator that will help you determine the trend of your chart using historical moving averages.
The indicator consists of 3 EMA's and one ALMA moving average. Using these 4 moving averages I have programmed the relationship between the moving averages to color the background of your chart.
If your background is red, this means that the alma moving average has fallen below the EMA's (EMA1 and EMA 2) as well as (EMA 1 and EMA 2) are postured in a down trending/up trending fashion
For example, the 21EMA is greater than the 55EMA, this signals that the chart has been outperforming its intermediate averages. Now if the ALMA is below both the 21ema and 55ema, in this instance, your chart background will become green.
The ALMA has color options '+CoC' and '-Coc', this simply means if the candle closes below the alma, it will turn red, if closure above it will turn green.
EMA 3 which is default set to 200, has no affect on the color of the background.
Now I hope I have thoroughly explained the simplicity of this indicator, if you have any questions leave them below or private message me for any other requests,
Good Trading!
-CheatCode1

ATR - Average True Range + Dynamic Trend w/ Signals | by Octopu$↕ ATR - Average True Range + Dynamic Trend w/ Signals | by Octopu$
What is ATR?
ATR stands for Average True Range
A Technical Analysis Indicator that measures market volatility by decomposing the range of a Security Price in a specific period.
The ATR can be used as a High Low Spectrum,
As well as a variation of a Moving Average, considering the ranges on a timeframe, generally this being 14 days.
Shorter periods can be used (will generate more signals) or longer periods for steadier trends (for fewer signals)
A ticker on a high volatility has a high ATR.
A ticker on a low volatility has a low ATR.
It is an useful resource for a trading system:
Can be used to enter or exit trades and/or also measure the daily spectrum of a stock.
Does not necessarily points price direction, but takes into account gaps and strong legs.
Can also be used as trading positions confirmation,
Rather be it for stop losses or take profits,
As well as setting trailing stops or limit orders.
This tool offers a great Risk to Reward Ratio, considering the fact you will be aware of the possible moves that an asset can perform.
This indicator should not be used as a standalone tool.
(The combination of factors relies on your own knowledge about Confluence Factors along with your Due Diligence)
This indicator is not an advice to buy or sell securities.
www.tradingview.com
SPY
ANY Ticker. ANY Timeframe.
(Used SPY 5m as Example only)
Features:
• ATR ( Average True Range )
• Range UP and DOWN
• Movement from Price Line
• Dynamic ATR
• Cross/Test Signals
• Live and Last Close
Options:
• Specific Factors Setup
• Length Customization
• Toggle On/Off
• Color PIcker
• Styling Options
Notes:
v1.0
Indicator release.
Changes and updates can come in the future for additional functionalities or per requests. Follow and Stay Tuned!
Did you like it? Please Support and Shoot me a message! I'd appreciate if you dropped by to say thanks! Thank you.
- Octopu$
🐙

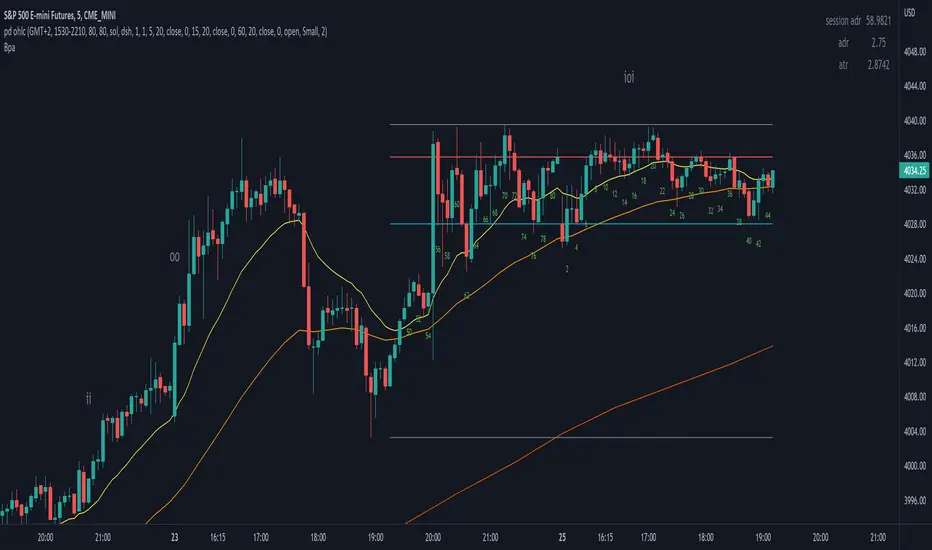
BpaLibrary "Bpa"
TODO: library of Brooks Price Action concepts
isBreakoutBar(atr, high, low, close, open, tail, size)
TODO: check if the bar is a breakout based on the specified conditions
Parameters:
atr : TODO: atr value
high : TODO: high price
low : TODO: low price
close : TODO: close price
open : TODO: open price
tail : TODO: decimal value for a percent that represent the size of the tail of the bar that cant be preceeded to be considered strong close
size : TODO: decimal value for a percent that represents by how much the breakout bar should be bigger than others to be considered one
Returns: TODO: boolean value, true if breakout bar, false otherwise
Smart Money Concepts (SMC) [LuxAlgo]This all-in-one indicator displays real-time market structure (internal & swing BOS / CHoCH), order blocks, premium & discount zones, equal highs & lows, and much more...allowing traders to automatically mark up their charts with widely used price action methodologies. Following the release of our Fair Value Gap script, we received numerous requests from our community to release more features in the same category.
"Smart Money Concepts" (SMC) is a fairly new yet widely used term amongst price action traders looking to more accurately navigate liquidity & find more optimal points of interest in the market. Trying to determine where institutional market participants have orders placed (buy or sell side liquidity) can be a very reasonable approach to finding more practical entries & exits based on price action.
The indicator includes alerts for the presence of swing structures and many other relevant conditions.
Features
This indicator includes many features relevant to SMC, these are highlighted below:
Full internal & swing market structure labeling in real-time
Break of Structure (BOS)
Change of Character (CHoCH)
Order Blocks (bullish & bearish)
Equal Highs & Lows
Fair Value Gap Detection
Previous Highs & Lows
Premium & Discount Zones as a range
Options to style the indicator to more easily display these concepts
Settings
Mode: Allows the user to select Historical (default) or Present, which displays only recent data on the chart.
Style: Allows the user to select different styling for the entire indicator between Colored (default) and Monochrome.
Color Candles: Plots candles based on the internal & swing structures from within the indicator on the chart.
Internal Structure: Displays the internal structure labels & dashed lines to represent them. (BOS & CHoCH).
Confluence Filter: Filter non-significant internal structure breakouts.
Swing Structure: Displays the swing structure labels & solid lines on the chart (larger BOS & CHoCH labels).
Swing Points: Displays swing points labels on chart such as HH, HL, LH, LL.
Internal Order Blocks: Enables Internal Order Blocks & allows the user to select how many most recent Internal Order Blocks appear on the chart.
Swing Order Blocks: Enables Swing Order Blocks & allows the user to select how many most recent Swing Order Blocks appear on the chart.
Equal Highs & Lows: Displays EQH/EQL labels on chart for detecting equal highs & lows.
Bars Confirmation: Allows the user to select how many bars are needed to confirm an EQH/EQL symbol on chart.
Fair Value Gaps: Displays boxes to highlight imbalance areas on the chart.
Auto Threshold: Filter out non-significant fair value gaps.
Timeframe: Allows the user to select the timeframe for the Fair Value Gap detection.
Extend FVG: Allows the user to choose how many bars to extend the Fair Value Gap boxes on the chart.
Highs & Lows MTF: Allows the user to display previous highs & lows from daily, weekly, & monthly timeframes as significant levels.
Premium/Discount Zones: Allows the user to display Premium, Discount, and Equilibrium zones on the chart
Usage
Users can see automatic CHoCH and BOS labels to highlight breakouts of market structure, which allows to determine the market trend. In the chart below we can see the internal structure which displays more frequent labels within larger structures. We can also see equal highs & lows (EQH/EQL) labels plotted alongside the internal structure to frequently give indications of potential reversals.
In the chart below we can see the swing market structure labels. These are also labeled as BOS and CHoCH but with a solid line & larger text to show larger market structure breakouts & trend reversals. Users can be mindful of these larger structure labels while trading internal structures as displayed in the previous chart.
Order blocks highlight areas where institutional market participants open positions, one can use order blocks to determine confirmation entries or potential targets as we can expect there is a large amount of liquidity at these order blocks. In the chart below we can see 2 potential trade setups with confirmation entries. The path outlined in red would be a potential short entry targeting the blue order block below, and the path outlined in green would be a potential long entry, targeting the red order blocks above.
As we can see in the chart below, the bullish confirmation entry played out in this scenario with the green path outlined in hindsight. As price breaks though the order blocks above, the indicator will consider them mitigated causing them to disappear, and as per the logic of these order blocks they will always display 5 (by default) on the chart so we can now see more actionable levels.
The Smart Money Concepts indicator has many other features and here we can see how they can also help a user find potential levels for price action trading. In the screenshot below we can see a trade setup using the Previous Monthly High, Strong High, and a Swing Order Block as a stop loss. Accompanied by the Premium from the Discount/Premium zones feature being used as a potential entry. A potential take profit level for this trade setup that a user could easily identify would be the 50% mark labeled with the Fair Value Gap & the Equilibrium all displayed automatically by the indicator.
Conclusion
This indicator highlights all relevant components of Smart Money Concepts which can be a very useful interpretation of market structure, liquidity, & more simply put, price action. The term was coined & popularized primarily within the forex community & by ICT while making its way to become a part of many traders' analysis. These concepts, with or without this indicator do not guarantee a trader to be trading within the presence of institutional or "bank-level" liquidity, there is no supporting data regarding the validity of these teachings.

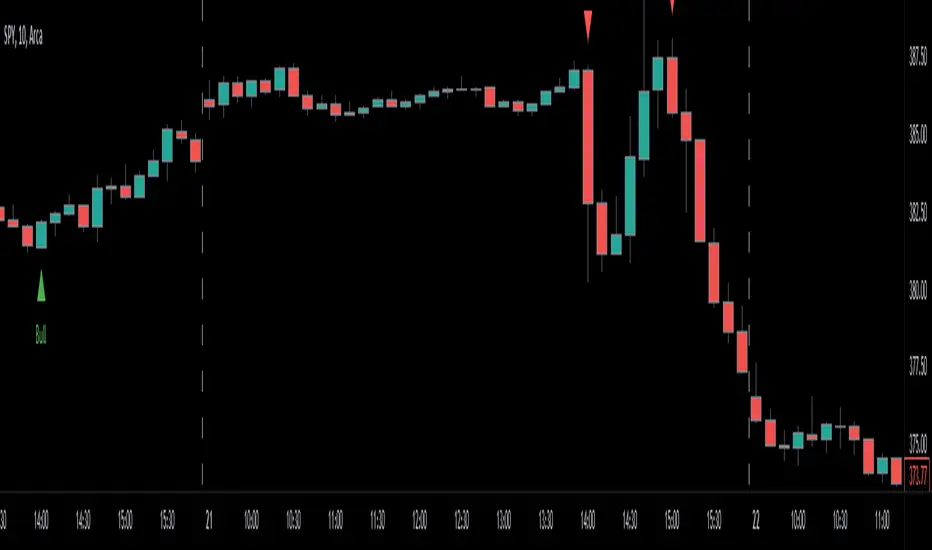
Engulfing Candles (Bullish and Bearish) + Trend | by Octopu$⛳ Engulfing Candles (Bullish and Bearish ) with Trend Recognition | by Octopu$
This Indicator identifies and plots Engulfing Candlestick Patterns.
Engulfing Candles are a combination of two bars on a price chart.
They are used to indicate/anticipate a market reversal.
The second candlestick must be bigger than the first, so it 'engulfs' the previous bar.
This indicator identifies both Price Movements:
Bullish stands for Upside
Bearish stands for Downside
These are NOT entry/exit signals to buy or sell securities*
(*The combination of your understanding and analysis as well as other Indicators and Factors as Confluence, you can improve your Charting Analysis.)
www.tradingview.com
SPY
ANY Ticker. ANY Timeframe.
( SPY 5m as an example only.)
Features:
• Engulfing Candles
• Bullish Setups
• Bearish Setups
• Symbol Signals
Options:
• Color Picker
• Symbol Selector
• Toggle On/Off
• Show name
• Trend Direction
Notes:
v1.0
Indicator release.
Changes and updates can come in the future for additional functionalities or per requests. Follow and Stay Tuned!
Did you like it? Please Support and Shoot me a message! I'd appreciate if you dropped by to say thanks! Thank you.
- Octopu$
🐙
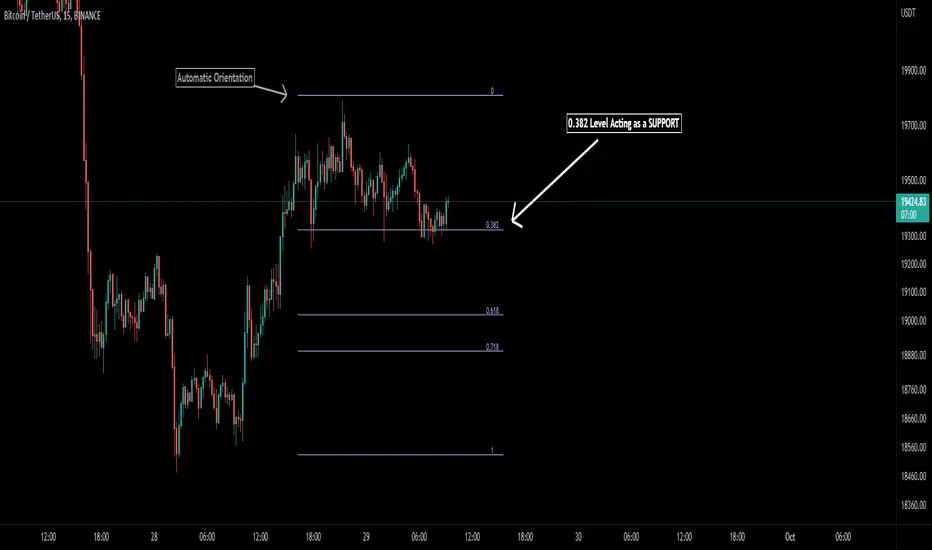
Auto Fibonacci [Misu]█ This indicator shows an automatic Fibonacci retracement levels.
This indicator is designed based on highs, lows, and trend interpretation to orientate the fibonacci retracement in the good direction.
Fibonacci analysis uses a logical sequence of numbers to predict trends and price action.
█ Usages:
The Fibonacci retracement is used to identify hidden support and resistance levels that an investor can use for entry, exit, and stop placement.
Depending on your usage, you can track breakouts above and below retracement levels to provide early entry points for major breakouts and breakdowns.
█ Features:
> Choose Fib levels
> Color Fib Levels all in one
> Color Fib Levels Individually
█ Parameters:
Deviation: A parameter used to calculate pivots.
Depth: A parameter used to calculate pivots.
UI Settings: Select Fibs levels and colors.
((Bearish)) Candle Above EMASGood Morning from the UK.
Todays script is a simple vieweing of when candles close above a certain moving average - when the market is bearish conditions - candle which close above the moving average can be viewed as a bearish signal along with confluences such as price action. This script is best on the Daily and we can expect big price moves away from this area.
The below example, we have a bearish set up with a break of trendline and then a break of a base which would 1) strong area as price is unlikely to go past this area which would make this a supply zone.
This was then followed by the signal of the candle closing above the 100ema and the 50ema.
The script is likened to my one of my previous scripts which portrays the bullish ema candle closes.
I will be making a price action publish soon if that is of interest to the public.

Price Line Extended to the Right with Price Label | by Octopu$🔖 Price Line Extended to the Right with Price Label | by Octopu$
This is an Add-On customization tool for your Chart Price Level.
Tired of having the TradingView's priceline all across the Chart?
And not having the Option to turn it off/extend to right only?
Worry you not. Got solutions for any problems you may have!
As well as many arms.
This Indicator provides an extended price line to the right only,
Starting from the current candle, towards the price levels.
Additionally, provides a quick price label for fast reference.
You can turn on/off the line,
As well as on/off the label.
Colors change according to candle direction:
Up/Down matching Green/Red.
Please remember to turn OFF TradingView's price line.
Otherwise it'll overlap. Price Line/Tag "replaces" that.
Works in Any Time Frame.
On Any Ticker.
(Using ES 5m just as an example:)
www.tradingview.com
SPY
Features:
• Price Tag
• Price Line
• Extend to Right
• Automatic color change
Options:
• Toggle On/Off Price Line
• Toggle On/Off Price Tag
Notes:
v1.0
Indicator release
Changes and updates can come in the future for additional functionalities or per requests.
Did you like it? Boost it. Shoot a message! I'd appreciate if you dropped by to say thanks.
- Octopu$
🐙

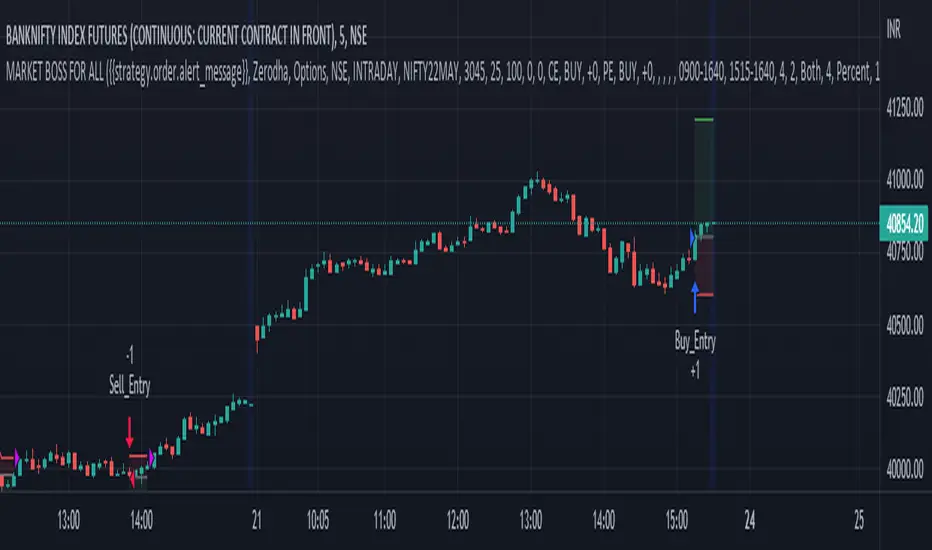
MARKET BOSS FOR ALLTHIS STRATEGY USE FOR ANY TYPE OF MARKET INDIAN,COMMODITY,FOREX ,CRYPTO...This strategy used to determine and anticipate potential changes in market price and reversals. The Highs referred to in the title are created based on the number of bars that exhibit lower highs on either side of a High, whereas the Lows are created based on the number of bars that exhibit higher lows on either side Low.it also analyzing price changes and reversals, a trader has more of an ability to determine and predict price patterns and general price trends...
The backtest results are based on BANKNIFTY last year's data. It has an initial capital of 10000 and the size of the lot is 1. The commission paid is 50 RS cash per trade and the slippage is 5 ticks per trade. Some of the Indian broker's commission is only 10 cash per trade. Adjust the commission as per your broker. Trades are conducted based on the intraday time in India set from 9.20 am to 3:20 pm. All positions will get square off at 3.20 pm. All other parameters are suitable for Robo trading with Indian stock brokers.
Also added Quantity feature it automatically double the quantity on losing trade
reasons why to use strategy
1) human psychology never focus on one thing... We never follow one strategy for long time... Bcs we hve greed... If some one says indicator give u 95% than we chnge our strategy which on we r working but indicator didn't give u back testing... Our strategy gives back testing... On 5 min chart of banknifty future... Tv on premium membership give one year back testing... And on crypto it gives 2month backtesing on 5min chart
2) we hve sufficient back testing trades... On 1year back testing minimum 700 trade should be done for back testing bcs thn we know how our strategy work on all market conditions.... For crypto in 2 month back testing more thn 300 trade needed to know it's performance... Our strategy produce suffiend trades... So we know how it works on all market conditions
3) we provide banknifty strategy for intraday... So it's open trade after 9 20 and close all position on 15: 20...so it's backtesing is sure shot perfect
4) for banknifty option strategy... We have made it to book profit or loss in 5 to 15 min... So no time factor effect... So vry profitable for option buyers
5) for banknifty option we had made it fully auto it's automatically buy at auto strike price.. So no tension to select strike price
6) u can also choose weekly or monthly expirey
7) we hve provided table for monthly proprofits... So we know how it's work on every month
8) last but not least...key of 🔑Sucess in stock market and crypto is following the right path for long time... With non biased strategy with positive backtesting result... And all the best
PA Swings [TTA]Hello traders!
This script helps identify swing high levels of resistance and swing low levels of support via price action.
The indicator is designed to help identify support and resistance by measuring retracements. When the retracement has reached the threshold, the indicator identifies the high or low with a horizontal, solid line.
This line will continue until it is violated. Once it is violated it will adjust to a dashed line and continue until it is violated again (retested).
Therefore, a solid line resembles an unviolated swing level; a dashed line resembles a violated swing level that has yet to be retested.
Ideally, this script will filter some movements by identifying impulses in the market. Knowing that price is in a trending move rather than bouncing around in a range can help traders in their analysis. In range bound conditions the indicator will show small impulses, sometimes trapped by a support and/or resistance line. In trending markets there will be separation between the support and resistance lines.
Retests are also identified by the indicator.
Retests of swing highs and lows may induce precise, repeatable price moves - something a trader might find advantageous. A log is included to help identify potential price levels based on historical actions when an impulse or a retest occurs.
Consequently, this may help traders identify take-profit targets and avoid stop losses that are too close to the entry point.
The indicator has a color identity panel to help you get familiar with the colored lines, line types, and what they mean. The color panel is concealable. Additional customization options are available, such as toggling the chart labels. These labels distinguish impulses up and down, retests, and the distance price has traveled since breaking or creating a support or resistance level.
This can be toggled off. A High-Volume Swings only option is available for those that wish to filter out low volume movements (such as extended market hours).
You also have the option of hiding far away lines and can define what is “far away” for them % wise. It is defaulted to 15% which may need to be adjusted on lower timeframes.
Inactive lines can be shown or they can be removed in the settings as well. While this indicator can find some great levels of support or resistance it is important to remember that, should you find this script helpful, it is a tool in your toolbox!! (:
Hope you enjoy and thank you for checking this out!

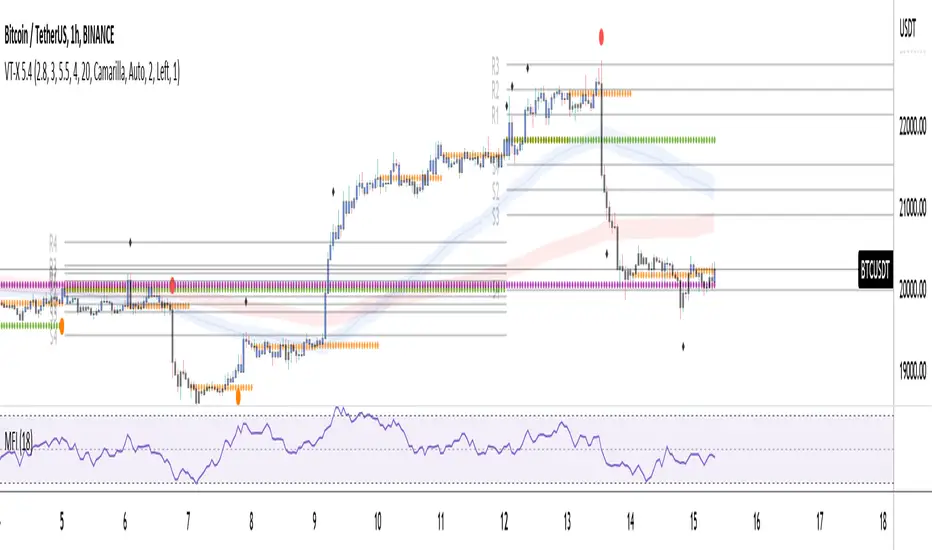
Volume and Trend reversal scalping scriptThe Vtrend X script allows for both trend based and scalping trading entries, it gives you all the trend and reversal information at hand that is necessary. It works best in a trending market.
The fundamental part of the script, is the volume weighted bands in blue and red, which help determine the trend and dynamic support and resistance . The blue band is a shorter length than the red band.
When the blue band dips below the red band, this tells us there is a downtrend. And when the blue band is trending above the red band, this is bullish uptrend price action. You will be able to note price whatever the timeframe really respects these bands, and you can use that to your advantage flicking through the high and low timeframes on where price will go next, combined with your own support and resistance levels.
Combined with the candle colors, which change whether they close above or below the main trend colored line (shown below), help identify a change in price action and trend. This allows for low timeframe plays also.
The uptrend and downtrend cicle signals are shown in a few different colors. Green and red are with the trend and have met all conditions. Orange and purple are against the trend calculations, and Olive circles risky trades against all the filters used to calculate signals.
The reversal signals, are the diamond plots in black, These also represent take profit areas as well.
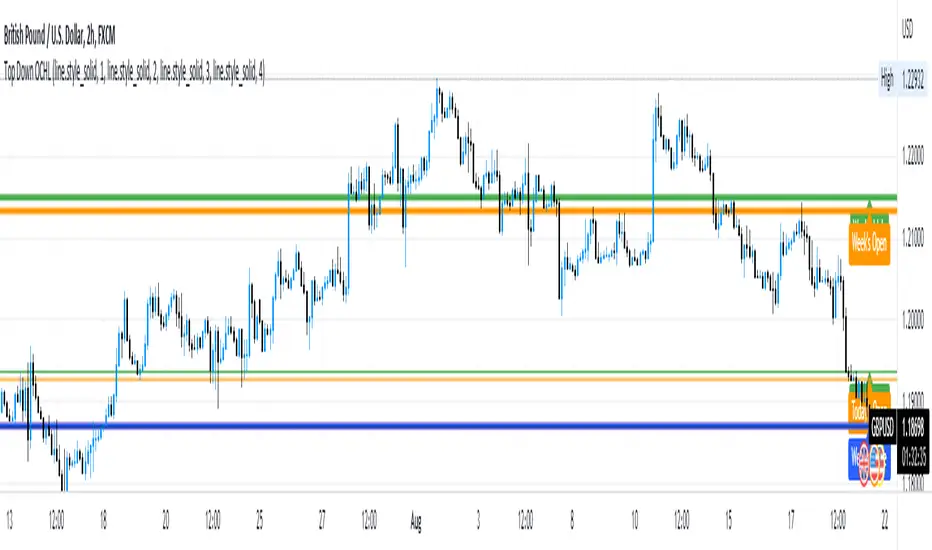
Another key feature is the Daily / Weekly / Monthly and Yearly open levels displayed as colored dots. A lot of the plays i take use the Daily opens as key levels to take a trade off.
The indicator is designed to give you key information, but be quite customisable as well to suit your exact trading style.
Recommended timeframes i use for this script; Weekly (for key liquidity areas), Trading on the Daily, 6h, 4h, 2h, 1h and 25 minutes.
Backtested Settings and Pairs;
Pair - Timeframe - Signals Inputs - Reversal Inputs - ATR Multiplier - MA Filter
BTCUSD - 1 hr - 3 - 2.8 - 5.5 - NA
ETHUSD - 1 hr - 4 - 2.8 - 5.5 - NA
USDCAD - 1 hr - 4 - 2.8 - 5.5 - NA
GBPUSD - 1 hr - 4 - 2.8 - 5.5 - NA
US30 - 1 hr - 4 - 2.8 - 5.5 - NA
BTCUSD - 4 hr - 2.5 - 2.5 - 3.5 - NA
BTCUSD - 25 mins - 5 - 2.5 - 5.5 - NA
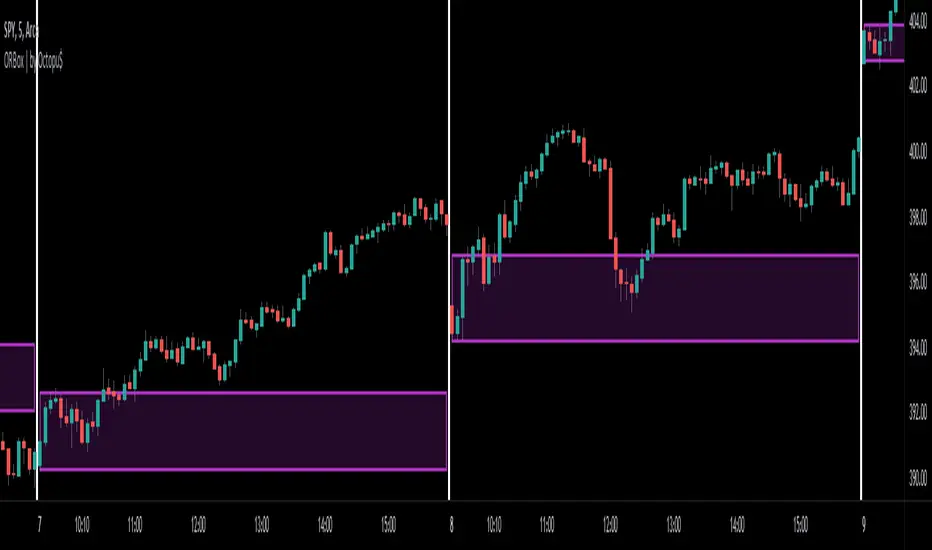
ORBox | by Octopu$📈 ORBox | by Octopu$
ORBox is a Box for the Opening Range Breakout
The Box is added automatically according to the User preferences through GUI
This Indicator includes a Dropdown selection for which Range for the Breakout you want to use
ORBox has built-in Alerts for when the Breakout happens according to your preferences
Works in any Timeframe with any Ticker
(Using SPY 5m just as an example:)
www.tradingview.com
SPY
Features:
• Opening Breakout Range (ORB)
• Dropdown menu selection to choose which TF to watch
• Built-in Alerts for Momentum Awareness
Options:
• Customization for Box Colors and Sizes
• Display ORB for Current Day or Previous
Notes:
v1.0
ORBox Indicator release
Changes and updates can come in the future for additional functionalities or per requests.
Did you like it? Shoot me a message! I'd appreciate if you dropped by to say thanks.
- Octopu$
🐙
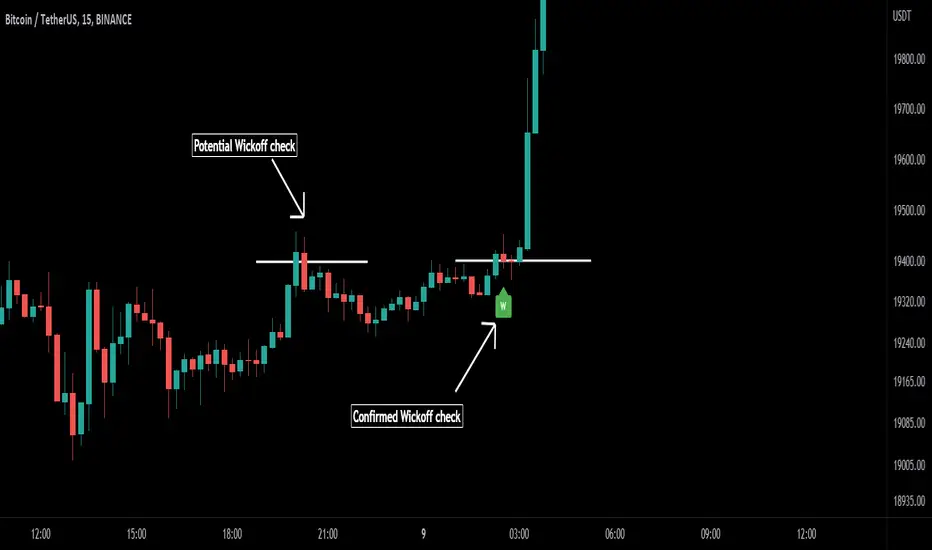
Wick-off Check Pattern [Misu]█ This Indicator shows a wick-off check pattern.
This pattern appears when a candle goes below a level (support or resistance) and closes above it OR when it goes above a level and finishes below it. This causes a wick to go through the level: a wick-off check .
This can confirm a pullback or a breakout.
█ Usages:
This indicator can be used to validate a resistance or support level.
It can also be used to validate breaking levels.
█ Parameters:
Deviation: Parameter used to calculate pivots.
Depth: Parameter used to calculate pivots.
Wickoff Mode: Mode used to detect Wickoff check pattern.
> counter pattern: only shows "pullback" wickoff check.
> breakout pattern: only shows "breakout moves" wickoff check.
> both: shows both.
Lenght Avg Body: Lenght used to calculate the average body size.
First Breakout Factor:
Lenght Avg Wick Validation: This factor multiplied by the "body avg" filters out the non-significant breakout.
Factor Avg Wick Validation: Lenght used to calculate the average wick size.
Max Bars Wickoff: This factor multiplied by the "wick avg", filters out the non-significant wickoff signals.
SBS AlgoHello traders, I am here again with a new and improved indicator.
This indicator is based on a pivot breakout algorithm which gives buy and sell signals according to the breakout of trendline. This is an advanced version of another script. It also takes price action into consideration along with some basic indicators like MACD and ADX to give good entry signals.
NOTE: This indicator is not designed to take entries completely based on signals it gives. Please use it along with your trading strategy to add more confluence to your trading system and maximize your profits.
I hope you guys will like this one too .Enjoy 👍
In case you find any bug, please do report in comment section .Thank you.

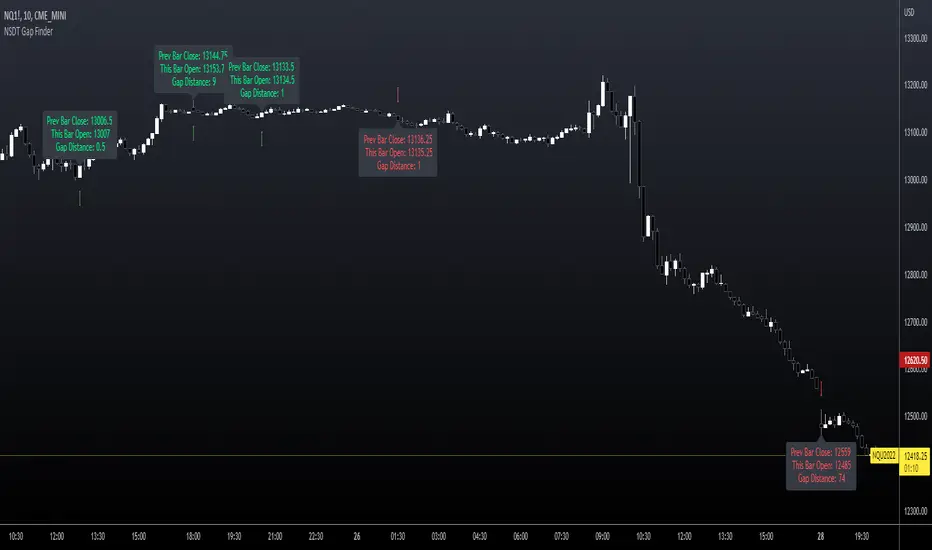
NSDT Gap FinderThis script plots gaps between candles.
It uses the "round_to_mintick" feature in the Pinescript code, so it works on any instrument out to 3 decimal places.
If there is a Gap Up (open of current candle is greater than the close of previous candle) it will plot a green arrow under the current candle and plot a label above the current candle to show the Gap Amount.
If there is a Gap Down (open of current candle is less than the close of previous candle) it will plot a red arrow over the current candle and plot a label below the current candle to show the Gap Amount.
You can turn the label and/or the arrow on and off.
I created this indicator to more easily identify gaps in the market. The probability of a gap being filled is extremely high. Some are right away (intraday candle to candle), some take a while (gap from previous day close to current day open), and some make take a long time (close at end of previous week to open at beginning of current week).
This is published free to use and open source code.
Please see my other similar Gap Indicators.
Daily Gap Range
USA Session - Previous Day Close Gap to Current Day Open
Price Action CandlesThis simple script provides a visual aid for price action traders by coloring outside & inside candles, which in effect leaves the trader with 6 possible candle colors:
-Regular bullish candle
-Outside bullish candle
-Inside bullish candle
-Regular bearish candle
-Outside bearish candle
-Inside bearish candle
These candlesticks may provide powerful signals when used in conjunction with key levels, market structure and chart patterns.
Make sure to disable the regular candlesticks (body, borders and wicks) in the symbol tab inside the configuration menu!
Hope it can help someone!
Opens, Closes, Highs and Lows.Hello Traders, the script below is designed to display the monthly, weekly, previous days' and current days' open, close, high and low.
I designed it to assist in top down analysis by knowing the monthly and weekly opens and closes it makes it a lot easier to make trading decisions on the lower timeframes.
As the user you can choose which price values you'd like displayed on the chart by selecting them in the user inputs.
Enjoy!!
Inside Bar SetupScript Details
- This script plots Inside Bar for given day in selected time-frame (applicable only for Timeframes < Day)
- Basis plotted inside bar, relevant targets are marked on the chart
- Targets can be customised from script settings. Example, if range of mother candle is 10 points, then T1 is 10 * x above/below mother candle and T2 is 10 * y above/below mother candle. This x & y are configured via script settings
How to use this script ?
- This script works well on 10-15 mins timeframe for stocks, 15/30 mins timeframe for nifty index and 30/60 mins time frame for bank nifty index
- If mother candle high is broken, take long trade with SL of mother candle low and if low is broken, take short trade with SL of mother candle high
Remember:
1. Above logic is to be combined with support/resistances i.e. price action. This script is an add-on to price action analysis giving you more conviction.
2. If range of mother candle is very high, it is recommended to avoid the trade.
3. Basis inside bar formed on higher time frame, take trade on basis of lower time frame i.e if inside bar is formed on 60 mins, take trade on the basis of 10-15 mins time frame
Example:
1. As seen in the chart, Nifty is near it's resistance and we are seeing Inside Bar being formed, In such scenario, even if High of Mother Candle is broken, we should be more interested to short as we are near resistance and probability of getting our targets in long side is less.
2. So, if I see breakdown of mother candle i.e. price going below low of mother candle, we will short with SL of high of mother candle.
3. As seen in the chart, both the targets are achieved.
Additional Info:
1. Targets on Long/Short Side can be configured via settings. For indices 1 times/1.5 times the range works well.
2. This script plots targets basis the first inside bar formed in the day for selected time frame.
3. Inside bars formed through out the day are coloured separately but lines are plotted only on the basis of 1st formed inside bar as this strategy works well for the first formed inside bar)
4. Don't forget to check volume in case of breakout/breakdown.
Note:
1. Mother Candle - First Candle of Inside Bar
2. Child Candle - Candle formed inside Mother Candle (Second Candle of Inside Bar)
Happy Trading :)

Fibonacci + Support/Resistant + Trendline (Price action)This is opening source code version: Fibonacci + Support/Resistant + Trendline (One of Advanced Price action Analysis).
How it works:
It find entry Long/Short by combining: Fibonacci + Support/Resistant + Trendline
1. Find Impulse wave:
To findind Impulse wave, It uses Pivot High/Low to find Impulse wave. In case find entry Long, If having Pivot High higher Pivot High before, it will draw an Impulse wave.
2. Find entry at Fibonacci levels:
Draw Fibonacci fibonacci retracement from Pivot Low to Pivot High. A Fibonacci retracement forecast is created by taking two extreme points on a chart and dividing the vertical distance by important Fibonacci ratios. 0% is considered to be the start of the retracement, while 100% is a complete reversal to the original price before the move. Horizontal lines are drawn in the chart for these price levels to provide support and resistance levels. Common levels are 23.6%, 38.2%, 50%, and 61.8%
3. Find entry at Support/Resistant Zone:
Support/Resistant Zone drawed from Pivot High before, which price just breaken and return to retest.
4. Find entry at Trendline:
Trendline drawed from Pivot High/Low before, which price just breaken and return to retest.
How do use it:
+ You can customize the thickness of the lines.
+ You can set up an alert when the price touchs important areas.

Impactful pattern and candles pattern AlertThe Alertion indicator!
impactful pattern:
pattern that happen near the zone or in the zone at lower timeframe and give us entry and stop limit price.
It is helpful for price action traders and those who want to decrease their risk.
There are 3 IP patterns:
Quasimodo
Head and shoulder
whipsaw engulfing
These patterns may occur near the zone or may not occur but by them, you can decrease your trading risk for example you can
trade with half lot before IP pattern and enter with other half after pattern.
how to use?
for example:
you find zone at 1h timeframe for short position
when price enter to your zone
you run this indicator and choose your lower timeframe, for example 15m and click on short position.
Then make the alert by right-click on your chart and choose the add alert and at condition box choose the impactful pattern and then click on create
now wait for message :)
Candles pattern:
like reversal bar, key reversal bar, exhaustion bar, pin bar, two-bar reversal, tree-bar reversal, inside bar, outside bar
these occur when the trend turn, so it is usable when the price enter to your zone or near your zone.
This pattern can decrease your risk.
Inside bar and outside bar:
if this pattern engulf up, it is bullish pattern and if engulf down, it is bearish pattern.
what does this indicator do?
this indicator is for making alert
it helps you to decrease your risk and failure.
You optimize it to alert you when IP pattern happen or candle pattern happen or inside bar or outside bar engulfing or all of them.
For IP pattern, it will message you entry and stop limit price.
It works at 2 different timeframes, so you can make alert for example in 1h TF for candles pattern and 15m TF for IP pattern.
Indicator will alert you for candles pattern at your chart timeframe and for IP pattern at timeframe you've chosen when you run the indicator, and it is changeable
in setting.
setting options
TIMEFRAME
IP: select the timeframe for IP patterns it means when IP pattern happen at that timeframe the indicator will alert you
example = your TF is 1h, you found the supply zone and want to trade, note that IP pattern happen in lower TF, so you select 15m TF or TF lower than 1h.
Short position: select it if you want to make short position.
BUFFERING
indicator send you entry and stop limit price
you can change it by amount of percent
it is your strategy to change your entry and stop loss or not
example= in head and shoulder pattern at short position, the stop limit is high price of head in pattern
so the indicator will message you the exact price but if you want to put
your stop limit 5 percent upper than exact price you can enter 5 in front of stop loss
or you want to enter 5 percent lower than exact high price of shoulder, you can optimize it.
ALERTION
you choose what alert you want
IP alert or candle alert or inside and outside bar alert
type your text for alert
you can write additional text for your message
ADVANCE
IP alert frequency option:
1. Once per bar : indicator will alert you for IP pattern once at your chat timeframe bar, and you should wait til next bar for next alert.
2. Once per bar close : alert you when your chart timeframe bar closed and next alert will happen when next bar is closed.
3. All: alert you all the times IP pattern happen
pivot left and right bars: lower will find smaller pattern
at the END:
this indicator is not strategy
it is part of your strategy that help you to increase your winning rate.
It is helpful for scalping and candle patterns finding.
After you make an alert, you can delete the indicator or change your timeframe or make another alert, your previous alert won’t change.
Thank you all.

PT OrderBlockVersion 1.0 of the PT OrderBlock indicator was developed to visually identify supply & demand zones within price. This indicator can be used on all timeframes. My preferred method is swing trading the higher timeframe.
Orderblocks are formed when there is a break in structure once a big buy/sell candle has formed. These "blocks" will eventually get revisited on a retest acting as major support/resistance. An orderblock for a demand zone is populated on the chart when there is a bearish candle before a swift move to the top side (opposite direction). The same goes for the orderblock that is formed for a supply zone, it is the last bullish candle before a swift move to the downside. Once you see such behavior, the indicator will populate the orderblock for you. When an orderblock gets mitigated (tapped into) the indicator will change colors of the block to allow you to distinguish between a fresh and already taped supply/demand zone. It has been proven effective to enter entries based on retests of the orderblocks which take place AFTER a break in market structure.
*PT OB Features:
-OBs that have been partially filled will remove a portion of the background zone to indicate how much of the orderblock is left to fill in the full zone (Toggle Highlight remaining OB).
-OB trigger can be switched between candle open & wick. I prefer wick because it increases the probability of catching a low/high.
Video with strategy will be uploaded shortly! It is included as part of the library. Just message us for access!
