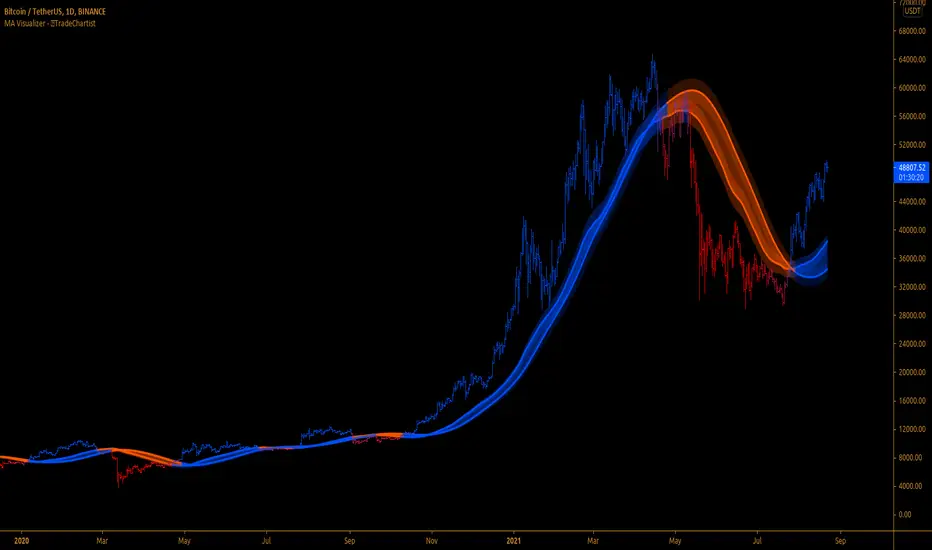
MA Visualizer™TradeChartist MA Visualizer is a Moving Average based indicator aimed to visualize price action in relation to the Moving Average in a visually engaging way.
===================================================================================================================
█ MA Visualizer Features
11 different Moving Averages to choose from the settings to visualize based on MA Visualizer Length (Default - 55 period SMA).
2 Smoothing options (default - 0, 0 uses MA length as Smoothing factor, 1 uses no Smoothing).
4 colour themes to choose from and option to adjust Visualizer Vibrance.
█ Example Charts
1. 1hr chart of OANDA:XAUUSD using 55 period WMA.
2. 15m chart of OANDA:EURUSD using 144 period Tillson T3 MA.
3. 4 hr chart of OANDA:US30USD using 55 period SMMA.
===================================================================================================================
Best Practice: Test with different settings first using Paper Trades before trading with real money
===================================================================================================================
Priceaction
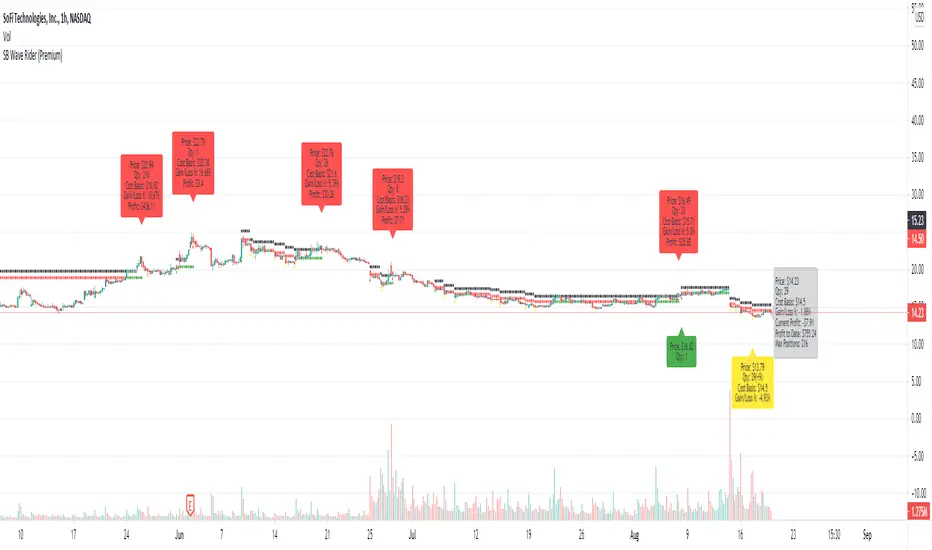
SB Wave Rider PremiumBased on the public version of the script with additional options.
This script seeks to buy the top, and increase its speed (position) on its ride to the bottom of the wave. Once it hits bottom, the surfer is able to bottom turn and make its way back up the wave. At the top it will deleverage and exit its positions starting the cycle over again.
In this version you can add existing positions and the script will take over. You set the date to todays date and it will begin making trade recommendations.
This version will also provide you with alerts for the following.
Open a position
Add additional positions
Increase trailing stop
Close out positions
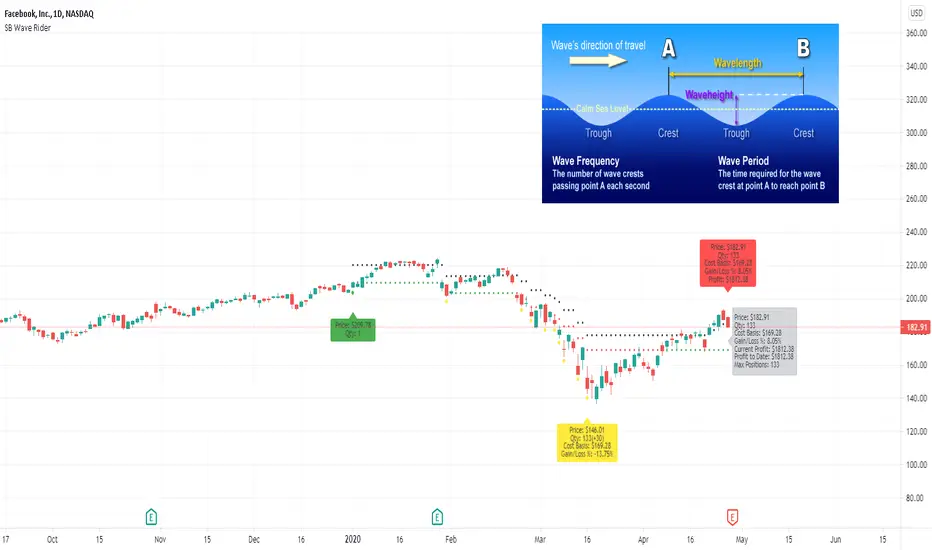
SB Wave Rider (Public)Let me introduce you to my latest indicator, the SB Wave Rider.
I want to briefly describe why this is called the wave rider. Imagine a wave. The top of the wave (crest) can be viewed as the highest point of the wave. The bottom of the wave is considered the trough. The wave height can be measured as the distance from the top of the crest to the bottom of the trough. We ride the wave from the top, all the way down, then all the way back up to the top, where we secure our profit and deleverage our positions. Then we paddle back out and start the process all over again.
Now that you have the analogy to work with, I want to tell you how/why this works.
It sounds completely wrong to be trying to buy the top, but I will try to convince you here why you should be buying tops.
Have you ever bought a stock thinking you were buying the bottom? Have you been disappointed that it wasn't the bottom and it dipped even further? Did you buy in with too much leverage because you were so convinced it couldn't possibly go lower.
What if you flipped that on its head and you were convinced, absolutely convinced you were buying the top, the very top. Like the 52 week high and you were sure it was going to crash lower the next day. All indicators said the stock was overbought, it had an 14 period RSI of 80, MACD was turning bearish, you were 2 standard deviations above the upper Bollinger Band. Its trading way above its vwap. Now lets say someone had a gun to your head. They told you that you had to make a purchase, but they left the amount you had to purchase up to you. How much would you buy just to meet this lunatics demands? Well I would probably say I would buy a single share.
When you purchase a stock, there is no way to tell at the moment of purchase if you are buying a top, a bottom, or somewhere in between. If it were that easy we would all be rich. The biggest part of the equation that most people forget is not when you enter or exit a position, its how you manage it. A skilled wave rider will be able to drop into a massive wave, ride it to the bottom, get pitted in the barrel, get spit out, do a massive bottom turn and ride it back to the top exiting the wave with a perfect 10.
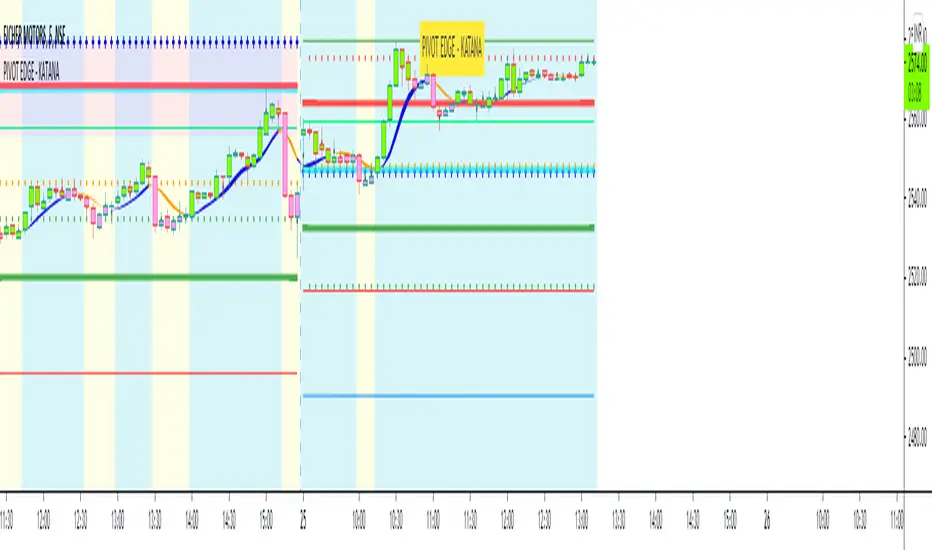
PIVOT EDGE - KATANAIntroduction to the Indicator " PIVOT EDGE - KATANA " . Katana means the sword in Japanese that the legendary samurai warriors used which was sharp , swift and strong to take on any opponent and gave an edge to win. This Indicator also has some of the unique features and hence it is aptly named so.
The Foundation layout for this indicator is based on PIVOT's which are nothing but the most important levels that the price has respected in the past. The values for the pivots are derived from the key attributes of the price in any timeframe such as the OPEN, HIGH, LOW and CLOSE. These define the mood of the price and where it intends to move in relation to the previous range formed. Earlier HIGH - LOW i.e the RANGE indicates the possible movement that a stock can make in the current session and as per the calculated pivots we can possible find out the tentative supports and resistances. In addition to this indicator, It is advisable to use the price action theory which helps in taking a right decision for entries.
This indicator by itself is complete in nature, i.e it guides the user for possible entry levels and the projected targets that we can achieve and also the likely stop loss limit in case the price reverses. So beforehand even before entering into a trade position, the user can ascertain what can be his loss or max profit and then he can chose an optimum position size for favorable results.
The beauty of this Indicator lies in the fact that it can be used for all types of trading like Scalping, Intra day, Swing or Positional and Investments also. It works on all timeframes and across all market segments like EQUITY, COMMODITIES , FUTURES , OPTIONS , FOREX etc.
This indicator can be used for any exchange and any time zone also without any changes or adjustments needed.
Now let us understand the features of this Indicator in detail.
TIMEFRAME - It has options to choose between Day, week and month as timeframe. By default it is set to Day timeframe
DISPLAY MAJOR LEVELS - These are the important support and resistance levels calculated based on the past price data. Most important ones are marked in BOLD RED and BOLD GREEN between which the price tends to move generally.
Apart from these, We have breakout level marked in light green and if price breaks this level we can expect targets upto extended levels and beyond marked in blue.
we also have breakdown level marked in light red and if price breaks this level we can expect targets down up to extended levels and below it marked in blue.
DISPLAY HIDDEN LEVELS - These levels are intermediate supports and resistances that can be used whenever the present day indicated range is very wide. Whenever we have an explosive moments in market the range of that day is very huge and so he next day support and resistance band becomes very wide indicating the sideways movement day within that range. And on those days we can switch on the hidden levels and the price respects these levels and most of the days it is inside this range only.
DISPLAY PREVIOUS HIGH / LOW / CLOSE - I have included Daily / Weekly levels. It is important to know the earlier highs / lows and close since price respects it very must just like support and resistance .
MID OF PEMA - This is an important EMA based indicator which potentially indicates curves of support and resistance during retracements or pullbacks. If the curve is breached then the trend is reversed and the price will tend to move to the next pivots . You can use this as trailing stop loss.
CPR - Central Pivot range, An Important tool for the CPR purists. I am using this particular CPR , TC , BC Band as a colored band indicating whether it is ascending or descending bias. The Band color is GREEB when the CPR is ascending up compared to yesterday and RED when is descending. By the width and narrowness of CPR you can ascertain the trading range and this information is available right after the market close so that you can plan your trades for tomorrow.
SENTIMETER LINE - Gives you a glimpse of the market sentiment at the pre open. Based on this you can know if there is a shift in the sentiment of Buyers / sellers and if price is accepted or rejected. This level acts as an important support / resistance level.
VWAP - Volume weighted average price , One of the widely used and maybe the only Indicator used on charts by most pro traders and big institutions. It gives you an Idea of the volumes that are getting traded in huge quantity and will act as a magnet attracting and also repelling price.
CANDLE MID POINT - This is small feature that's is very important but gets ignored because of lack of knowledge or awareness by traders. Most of the times the mid of the explosive or momentum candles becomes the last line of defense for Buyers / sellers and you can see the battle happening exactly at this point.
THE TURNING POINT - As the name suggests, most of the times price gets turned away from this because lot of fresh and unfilled orders are waiting to be executed at this level. So it becomes an important profit booking or fresh entry level
SCALPERS MAGIC CURVE - This is a high speed curve which has zero lag and very dynamic in nature which reacts quickly to the change in price. Go long when it is trending up and Blue in color, close trade when it turns orange and makes a U turn and vice versa. Most suited for scalpers who trade in 2 to 5 mins time frame. When you want to use this, switch off all other below parameters.
SMART RIBBON - The best and the new unique feature of this curve. As compared my other previous Indicators which had PEMA curve as the base for trend Identification, Here i am introducing this ribbon concept which is much faster reacting to the change in trend and gives you very early entry and also early exits so that you can get the maximum gains from the trend. In a way you can catch the fall right from the start till the end and exit at the end of the trend. Blue for uptrend and Orange for Downtrend.
MARKET BIAS INDICATOR - Again one more unique feature introduced in this Indicator. This feature will paint the chart background in Light blue for BUY ZONE And light yellow for SELL ZONE. You can look to BUY or SELL based on the background color and hence it prevents you from entering trade in wrong or opposite direction. You can avoid trade when there is too much crisscross of colors indicating sideways or range bound market.
BUY SELL TRIGGERS - This features is built on smart logic based on price action / Candle patterns / pivots and my trading experience. It colors the candle bars into LIME GREEN / PINK whenever Buying / Selling opportunities are seen. This is also paired with the alert system which can be used to set automatic sound and desktop notifications. Based on the type of account you hold in trading view you can set alerts for upto 400 stocks.
SMART CANDLE COLORING - If you don't want to do the work of finding the trend and looking for right entry location and exit levels, then you can simply use this feature which makes trading look so simple and easy. This is like an AUTO PILOT mode or CRUISE mode where it colors the candles in only BUY ZONE color ( LIME GREEN ) or SELL ZONE color ( PINK ). Take entry above the high of the first candle and be in the trade as long as you see the opposite color. When you want to use this feature, switch off the BUY SELL TRIGGER.
It is advised that you first learn how this indicator works by back testing historical data and also forward testing in live market by way of paper trading before you deploy real money.
IMPORTANT NOTE : This indicator does not guarantee any favorable results nor protect your from any loss. You own the complete risk of your trades. It is suggested that you use this indicator and do back testing for considerable period to understand how it works the the potential win rate it can give. If you have any doubts or need any clarifications of assistance in understanding, you can message me and I will try to help.
Happy and Safe trading - Mohan from PIVOT EDGE
Contact for getting access to this Indicator. Send a personal message on trading view or on my whatsapp no 9353160775
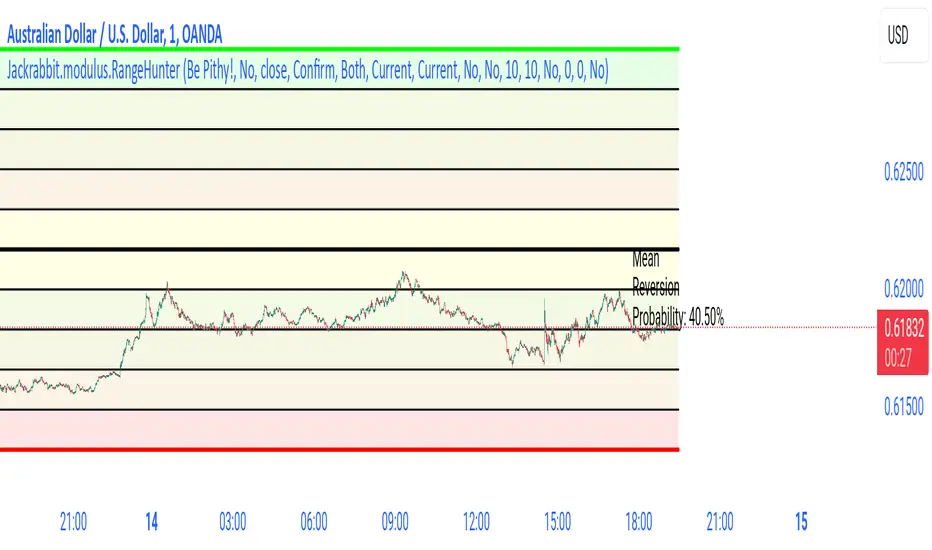
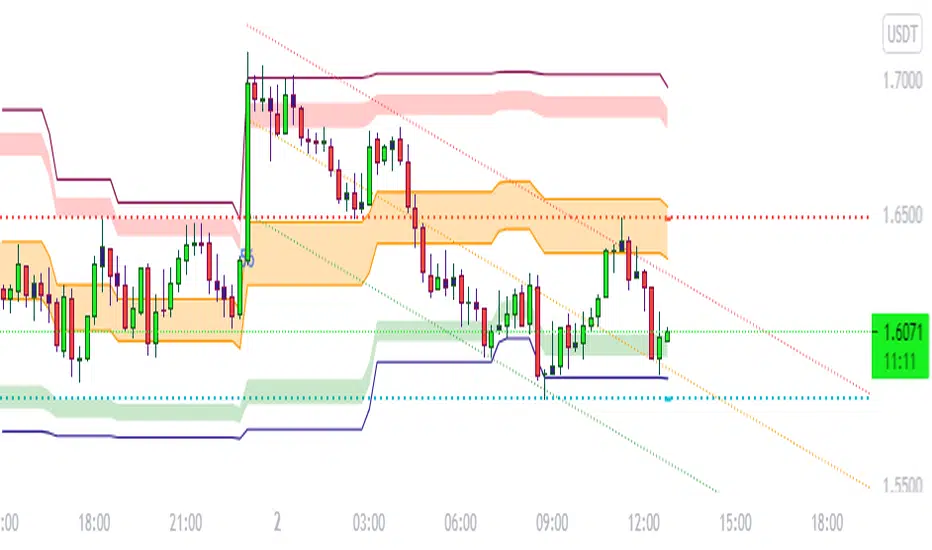
Jackrabbit.modulus.RangeHunterRange Hunter is a unique module that offers a wide range of trading potentials and paradigms for the Jackrabbit suite.
Range Hunter works by finding the highest boundary and the lowest boundary of a time frame. From there, it creates a median by which the market should fluctuate as signs of its health. When the price stays in the upper/lower ranges for too long, the market is considered "unhealthy". Price action should cycle around the median routinele for a healthy market.
From the upper range to the lower range is divided into 10% segments.
There are five segments above the median where price action is considered over valued or oversold.
There are five segments below the median where price action is considered undervalued or oversold.
Buying and selling is divided into 10 boundaries. The 10th boundary for purchasing starts at the lowest range and goes downwards as price climbs. The 10th boundary for selling is where the price is the highest range and goes downwards as price drops.
Buys take place when price action drops bwelow and the climbs above the desire boundary. Sells behave the exact opposite.
The user can configure the boundary that buying and selling takes place independently and supports all elements/settings of the Jackrabbit modulus framework except confirmation bias. If confirmation bias is desired then this module needs to be loaded twice.
The Jackrabbit modulus framework is a plug in play paradigm built to operate through TradingView's indicator on indicatior (IoI) functionality. As such, this script receives a signal line from the previous script in the IoI chain, and evaluates the buy/sell signals appropriate to the current analysis.
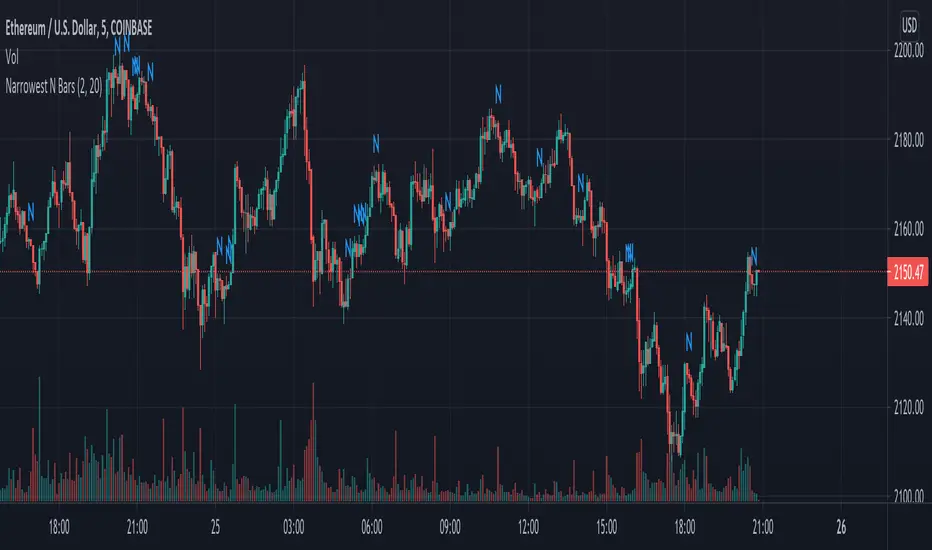
Narrowest N BarsThe indicator is inspired by Toby Crabel's work.
Originally 2-Bar NR pattern is defined as the narrowest range from high to low of any two day period relative to any two day period within the previous 20 market days.
However, this script allows user to look for N Bar narrowest range within user defined numbers of previous days
Settings are as follows:
1. N Bars - sets number of bars in range
2. Lookback period is self-descriptive)
The last bar in the narrowest range is marked with N
Bob Volman Price Action StrategyPrice action trading strategy combined with 21 period moving average.
Use the 21 period moving average and filter along with price action to identify the main trend then look for pullback signals that match the filter to enter.
The stops, entry points and trends are depicted on the chart.
Example using 100 contract size with crude oil, slippage is 3 and commission per order is 3$ with actual capital of 10000$, you can adjust other contract size for other pairs to consistent with reality.

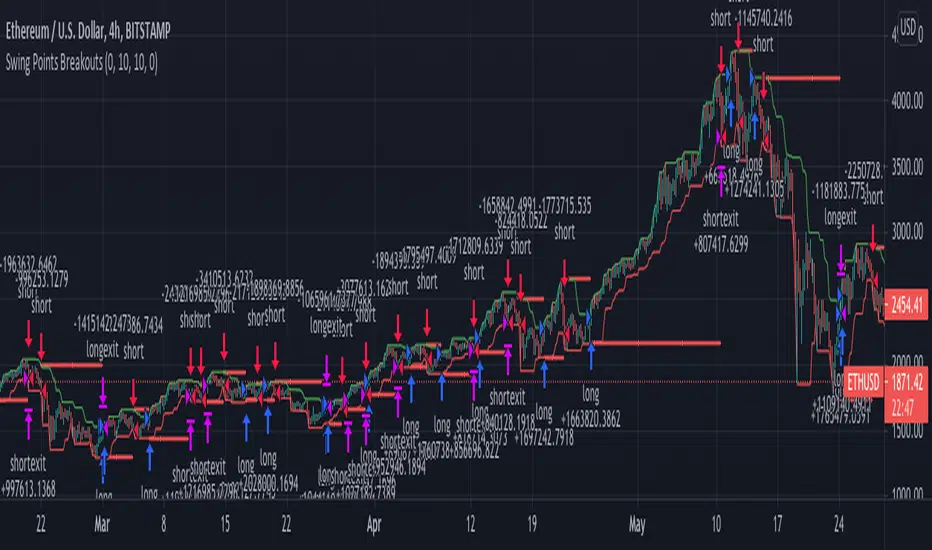
Swing Points BreakoutsLong term strategy for managing a Crypto investment with Swing Trades of more than 1 day. The strategy buys with a
stop order at the Swing High price (green line) and sells with a stop order at the Swing Low price (red line).
The direction of the strategy can be adjusted in the Inputs panel.
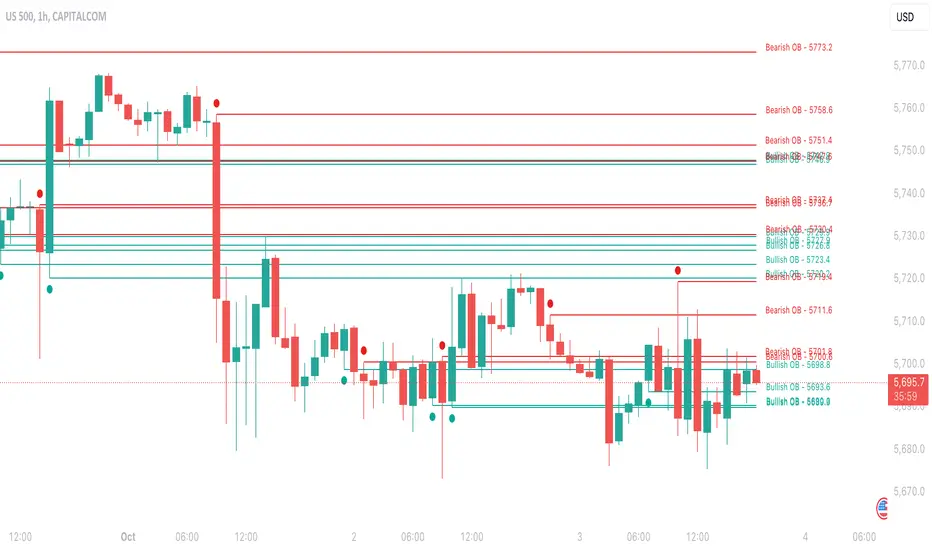
Institutional OrderBlock Pressure█ OVERVIEW
OrderBlocks are areas where Banks take a Short or Long position. So they create a movement that they would like to hide from us, but luckily for us they cannot. Take the example of Banks opening Short position for x reason. The Trend is already Bearish. The Price will fall and then make a Reversal
(most often to the price where they opened their positions) and it is at this precise moment that they will again resume a Short position twice as
large because for the moment, following this example it is not in their interest that the Price exceeds a certain Price since they are Seller.
As a result they create a solid Resistance (the strongest it is). There are several ways to interpret this logic, we can try to follow the movement of Banks
or on the contrary take advantage of the recovery of the course. Note that not having level 2 and access to the order book from TradingView we can only
make a rough estimate of the "OrderBlocks" through VPOC.
█ HOW TO INTERPRET?
• The Labels displayed by "Red Arrow" and "Green Arrow" represent supposed Bearish or Bullish OrderBlock. Note that you should not in any way interpret these "Arrows" as Signals to Buy or Sell for the reasons mentioned above.
• The OB Line works according to detected OrderBlock Candle. These lines indicate the potential recovery area. (The highlighted lines and candles are white by default).
• It is better to use this indicator on Higher TimeFrame like 2H or 4H.
• You can change the Volume Ratio (here VPOC) which is 89 by default.
• There is a Customization section that allows you to change the colors of the Lines and Candles from White to Black depending on your background color (Light or Dark).
• YES the indicator is Repainting and YES you can have False Alerts since Labels appear in intra-bar!
█ ALERTS
• In fact we don't really need Alerts for the logic of this indicator except maybe to get the Price of the last OB Detected and to keep this price in your Alert History and may use it later. Some improvements will come in future with updates and we have already planned to add Alerts when a "Line Cross" gone occur.
If you notice any bugs or if you have any suggestions, don't be hateful gangs ;)
Happy trading everyone and remember, risk management is the most important!
Privious Day and Week ValuesThis indicator is designed for price action. It divides the price range in to four zones based on last week values. Besides, it shows yesterday highest and lowest values. The price usually shows reactions to the drawn horizontal lines!
BULLSEYE BORDERS (Combined Price Action Follower)Developed for Crypto Currency Market! Use for 15 minutes period or more! Under 15 minutes, results are unpredictible.
This script had been orginized with Donchian Lines based on support and resistance levels.
Rules:
If the price is under top line, you will be ready for short position, and over the bottom line, long position.
When the price passes the red and green area you can take action and enter the trade!
Orange area refers the squeezed or floating position, so you can either stop or wait for price action!
If you see boring candles frequently, check out the last high and low levels.
If the price close to the last high, take long position. If not, short position.
Use ALMA , if you want to put and alert on script. It is identical to price line.
Thanks to @millerrh for 'Breakout Trend Follower'. Just used the last low and high features to complete the script. Combined with 'Boring Candles' from ©Prasad Raut, Modified on 20190811 (Updated to %30 full candle)
Trend Tip: You can use the script with Linear Channel so you can also see the trend. (not always)
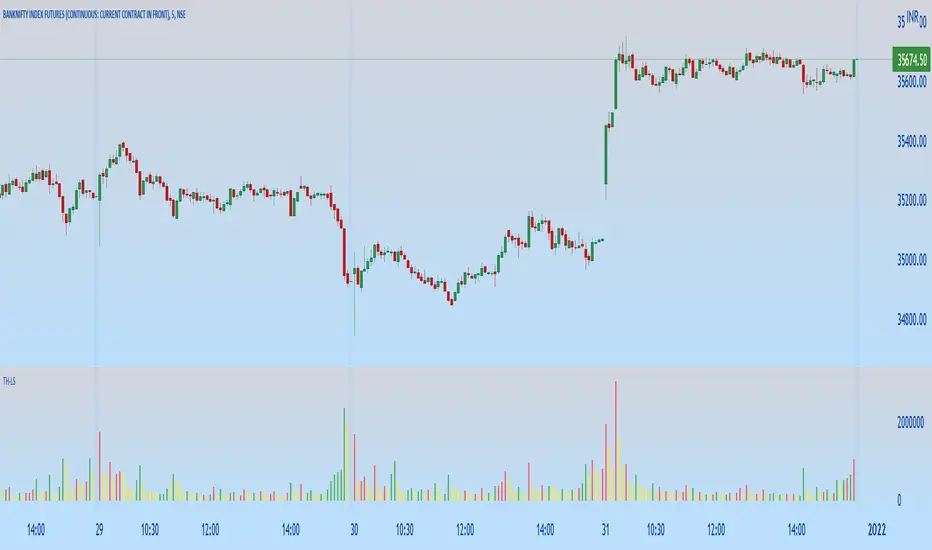
TH-Long & ShortThis indicator will help in identifying the reference candles for taking entry into the trade.
These reference candles are been named as LONG & SHORT Candles for easy understanding.
LONG Volume Candles - are reference candle for taking long positions.
SHORT Volume Candles - are reference candle for taking short positions.
Color Coding of Volume Candles:
LONG CANDLES - GREEN
SHORT CANDLES - RED
NEUTRAL CANDLES - YELLOW
LOGIC behind this implementation:
LONG candle:
In order to take long position we need to identify the price level, wherein we can anticipate the price is likely to get reversed along with increase in volume w.r.t previous candle.
Once this identified candle high price is taken out by any consecutive candles on closing basis, we get more confirmation of possible bullish price reversal. Hence the indicator tries to mark those volume candles as LONG candles (Green) where in the volume has increased from the previous candle along with the price increase on upper side.
SHORT candle:
In order to take short position we need to identify the price level, wherein we can anticipate the price is likely to get reversed along with increase in volume w.r.t previous candle.
Once this identified candle low price is taken out by any consecutive candles on closing basis, we get more confirmation of possible bearish price reversal. Hence the indicator tries to mark those volume candles as SHORT candles (Red) where in the volume has increased from the previous candle along with the price decrease on lower side.
NEUTRAL candle:
The price are trading in a range with no significant change in volumes too, these candles can be ignored as possible triggers for position entry. The indicator marks these volume candle as NEUTRAL candles (Yellow) which can be ignored.
HOW TO USE THIS INDICATOR:
First & more most this is not a buy/sell kind of indicator. As explained earlier, they help in identifying the possible price reversals.
We need to first identify your supply and demand zones and then use these signals as an extra confirmation for taking positions.
LONG Positions:
Wait for possible green volume candle formation, once formed mark the high of the corresponding price candle. On breach of that price on closing basis by any consecutive candle, we can look for possible long position.
SHORT Positions:
Wait for possible red volume candle formation, once formed mark the low of the corresponding price candle. On breach of that price on closing basis by any consecutive candle, we can look for possible Short position.
Friends,do use the indicator and give your valuable feedback.
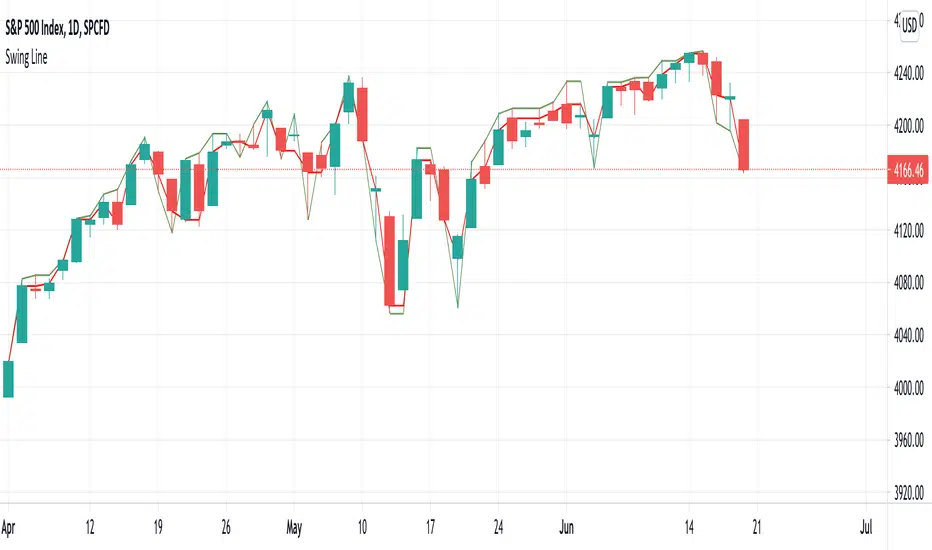
Swing LineThe author was inspired by Charles Dow's concept on trend and Gann's concept on swing trade.
Swing line can help identify resistance and support. Breaking resistance indicate an uptrend. Breaking support indicates a downtrend. This is a simple and intuitive method in trend determination.
However, many chart readers nowadays set Candlestick as preferred pattern. The shared indicator provides another choice for constructing swing lines.
Volatility OscillatorThis tool displays relative volatility and directional trend. Excellent way to pickup diversions and reversals. Length can be lowered to 11 or 13 in settings to show price range.
Can be used to identify patterns such as parallel channels and likely direction of price action as pictured below.

Volatility - Sacred GeometryThis indicator is designed to pick up changes in volatility before it happens. It also shows current volatility, as price action drops the blue lines contract. The script uses the blue lines to locate spikes in volatility.
Example of dump revealing itself with plenty of notice.
Here large changes in price action are shown when the white lines spike. Traders can get a heads up on any pump or dump a few candles before it happens.
This example shows a low volatility channel vs high volatility channel. The blue lines expand as price range increases.
Trends can be discovered by studying the patterns.
* This indicator does not use sacred geometry, I just called it that because it looks like it. *
If anyone is interested in developing this indicator any further please get in contact.

Shadow BusterScript that detech when the shadow is higher than the body.
Should be 3x higher for be detected. (personal preference)

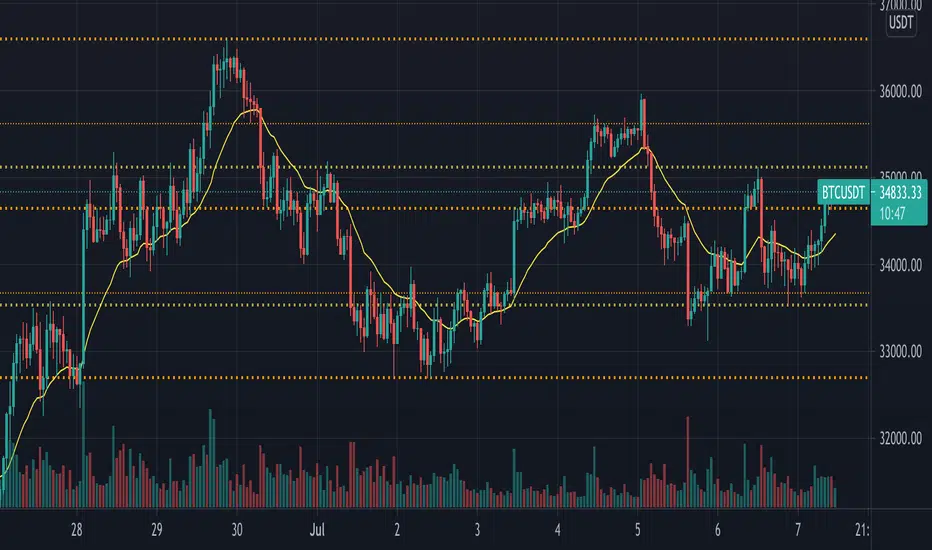
Quantum Dynamic Accumulation and DistributionIf you’ve been trading for any time, you will almost certainly have come across the concept of support and resistance. This powerful and simple concept lies at the heart of technical analysis. It forms the cornerstone of price action trading.
However, you can also think of support and resistance in another way. After all, these are also price areas where a market has paused, reversed, or moved into a congestion phase before moving on. As a result, these price regions are associated with sustained buying and selling, or what Wyckoff called Accumulation and Distribution. These two concepts go hand in hand, and you can think of these in simple terms as follows:
- Accumulation relates to how an area of support performs
- Distribution relates to how an area of resistance performs
It is these two powerful concepts which come together in the Quantum Accumulation and Distribution indicator. It is the act of accumulation (buying) over a sustained period which creates the support region, whilst the act of distribution (selling) over a sustained period creates the resistance region. Having the power to see both, gives you unparalleled insights into price behaviour at these key levels, and the confidence to forecast future market behaviour as a result.
Most traders still draw their lines manually, leading to a crude interpretation of these key levels. Even those companies who have developed a trading indicator, have developed an equally imprecise tool. No doubt you’ve seen them. Generally, these appear as wide bands on the chart, indicating vague areas of congestion, with associated support and resistance bands. These are virtually useless. They lack precision, or definition.
So, why has no one ever considered accumulation and distribution and the associated support and resistance as dynamic? After all, wouldn’t a dynamic indicator deliver high quality information where you need it most – at the live edge of the market?
Well perhaps no one has ever thought about it in this way before. After all, price action is dynamic.
Well, that’s what we thought too, and here it is at last – the Quantum Dynamic Accumulation and Distribution indicator. The first, and only dynamic indicator in the world which displays two things simultaneously. The regions of accumulation and distribution, and from that, the associated price levels of support and resistance. Even more so, it also displays the strength of these regions, the number of times they have been tested, and from which direction. This translates into a visual picture of the accumulation and distribution zones.
Finally, on your TradingView platform, you will have an indicator that truly defines, with pinpoint accuracy, those areas of price support and resistance associated with accumulation and distribution which are so important to you as a trader.
It’s an immensely powerful indicator which maps out the direction of price at any given moment. For most traders, the profit that springs from trading, comes from determining these levels precisely. This indicator will give you the confidence to forecast where the market is likely to move next, giving you the ability to gauge:
- Optimum entry levels
- Safe exit levels
- Proper stop loss levels
- Excellent take profit levels
But as with all Quantum Trading indicators, there’s more, a great deal more!
The indicator shows you both graphically and numerically, how many times the price region has been tested. Levels which have been tested several times, will appear as deeper lines, whilst those levels tested only once or twice will appear as narrower lines. This instantly reveals the depth of any accumulation or distribution regions, and hence the likelihood of the level holding or being breached. Each level is painted blue or red to show you whether that level has seen accumulation or distribution in the past. If the level is painted red, then this has been an area of price distribution, and if painted blue then this is accumulation. An area of price accumulation is likely to act as support if approached from above, and if breached from below, to then provide bullish support to a further move higher. Conversely, an area of price distribution is likely to act as resistance if approached from below, and if breached from above, to then provide bearish resistance to a further move lower. The indicator is dynamic, which means the support and resistance lines generated coincide with the current price action.
Every market behaves slightly differently. They each have their own price characteristics which are then reflected in the price action, which in turn is reflected in the dynamic accumulation and distribution levels. So, once again, we have included your own fine control. Using the custom option, you can increase or decrease the number of zones that appear on each chart, to suit your own trading style and approach. Some traders prefer more detail, others prefer less. The indicator caters for everyone. It’s a personal choice. It simply means you have full control to customise the indicator the way you want it. Matching the tool to the job means greater consistency and greater profitability.

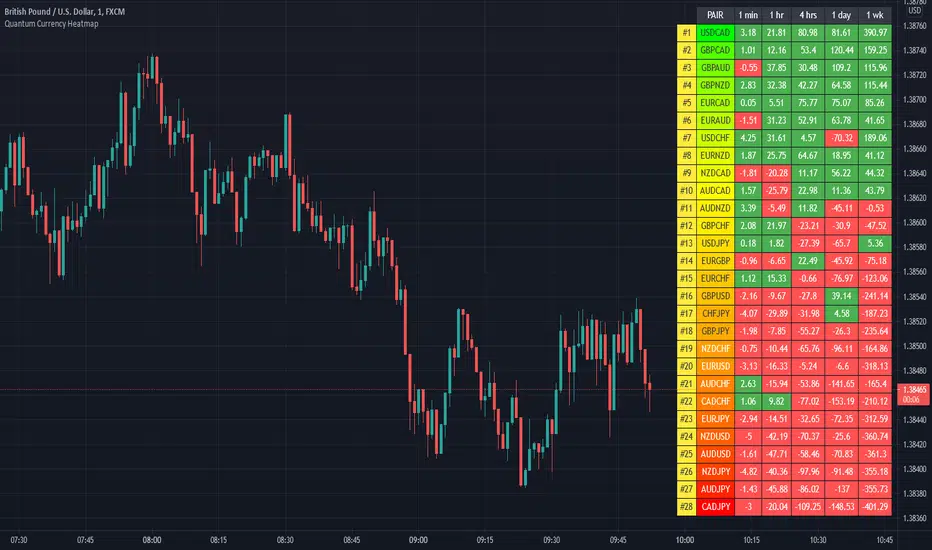
Quantum Currency HeatmapTrading the currency markets is a complex business. With so many pairs and multiple timeframes it is almost impossible to monitor them all – but with the Currency Heatmap you can. The Currency Heatmap indicator delivers the information you need to base your trading decisions on the entire spectrum of currency pairs derived from the 8 major currencies: namely the US dollar, the Euro, the British Pound, the Swiss Franc, the Japanese Yen, the Canadian Dollar, the Australian Dollar and finally the New Zealand Dollar. In one clear and simple table, you can see instantly the entire weight of market sentiment across all 28 pairs and across all timeframes. A global view of risk and sentiment on one chart.
It instantly displays the “hottest” and “coldest” areas of the financial landscape. Vertically, 28 currency pairs are listed and ranked from the most bullish (top) to the most bearish pair (bottom) and reflect the data ranking on the associated currency matrix indicator. And this is where it gets interesting: horizontally, the performance scores of each currency pair are displayed in 5 customizable timeframes.
Interpreting the colors
Each cell of the Currency Heatmap indicator is color coded making it possible to interpret it instantly with just a glance, much like looking at a sophisticated thermal imagery scanner, but for Forex. If you check out the indicator, you will see how easy and intuitive it is, but let us just expand on them here.
If we start with the performance scores. This is the value the indicator assigns to each currency pair representing how positively or negatively its price moved over a certain period. If you have the Currency Matrix indicator, you will also notice that the figures are the same. This is because both use the same algorithm in calculating the performance scores. The cells can be any of the two colors depending on the performance score. This is the color coding used when viewing the currency pairs ACROSS the 5 timeframes or what we like to call the time horizon:
- Green – if the currency pair’s performance score for the aligned timeframe is POSITIVE.
- Red – if the currency pair’s performance score for the aligned timeframe is NEGATIVE.
However, the pairs are then ranked VERTICALLY using a dynamic graded color code transitioning from green, to yellow and to red in that order. The performance scores of the currency pairs in 5 timeframes are added together. The currency pairs are then ranked by their sum from the most positive to the most negative and are color coded as follows:
- Green shades – the sum of the currency pair’s performance scores in 5 timeframes is well above the fulcrum of zero.
- Yellow shades – the sum of the currency pair’s performance scores in 5 timeframes is relatively flat and around the fulcrum of 0. It can either be positive or negative but trails the numbers closest to 0.
- Red shades – the sum of the currency pair’s performance scores in 5 timeframes is well below the fulcrum of zero.
The gradation of color is dynamic and hence the transition of colors will depend entirely on the sum of the currency pair’s performance scores in 5 timeframes as explained above. As with all our other indicators, this is dynamic and is constantly shifting in real time to reflect the ebb and flow of sentiment across the timeframes.
Customizable timeframes
The Currency Heatmap for TradingView allows you to change the timeframe of each of its 5 columns. This can be configured in the indicator settings where you can select 1 of many timeframe options namely:
- 1 min
- 2 min
- 3 min
- 4 min
- 5 min
- 10 min
- 15 min
- 30 min
- 45 min
- 1 hr
- 2 hrs
- 3 hrs
- 4 hrs
- 1 day
- 2 days
- 3 days
- 1 wk
- 1 mo
The 5 default timeframes (from left to right) are listed below:
- Timeframe 1: 1 min
- Timeframe 2: 1 hr
- Timeframe 3: 4 hrs
- Timeframe 4: 1 day
- Timeframe 5: 1 wk
The ranking of the 28 currency pairs changes depending on the timeframes you select for each column. This flexibility allows you to monitor the strength of the pairs within your own range of timeframes in real time.
Weight of the timeframes
One important factor to consider when interpreting the Currency Heatmap indicator and the ranking aspect, is the fact that the performance scores in each timeframe inherently possess weight, and this is reflected in how the indicator has been developed. As you can appreciate, the weight of sentiment in a slower timeframe is greater than that in a faster timeframe. Simply put, the weight of each timeframe is directly proportional to the timeframe itself. Faster timeframes carry less weighting to the overall ranking, whilst slower timeframes carry more. This means currency pairs ranking near or at the bottom of the ladder (bearish) are most likely to have red cells through the slower timeframes or the columns at the right-hand side of the indicator. Similarly, the currency pairs at the top and ranking as bullish or very bullish, again are most likely to have green cells through the slower timeframes.
Stepping back, the changing colors deliver a heatmap reflecting the relative performance of the 28 currency pairs across ALL timeframes in real time. This gives a horizontal analysis of the currency pairs across time. Immensely powerful. And empowering you as a trader to make clear, logical, and fast decisions.
Currency filter
The Currency Heatmap allows you to filter the currency pairs relevant to the currency you are analyzing. An input is provided in the indicator’s settings window which you can click to select a currency.
- USD selects all currency pairs that contain the US Dollar.
- EUR selects all currency pairs that contain the Euro.
- GBP selects all currency pairs that contain the British Pound.
- CHF selects all currency pairs that contain the Swiss Franc.
- JPY selects all currency pairs that contain the Japanese Yen.
- CAD selects all currency pairs that contain the Canadian Dollar.
- AUD selects all currency pairs that contain the Australian Dollar.
- NZD selects all currency pairs that contain the New Zealand Dollar.
Click the Filter option box and select a currency in the list to apply a filter. If you like to undo a filter, simply select NONE. When a certain currency filter is in effect, the currency pairs that include the selected currency in the heatmap appear in color.
Getting started
Here are some further details on the Currency Heatmap indicator to help you get started:
- Your Quantum Currency Heatmap indicator must always be applied in a 1 min chart.
- The indicator occupies its own indicator window in the chart. We recommend expanding the indicator vertically to get a complete view.
- When you first apply the indicator, please allow a few seconds for the data to build in history.
Currency Dashboard
By itself, the Quantum Currency Heatmap indicator is a powerful trading tool for identifying trading opportunities, quickly, easily on a single chart. However, its development is part of a new indicator bundle that we like to call the Quantum Currency Dashboard which consists of the following indicators:
- Quantum Currency Strength Indicator (CSI)
- Quantum Currency Matrix
- Quantum Currency Array
- Quantum Currency Heatmap
These four indicators then provide a unique and compact insight into all the various aspects of strength and weakness for both currencies and currency pairs from trend and momentum to overbought and oversold. What is unique is that using four charts you are then able to monitor the myriad combinations of strength, weakness, momentum, congestion and divergence across the entire forex complex at a click of a button. And even more powerfully giving you the confidence to get in and stay in for maximum profits. No more missed opportunities, no more struggling with multiple charts, and no more trader regret whatever your trading style approach.
Quantum Currency MatrixOf all the four principal capital markets, the world of foreign exchange trading is the most complex and most difficult to master, unless of course you have the right tools! The reason for this complexity is not hard to understand.
First currencies are traded in pairs. Each position is a judgment of the forces driving two independent markets. If the GBP/USD for example is bullish, is this being driven by strength in the pound, or weakness in the US dollar. Imagine if we had to do the same thing trading stocks for example. Consider trading Google against Amazon. If this ‘pair’ were rising, is this being driven by strength in Google or weakness in Amazon? Almost impossible to analyze.
To compound this problem, every currency can be bought or sold against a myriad of other currencies. This raises the next key question. If the GBP/USD is bullish once again, is the British pound strong against all the other major currencies, such as the GBP/JPY, the GBP/CAD, the EUR/GBP etc. If it is, then this is clearly a sign that the UK pound is being bought universally in the market. Equally for the US dollar, if it is sold universally in pairs such as the USD/CAD, the USD/JPY and others, then we can assume that the GBP/USD is rising as a result of strong buying of the pound universally, and strong selling across the market of the US dollar.
Finally, we come to the third problem, which is trying to assess the strength of this buying or selling. After all a currency may be overbought (strong) or oversold (weak) but how strong is strong, and how weak is weak.
Consider this for a moment. Assume you have decided to buy the GBP/USD and have the following information to help you in your analysis:
- Whether the GBP is also being bought in all the other cross currency pairs
- Whether the USD is also being sold in all the other major currency pairs
- The relative strength of buying in the GBP/USD pair
Trading success is all about assessing risk and the probability of success on each trade. Would this information give you a high risk, medium or low risk trading position? And the answer……… is a low risk trading opportunity. After all, you are now taking a position based on a view across the market.
First, if you are basing your decision on universal buying or selling of a currency, then you are trading with the entire weight of the market, and not just on the analysis of one currency pair – it’s low risk. Second, if you know the relative strength of this buying or selling against all the other currency pairs, then this gives you the complete picture – if its strong, then again – it’s low risk. Third and last, if you know what the counter currency is also doing in terms of strong or weak, then once more if its strong – it’s low risk.
This is where the Quantum Currency Matrix steps in. It provides the solution to all three problems in one elegant indicator. It shows you the complete picture across the market in a simple matrix, which works in all timeframes from 1 minute to 1 month.
From the eight major currencies come the 28 currency pairs which are then displayed in a table, with their relative strength scores, updated second by second and minute by minute. As you can see, the Currency Matrix displays the complete spectrum of currency pair strength, from very bullish at the top of the matrix and bright green, to heavily bearish at the bottom of the matrix, and bright red. Those currency pairs moving up or down the ladder from bullish to bearish or bearish to bullish are then shaded in the transitional colors of orange, and yellow to light green.
Every pair is displayed with a ranking score. Above 0.00 indicates the pair is moving into a bullish phase, whilst a score below 0.00 indicates bearish momentum is increasing.
Each currency can then be isolated to show the 7 associated pairs and their relative scores. If all the associated pairs are showing similar strength (either bullish or bearish) then this is either a good time to join the move, or alternatively it may be an opportunity to wait for a reversal in trend as the pair becomes overbought or oversold.
The Quantum Currency Matrix gives you the tool to see the complexities of the Forex market in real time across all the related pairs, along with the strength of the buying and selling. Whilst it is possible to do this manually using multiple charts, what a manual matrix will not provide is any measure of the relative strength. The indicator does this for you automatically by considering the price action across all the related currency pairs and then deriving the relative strength scores accordingly. These are the ranking scores which you see displayed on each currency pair and by which they are ranked in the ladder.
Filter
The Currency Matrix indicator allows you to filter the currency pairs relevant to the currency you are analysing. An input is provided in the indicator’s settings window which you can click to select a currency.
- USD selects all currency pairs that contain the US Dollar.
- EUR selects all currency pairs that contain the Euro.
- GBP selects all currency pairs that contain the British Pound.
- CHF selects all currency pairs that contain the Swiss Franc.
- JPY selects all currency pairs that contain the Japanese Yen.
- CAD selects all currency pairs that contain the Canadian Dollar.
- AUD selects all currency pairs that contain the Australian Dollar.
- NZD selects all currency pairs that contain the New Zealand Dollar.
Click the Filter option box and select a currency in the list to apply a filter. If you like to undo a filter, simply select NONE. When a certain currency filter is in effect, the currency pairs that include the selected currency in the matrix appear in color.
Extremes
“How does the strongest and weakest currency pairs in the matrix compare to the past strongest and weakest currency pairs within the period?”
This is the question that the “All time HIGH”, “Average HIGH”, “All time LOW”, and “Average LOW” numbers answer. These pieces of information are found beside the top-most and bottom-most currency pair in the matrix.
The following numbers are found at the right side of the top-most currency pair in the matrix:
All time HIGH – displays the highest score achieved by a currency pair within the period
Average HIGH – displays the average highest score achieved by a currency pairs within the period
The following numbers are found at the right side of the bottom-most currency pair in the matrix:
All time LOW – displays the lowest score achieved by a currency pair within the period
Average LOW – displays the average lowest score achieved by a currency pair within the period
Currency Dashboard
The Quantum Currency Matrix is a unique indicator. In an instant, you can see which pairs are rising strongly or falling strongly in every timeframe, and on a single chart. Whilst the Quantum Currency Strength Indicator gives you the heads up on individual currency strength and weakness, the Quantum Currency Matrix then delivers the global view for that currency in all the related pairs and for each timeframe – instantly, and giving you the tools to trade every pair with complete confidence.
By itself, the Quantum Currency Matrix indicator is a powerful trading tool for identifying trading opportunities quickly and easily. However, it was developed as part of what we like to call the Quantum Currency Dashboard which consists of the following indicators:
- Quantum Currency Strength Indicator (CSI)
- Quantum Currency Matrix
- Quantum Currency Array
- Quantum Currency Heatmap
These four indicators then provide a unique and compact insight into all the various aspects of strength and weakness for both currencies and currency pairs, from trend and momentum to overbought and oversold. What is unique is that using four charts, you are then able to monitor the myriad combinations of strength, weakness, momentum, congestion and divergence across the entire forex complex at a click of a button. And even more powerfully, giving you the confidence to get in and stay in for maximum profits. No more missed opportunities, no more struggling with multiple charts, and no more trader regret, whatever your trading style or approach.

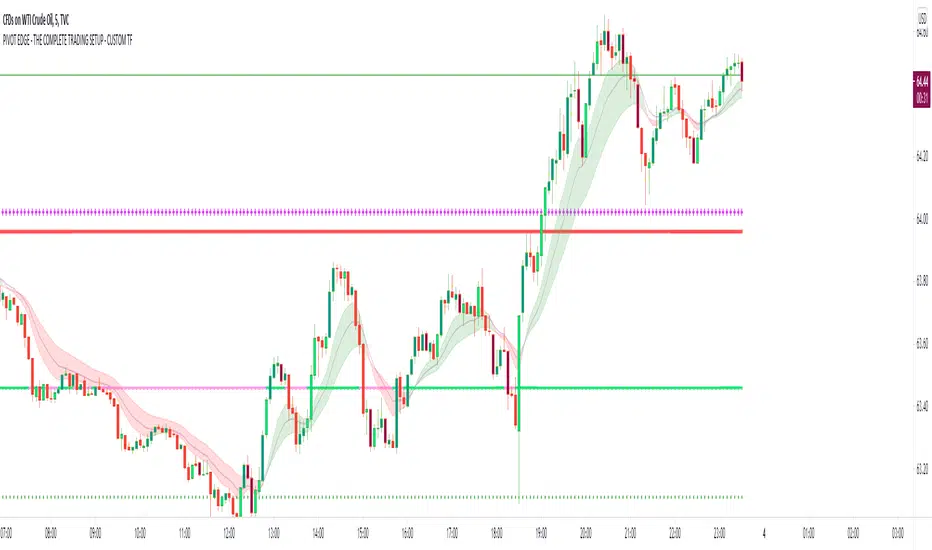
PIVOT EDGE - THE COMPLETE TRADING SETUP - CUSTOM TFIntroduction to the Indicator " PIVOT EDGE - The complete trading setup - CUSTOM TF " It means custom timeframe
The Foundation layout for this indicator is based on PIVOT's which are nothing but the most important levels that the price has respected in the past. The values for the pivots are derived from the key attributes of the price in any timeframe such as the OPEN, HIGH, LOW and CLOSE. These define the mood of the price and where it intends to move in relation to the previous range formed. Earlier HIGH - LOW i.e the RANGE indicates the possible movement that a stock can make in the current session and as per the calculated pivots we can possible find out the tentative supports and resistances. In addition to this indicator, It is advisable to use the price action theory which helps in taking a right decision for entries.
This indicator by itself is complete in nature, i.e it guides the user for possible entry levels and the projected targets that we can achieve and also the likely stop loss limit in case the price reverses. So beforehand even before entering into a trade position, the user can ascertain what can be his loss or max profit and then he can chose an optimum position size for favorable results.
The beauty of this Indicator lies in the fact that it can be used for all types of trading like Scalping, Intra day, Swing or Positional and Investments also. It works on all timeframes and across all market segments like EQUITY, COMMODITIES , FUTURES , OPTIONS , FOREX etc.
This indicator can be used for any exchange and any time zone also without any changes or adjustments needed.
Now let us understand the features of this Indicator in detail.
TIMEFRAME - It has options to choose between Day, week and month as timeframe. By default it is set to Day timeframe
DISPLAY MAJOR LEVELS - These are the important support and resistance levels calculated based on the past price data. Most important ones are marked in BOLD RED and BOLD GREEN between which the price tends to move generally.
Apart from these, We have breakout level marked in light green and if price breaks this level we can expect targets upto extended levels and beyond marked in blue.
we also have breakdown level marked in light red and if price breaks this level we can expect targets down up to extended levels and below it marked in blue.
In addition I have coded intermediate target levels that appear in light gray between the extended levels or blue lines. Sometimes when the gap between these targets are huge, price cannot reach the targets and reverses at these intermediate targets. You can use them as targets or trailing stop loss based on your plan
DISPLAY HIDDEN LEVELS - These levels are intermediate supports and resistances that can be used whenever the present day indicated range is very wide. Whenever we have an explosive moments in market the range of that day is very huge and so he next day support and resistance band becomes very wide indicating the sideways movement day within that range. And on those days we can switch on the hidden levels and the price respects these levels and most of the days it is inside this range only.
DISPLAY PREVIOUS HIGH / LOW / CLOSE - I have included Daily / Weekly and monthly levels. It is important to know the earlier highs / lows and close since price respects it very must just like support and resistance .
PEMA - This is an important EMA based indicator which potentially indicates curves of support and resistance during retracements or pullbacks. If the curves are breached then the trend is reversed and the price will tend to move to the next pivots .
IMPORTANT NOTE : This indicator does not guarantee any favorable results nor protect your from any loss. You own the complete risk of your trades. It is suggested that you use this indicator and do back testing for considerable period to understand how it works the the potential win rate it can give. If you have any doubts or need any clarifications of assistance in understanding, you can message me and I will try to help.
Happy and Safe trading - Mohan from PIVOT EDGE
Price/Volume Trend MeterAnother simple indicator from the sweet indicator series, This is a combination of the Volume and Price Trend Meter indicators combined (Links below) into one indicator called PVTM (Price Volume Trend Meter).
PVTM measures the strength of price and volume pressure on a histogram.
The indicator sums up all green candles price and volume and red candles price and volume over a specific period of bars and plots based on Price summed value. The result will look similar to Price Trend Meter with the benefit of trying to filter out more noise.
Use this indicator to identify the increasing asset of price and volume with the green candles (Close is higher than open) and decreasing of price and volume with the red candles (Close is lower than open).
======= Calculation ==========
Bright Green Color Column: Total summed up Price and Volume are higher than 0.
Bright Red Color Column: Total summed up Price and Volume are Lower than 0.
Weak Green Color Column: Conflict between Price and Volume (One positive and one negative) so we continue based on previous color .
Weak Red Color Column: Conflict between Price and Volume (One positive and one negative) so we continue based on previous color.
======= Price/Volume Trend Meter Colors =======
Green: Increasing buying pressure.
Weaker Green: Declining Buying pressure (Possible Sell Reversal).
Red: Increasing selling pressure.
Weaker Red: Declining Selling pressure (Possible Buy Reversal).
Other sweet indicators that this indicator is based on:
Volume Trend Meter:
Price Trend Meter:
Like if you Like and Follow me for upcoming indicators/strategies: www.tradingview.com

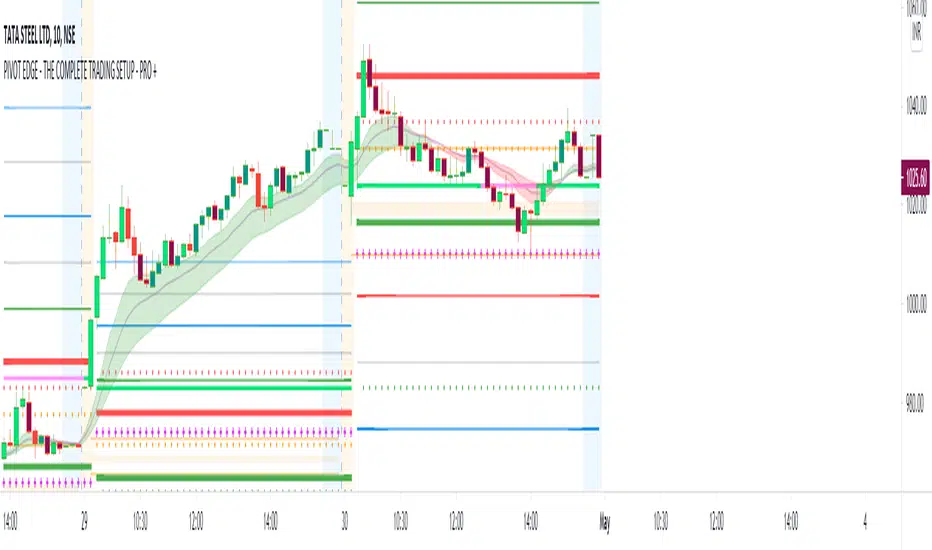
PIVOT EDGE - THE COMPLETE TRADING SETUP - PRO +Introduction to the Indicator " PIVOT EDGE - The complete trading setup - PRO+ "
The Foundation layout for this indicator is based on PIVOT's which are nothing but the most important levels that the price has respected in the past.The values for the pivots are derived from the key attributes of the price in any timeframe such as the OPEN, HIGH, LOW and CLOSE. These define the mood of the price and where it intends to move in relation to the previous range formed.Earlier HIGH - LOW i.e the RANGE indicates the possible movement that a stock can make in the current session and as per the calculated pivots we can possible find out the tentative supports and resistances. In addition to this indicator, It is advisable to use the price action theory which helps in taking a right decision for entries.
This indicator by itself is complete in nature, i.e it guides the user for possible entry levels and the projected targets that we can achieve and also the likely stop loss limit in case the price reverses. So beforehand even before entering into a trade position, the user can ascertain what can be his loss or max profit and then he can chose an optimum position size for favorable results.
The beauty of this Indicator lies in the fact that it can be used for all types of trading like Scalping, Intra day, Swing or Positional and Investments also. It works on all timeframes and across all market segments like EQUITY, COMMODITIES , FUTURES , OPTIONS , FOREX etc.
This indicator can be used for any exchange and any time zone also without any changes or adjustments needed.
Now let us understand the features of this Indicator in detail.
TIMEFRAME - It has options to choose between Day, week and month as timeframe. By default it is set to Day timeframe
DISPLAY MAJOR LEVELS - These are the important support and resistance levels calculated based on the past price data. Most important ones are marked in BOLD RED and BOLD GREEN between which the price tends to move generally.
Apart from these, We have breakout level marked in light green and if price breaks this level we can expect targets upto extended levels and beyond marked in blue.
we also have breakdown level marked in light red and if price breaks this level we can expect targets down up to extended levels and below it marked in blue.
In addition I have coded intermediate target levels that appear in light gray between the extended levels or blue lines. Sometimes when the gap between these targets are huge, price cannot reach the targets and reverses at these intermediate targets. You can use them as targets or trailing stop loss based on your plan
DISPLAY HIDDEN LEVELS - These levels are intermediate supports and resistances that can be used whenever the present day indicated range is very wide. Whenever we have an explosive moments in market the range of that day is very huge and so he next day support and resistance band becomes very wide indicating the sideways movement day within that range. And on those days we can switch on the hidden levels and the price respects these levels and most of the days it is inside this range only.
DISPLAY PREVIOUS HIGH / LOW / CLOSE - I have included Daily / Weekly and monthly levels. It is important to know the earlier highs / lows and close since price respects it very must just like support and resistance .
PEMA - This is an important EMA based indicator which potentially indicates curves of support and resistance during retracements or pullbacks. If the curves are breached then the trend is reversed and the price will tend to move to the next pivots .
VALUE AREA - One of the most important feature of this Indicator is this which is derived from the Volume profile concepts. It indicates the fair value area Indicated by orange band and the upper and lower limits indicated by orange lines. Whenever the price is overvalued or undervalued, it is pushed back to its fair value and we can judge the present price position in relation to the value area and then take position in anticipation of the price reaching its fair value area. This must be coupled with price action for favorable results.
IMPORTANT NOTE : This indicator does not guarantee any favorable results nor protect your from any loss. You own the complete risk of your trades. It is suggested that you use this indicator and do back testing for considerable period to understand how it works the the potential win rate it can give.
If you have any doubts or need any clarifications of assistance in understanding, you can message me and I will try to help.
Happy and Safe trading - Mohan from PIVOT EDGE
Accumulation & Distribution DetectorThis indicator lets us to automatically detect and mark strong and clear Price Action levels in which there were Accumulation and Distribution phases in any timeframe.
This Accumulation and Distribution is associated with a laterality in the market and they are usually important price levels to take into account for either future Price Action trades in Supports and Resistances or in Supply and Demand levels since they are usually turning points in the market.
This indicator, unlike other existing ones, allows us to adjust through the parameters both the level of demand and the size of these candles regarding the ATR and the size of the candle itself. The tighter we are, the fewer candles marked there will be and, therefore, the desired level to trade will be more powerful and stronger.
Note : The order of elements on the chart must be configured so this indicator should be above the candles, otherwise it will not be displayed correctly.
Este indicador nos permite detectar y marcar de forma automática los niveles fuertes y claros de Price Action donde ha habido fases de Acumulación y Distribución en cualquier marco de tiempo.
Esta Acumulación y Distribución se asocia a una lateralidad en el mercado y suelen ser niveles de precio importantes a tener en cuenta para futuras operaciones de Price Action en Soportes y Resistencias o sobre niveles de Oferta y Demanda ya que suelen los puntos de giro en el mercado.
Este indicador, a diferencia de otros existentes, nos permite ajustar mediante los parámetros el nivel de exigencia y tamaño de estas velas con respecto al ATR y el tamaño de la propia vela. Mientras más estrictos seamos, menos velas marcadas habrá y más potente y fuerte será el nivel deseado para operar.
Nota : Se debe configurar el orden de elementos en el gráfico para que el indicador esté por encima de las velas, de lo contrario no se visualiza correctamente.
Parameters Settings / Parámetros Ajustables:
MAX Body size vs Full Candle (%) : Max body vs Full Candle size percentatge required, default 50% / Porcentaje Máximo Permitido para el tamaño del “Cuerpo” sobre el tamaño completo de la propia vela, por defecto 50%
MAX Candle Size vs ATR (%) : Max candle size vs ATR percentage required, default 70% / Porcentaje Máximo admitido para el tamaño total de la vela con respecto al ATR, por defecto 70%
ATR Length : Candles Number to calculate ATR average, default 30 / Cantidad de velas para medir el ATR, por defecto 30
Use ATR filter? : We can activate or deactivate the ATR calculates, default activated / Podemos anular el cálculo sobre el ATR y hacerlo normal, por defecto activado
Color Settings / Colores Ajustables:
Print Char : Char and Color printed in candle / Símbolo y Color que dibuja sobre la vela detectada
