Al Brooks Second Entry**\ Al Brooks Second Entry Indicator\ **
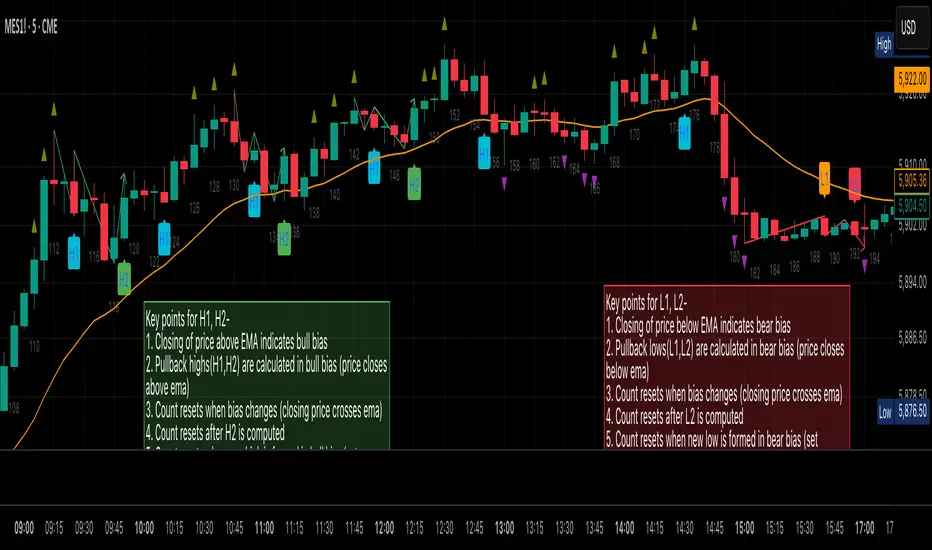
This custom indicator helps identify second-entry setups based on Al Brooks' price action principles. The script marks key levels in trending markets, indicating potential long and short entries. It displays the first and second entry signals (H1, H2, L1, L2) as well as relevant pullback zones for added clarity.
\ Features:\
\
\ \ First Entry Signals\ : H1 (Long) and L1 (Short) are marked when a trend begins to form.
\ \ Second Entry Signals\ : H2 (Long) and L2 (Short) are plotted once the market pulls back and continues in the direction of the trend.
\ \ EMA Filter\ : An Exponential Moving Average (EMA) is included to filter trades in the direction of the trend (longs above EMA, shorts below EMA).
\ \ Pullback Zones\ : Highlighted areas to assist in identifying optimal zones for entry.
\ \ Adjustable Label Sizes\ : Customize the appearance of the entry labels (tiny or small).
\
\ Inputs:\
\
\ \ Show First/Second Entry\ : Control whether the first (H1, L1) and second (H2, L2) entry signals are displayed.
\ \ EMA Length\ : Set the length of the EMA to use for trend direction.
\ \ Label Size\ : Choose between tiny and small label sizes for clear chart visibility.
\ \ Pullback Zones\ : Toggle the highlighting of pullback zones.
\
\ How it Works:\
\
\ The indicator detects a trend direction using price action (new highs/lows, inside/outside bars).
\ Once a trend is identified, it waits for a pullback and marks the first and second entry points (H1, H2, L1, L2).
\ The indicator also plots the EMA to help confirm the overall market bias.
\ Pullback zones are drawn to help spot potential areas of support or resistance.
\
This script is ideal for traders looking to trade retracements in trending markets, providing clear entry signals and a visual representation of market structure.
Pullback
Adaptive Fibonacci Pullback System -FibonacciFluxAdaptive Fibonacci Pullback System (AFPS) - FibonacciFlux
This work is licensed under a Attribution-NonCommercial-ShareAlike 4.0 International (CC BY-NC-SA 4.0). Original concepts by FibonacciFlux.
Abstract
The Adaptive Fibonacci Pullback System (AFPS) presents a sophisticated, institutional-grade algorithmic strategy engineered for high-probability trend pullback entries. Developed by FibonacciFlux, AFPS uniquely integrates a proprietary Multi-Fibonacci Supertrend engine (0.618, 1.618, 2.618 ratios) for harmonic volatility assessment, an Adaptive Moving Average (AMA) Channel providing dynamic market context, and a synergistic Multi-Timeframe (MTF) filter suite (RSI, MACD, Volume). This strategy transcends simple indicator combinations through its strict, multi-stage confluence validation logic. Historical simulations suggest that specific MTF filter configurations can yield exceptional performance metrics, potentially achieving Profit Factors exceeding 2.6 , indicative of institutional-level potential, while maintaining controlled risk under realistic trading parameters (managed equity risk, commission, slippage).
4 hourly MTF filtering
1. Introduction: Elevating Pullback Trading with Adaptive Confluence
Traditional pullback strategies often struggle with noise, false signals, and adapting to changing market dynamics. AFPS addresses these challenges by introducing a novel framework grounded in Fibonacci principles and adaptive logic. Instead of relying on static levels or single confirmations, AFPS seeks high-probability pullback entries within established trends by validating signals through a rigorous confluence of:
Harmonic Volatility Context: Understanding the trend's stability and potential turning points using the unique Multi-Fibonacci Supertrend.
Adaptive Market Structure: Assessing the prevailing trend regime via the AMA Channel.
Multi-Dimensional Confirmation: Filtering signals with lower-timeframe Momentum (RSI), Trend Alignment (MACD), and Market Conviction (Volume) using the MTF suite.
The objective is to achieve superior signal quality and adaptability, moving beyond conventional pullback methodologies.
2. Core Methodology: Synergistic Integration
AFPS's effectiveness stems from the engineered synergy between its core components:
2.1. Multi-Fibonacci Supertrend Engine: Utilizes specific Fibonacci ratios (0.618, 1.618, 2.618) applied to ATR, creating a multi-layered volatility envelope potentially resonant with market harmonics. The averaged and EMA-smoothed result (`smoothed_supertrend`) provides a robust, dynamic trend baseline and context filter.
// Key Components: Multi-Fibonacci Supertrend & Smoothing
average_supertrend = (supertrend1 + supertrend2 + supertrend3) / 3
smoothed_supertrend = ta.ema(average_supertrend, st_smooth_length)
2.2. Adaptive Moving Average (AMA) Channel: Provides dynamic market context. The `ama_midline` serves as a key filter in the entry logic, confirming the broader trend bias relative to adaptive price action. Extended Fibonacci levels derived from the channel width offer potential dynamic S/R zones.
// Key Component: AMA Midline
ama_midline = (ama_high_band + ama_low_band) / 2
2.3. Multi-Timeframe (MTF) Filter Suite: An optional but powerful validation layer (RSI, MACD, Volume) assessed on a lower timeframe. Acts as a **validation cascade** – signals must pass all enabled filters simultaneously.
2.4. High-Confluence Entry Logic: The core innovation. A pullback entry requires a specific sequence and validation:
Price interaction with `average_supertrend` and recovery above/below `smoothed_supertrend`.
Price confirmation relative to the `ama_midline`.
Simultaneous validation by all enabled MTF filters.
// Simplified Long Entry Logic Example (incorporates key elements)
long_entry_condition = enable_long_positions and
(low < average_supertrend and close > smoothed_supertrend) and // Pullback & Recovery
(close > ama_midline and close > ama_midline) and // AMA Confirmation
(rsi_filter_long_ok and macd_filter_long_ok and volume_filter_ok) // MTF Validation
This strict, multi-stage confluence significantly elevates signal quality compared to simpler pullback approaches.
1hourly filtering
3. Realistic Implementation and Performance Potential
AFPS is designed for practical application, incorporating realistic defaults and highlighting performance potential with crucial context:
3.1. Realistic Default Strategy Settings:
The script includes responsible default parameters:
strategy('Adaptive Fibonacci Pullback System - FibonacciFlux', shorttitle = "AFPS", ...,
initial_capital = 10000, // Accessible capital
default_qty_type = strategy.percent_of_equity, // Equity-based risk
default_qty_value = 4, // Default 4% equity risk per initial trade
commission_type = strategy.commission.percent,
commission_value = 0.03, // Realistic commission
slippage = 2, // Realistic slippage
pyramiding = 2 // Limited pyramiding allowed
)
Note: The default 4% risk (`default_qty_value = 4`) requires careful user assessment and adjustment based on individual risk tolerance.
3.2. Historical Performance Insights & Institutional Potential:
Backtesting provides insights into historical behavior under specific conditions (always specify Asset/Timeframe/Dates when sharing results):
Default Performance Example: With defaults, historical tests might show characteristics like Overall PF ~1.38, Max DD ~1.16%, with potential Long/Short performance variance (e.g., Long PF 1.6+, Short PF < 1).
Optimized MTF Filter Performance: Crucially, historical simulations demonstrate that meticulous configuration of the MTF filters (particularly RSI and potentially others depending on market) can significantly enhance performance. Under specific, optimized MTF filter settings combined with appropriate risk management (e.g., 7.5% risk), historical tests have indicated the potential to achieve **Profit Factors exceeding 2.6**, alongside controlled drawdowns (e.g., ~1.32%). This level of performance, if consistently achievable (which requires ongoing adaptation), aligns with metrics often sought in institutional trading environments.
Disclaimer Reminder: These results are strictly historical simulations. Past performance does not guarantee future results. Achieving high performance requires careful parameter tuning, adaptation to changing markets, and robust risk management.
3.3. Emphasizing Risk Management:
Effective use of AFPS mandates active risk management. Utilize the built-in Stop Loss, Take Profit, and Trailing Stop features. The `pyramiding = 2` setting requires particularly diligent oversight. Do not rely solely on default settings.
4. Conclusion: Advancing Trend Pullback Strategies
The Adaptive Fibonacci Pullback System (AFPS) offers a sophisticated, theoretically grounded, and highly adaptable framework for identifying and executing high-probability trend pullback trades. Its unique blend of Fibonacci resonance, adaptive context, and multi-dimensional MTF filtering represents a significant advancement over conventional methods. While requiring thoughtful implementation and risk management, AFPS provides discerning traders with a powerful tool potentially capable of achieving institutional-level performance characteristics under optimized conditions.
Acknowledgments
Developed by FibonacciFlux. Inspired by principles of Fibonacci analysis, adaptive averaging, and multi-timeframe confirmation techniques explored within the trading community.
Disclaimer
Trading involves substantial risk. AFPS is an analytical tool, not a guarantee of profit. Past performance is not indicative of future results. Market conditions change. Users are solely responsible for their decisions and risk management. Thorough testing is essential. Deploy at your own considered risk.

RSI Plus +
Description:
RSI Plus + is an enhanced Relative Strength Index (RSI) indicator that provides a multi-timeframe view of RSI values across various timeframes. It highlights overbought and oversold conditions for a more comprehensive analysis, with additional focus on the Relative RSI (RRSI), which compares the current RSI to the average RSI. This provides insight into relative market strength or weakness, giving traders a clear view of how the current market conditions compare to historical averages. The indicator is ideal for spotting potential market reversals, pullbacks, or trend continuations.
Overview
RSI Plus + offers a multi-timeframe RSI display across the following timeframes:
- 2m (2 minutes)
- 5m (5 minutes)
- 15m(15 minutes)
- 30m (30 minutes)
- 1h (1 hour)
- 4h (4 hours)
- 12h (12 hours)
- Daily (1 Day)
- Weekly (1 Week)
- Monthly (1 Month)
The indicator displays a table with RSI, Average RSI, and Relative RSI (RRSI) values for each selected timeframe. The table is color-coded to indicate overbought (RSI > 70) or oversold (RSI < 30) conditions. Additionally, visual triangle alerts are plotted on the chart to signal potential trade opportunities when all selected timeframes show either overbought or oversold conditions. The RRSI provides insight into the current market’s relative strength or weakness by comparing the current RSI to its historical average.
How to Use
1. Setting Up the Indicator:
- Add RSI Plus + to your TradingView chart.
- Enable or disable timeframes using the checkboxes (e.g., 2m, 5m, 15m, Daily, Weekly, etc.) to customise the timeframes you want to analyse.
2. Understanding the Table Layout:
The indicator displays a table in the top-right corner of the chart with the following columns:
- Row 0 Timeframes (2m, 5m, 15m, 30m, 1h, 4h, 12h, Daily, Weekly, Monthly).
- Row 1 RRSI (Relative RSI: the current RSI compared to the average RSI).
- Row 2 Average RSI (The average RSI for each timeframe).
- Row 3 Current RSI (The current RSI value for each timeframe).
The RRSI (Relative RSI) row compares the current RSI with the average RSI, offering insight into the current relative strength or weakness. This allows traders to gauge whether the market is stronger or weaker compared to its historical performance within the selected timeframe.
3. Interpreting the Relative RSI (RRSI)
- RRSI > 1: If the Relative RSI (RRSI)is greater than 1, it means the current RSI is stronger than its historical average, indicating stronger market strength. This could be a sign of momentum in the direction of the trend.
- RRSI < 1: If the RRSI is below 1, it means the current RSI is weaker than its historical average, signalling relative market weakness. This may indicate the possibility of a reversal or pullback before the trend resumes.
- RRSI ~ 1: When the RRSI is around 1, it indicates that the current RSI is in line with its historical average, suggesting neutral market conditions.
4. Using the Visual Cues (Triangle Shapes):
- Green Triangle: Plotted above the price bars when all selected timeframes show RSI values above 70 (overbought), signalling potential exhaustion and a short signal or a pullback before continuation.
- Red Triangle: Plotted below the price bars when all selected timeframes show RSI values below 30*(oversold), signalling potential market reversal and long signal or a pullback before continuation*
These triangle shapes are clear visual alerts for traders to act upon when all timeframes signal extreme conditions.
5. Overbought/Oversold Conditions as Signals:
Overbought Conditions: If all selected timeframes show RSI values above 70 (green triangles appear), it suggests that the market may be overbought, signalling a potential short trade opportunity or a pullback before continuation.
Oversold Conditions: If all selected timeframes show RSI values below 30 (red triangles appear), it suggests that the market may be oversold, signalling a potential long trade or short term bounce opportunity or a pullback before continuation.
6. Set alerts for when all selected timeframes turn overbought (green triangles) or all turn oversold (red triangles). This alert condition will notify you when all selected timeframes signal extreme market conditions, which could indicate a strong reversal or continuation in price.
Notes:
RRSI provides an additional layer of analysis by showing the current relative strength or weakness of the market. A higher RRSI indicates strength relative to historical performance, while a lower RRSI signals weakness.
RSI Plus + is best used alongside other technical tools to confirm trade setups.
RRSI can help traders determine whether the market is likely to continue its trend or if a correction or reversal is imminent.
Customisable Timeframes: The RSI Plus + indicator is fully customisable, allowing you to select RSI length (RSI Period), which timeframes to analyse, from as short as 2 minutes up to monthly intervals, a personally chosen selection This gives traders the flexibility to tailor the indicator to their preferred trading style and time horizon.

Reversals & PullbacksReversals & Pullbacks:
This indicator tries to predict Price reversals and pullbacks.
It works best on the higher timeframes (H4 and D) and was written for currencies but also shows some decent results on Crypto.
Inputs:
- Confirmation: When activated, the indicator waits to print the bullish/bearish signal untill price shows a clear sign of reversal. When not activated, it only looks if it thinks a pullback or reversal is likely to happen without waiting for confirmation. There will be more (false) signals when disabled
- Sensitivity: When set to 0, there will be more (false) signals printed, and when highering this value there will be less signals. The default value is 5 but you can experiment which value works best on what instrument.
- Arrow Distance: can be used to place the arrows further away from price if needed.

PullBack_Level_HunterThis script creates an "Auto Fibonacci" indicator that automatically plots selected Fibonacci retracement levels on a chart, based on a defined lookback period. Users can choose from various Fibonacci levels (0.236, 0.382, 0.5, 0.618, or 0.786) via a dropdown input, allowing for quick adjustments to analysis.
**Key Features:**
1. **Fibonacci Level Selection:** Users can select from multiple Fibonacci levels (0.236, 0.382, 0.5, 0.618, and 0.786) for analysis.
2. **Lookback Period:** The script allows users to define a lookback period to determine the highest high and the lowest low for plotting Fibonacci levels.
3. **Fibonacci Level Calculation:** The Fibonacci levels are calculated using two functions:
- `fib_level`: Calculates the Fibonacci level based on the highest high and lowest low of the lookback period.
- `fib_level_from_current`: Calculates the Fibonacci level from the current candle’s high.
4. **Plotting:** The script plots the selected Fibonacci level on the chart, using a red line for the general Fibonacci level and a blue line for the level calculated from the current high.
5. **Dynamic Visualization:** The Fibonacci levels are drawn as step lines to clearly visualize price levels based on historical data and current price action.
This tool is ideal for traders who wish to quickly assess key Fibonacci levels for potential support or resistance within a customizable lookback period.

Upside Reversal Screener [LevelUp]The Upside Reversal Screener can be helpful to find strength when stocks have been showing weakness or the overall market is down. An upside reversal in a stock occurs when its price, after declining, changes direction and begins to trend upward. This pattern can signify a shift in market sentiment from bearish to bullish.
🔹 Upside Reversal Characteristics
✓ Price goes below prior day/week low then rallies to close with a gain or a minimal loss.
✓ Closing range in the upper half of the day/week.
✓ Ideally, volume shows an increase over the average daily/weekly volume.
🔹 Configurable Settings
✓ Specify the number of lower lows.
✓ Require the price low to be above a configurable moving average.
✓ Require the moving average to be trending up.
✓ Specify price % change.
✓ Specify closing range.
✓ Limit search to specific symbol types, for example, only stocks and no ETFs.
🔹 Pros of an Upside Reversal
An upside reversal can provide an early entry point into a potential new uptrend. The reversal may attract buyers, resulting in sustained upward price momentum. Reversals that follow a prolonged downtrend suggest the end of bearish dominance, which may give way to a longer-term bullish trend.
🔹 Cons of an Upside Reversal
Not all reversals continue their upward trend; some may turn out to be "dead cat bounces" or a short-term retracement before the downtrend resumes. It can also be challenging to know when to enter a trade on a reversal as entering too early might lead to losses if price reverses and the downtrend continues.
🔹 Risk Management
One common approach to risk management is to use a recent low as a stop. Another potential stop would be an area of prior support or consolidation. It often feels counterintuitive to enter a trade when the trend has been downward. Which speaks to why risk management must always be part of your game plan.
🔹 Installation And Usage
▪ Mark this indicator as a Favorite.
▪ Use the Pine Screener to search for stocks.
▪ Save the search results to a watchlist.
▪ View the watchlist in TradingView.

MFS-3 Bars Pattern Strategy3 Bar Pattern Strategy
Detects an Ignite Candle followed by a Pullback Candle followed by a Confirmation Candle.
A Box will be drawn around the setup and three arrows will identify I, P, C (Ignite, Pullback, Confirmation) the setup.
The strategy will calculate a Stop Loss below the Low Price of the Ignite candle and a Take Profit at 2 times the Stop Loss giving a Risk to Reward Ratio of 1:2.
Extra conditions are included to reduce false triggers:
- A down trend must be detected using 3 SMA (Long, Medium, Short) that should be aligned from Long to Short one above the other.
- The Ignite Candle's body must be BELOW the Short SMA
An input form is available to adjust some strategy parameters.
Performance Note
----------------------
Trading conditions are very strict, so most of the time, no signals will be detected in the Strategy window.
This strategy should only be one of many strategies used for trade setups.
Hope you enjoy it.

Moving Average Pullback Signals [UAlgo]The "Moving Average Pullback Signals " indicator is designed to identify potential trend continuation or reversal points based on moving average (MA) pullback patterns. This tool combines multiple types of moving averages, customized trend validation parameters, and candlestick wick patterns to provide reliable buy and sell signals. By leveraging several advanced MA methods (such as TEMA, DEMA, ZLSMA, and McGinley-D), this script can adapt to different market conditions, providing traders with flexibility and more precise trend-based entries and exits. The addition of a gradient color-coded moving average line and wick validation logic enables traders to visualize market sentiment and trend strength dynamically.
🔶 Key Features
Multiple Moving Average (MA) Calculation Methods: This indicator offers various MA calculation types, including SMA, EMA, DEMA, TEMA, ZLSMA, and McGinley-D, allowing traders to select the MA that best fits their strategy.
Trend Validation and Pattern Recognition: The indicator includes a customizable trend validation length, ensuring that the trend is consistent before buy/sell signals are generated. The "Trend Pattern Mode" setting provides flexibility between "No Trend in Progress," "Trend Continuation," and "Both," tailoring signals to the trader’s preferred style.
Wick Validation Logic: To enhance the accuracy of entries, this indicator identifies specific wick patterns for bullish or bearish pullbacks, which signal potential trend continuation or reversal. Wick length and validation factor are adjustable to suit various market conditions and timeframes.
Gradient Color-coded MA Line: This feature provides a quick visual cue for trend strength, with color changes reflecting relative highs and lows of the MA, enhancing market sentiment interpretation.
Alerts for Buy and Sell Signals: Alerts are triggered when either a bullish or bearish pullback is detected, allowing traders to receive instant notifications without continuously monitoring the chart.
Visual Labels for Reversal Points: The indicator plots labels ("R") at potential reversal points, with color-coded labels for bullish (green) and bearish (red) pullbacks, highlighting pullback opportunities that align with the trend or reversal potential.
🔶 Disclaimer
Use with Caution: This indicator is provided for educational and informational purposes only and should not be considered as financial advice. Users should exercise caution and perform their own analysis before making trading decisions based on the indicator's signals.
Not Financial Advice: The information provided by this indicator does not constitute financial advice, and the creator (UAlgo) shall not be held responsible for any trading losses incurred as a result of using this indicator.
Backtesting Recommended: Traders are encouraged to backtest the indicator thoroughly on historical data before using it in live trading to assess its performance and suitability for their trading strategies.
Risk Management: Trading involves inherent risks, and users should implement proper risk management strategies, including but not limited to stop-loss orders and position sizing, to mitigate potential losses.
No Guarantees: The accuracy and reliability of the indicator's signals cannot be guaranteed, as they are based on historical price data and past performance may not be indicative of future results.

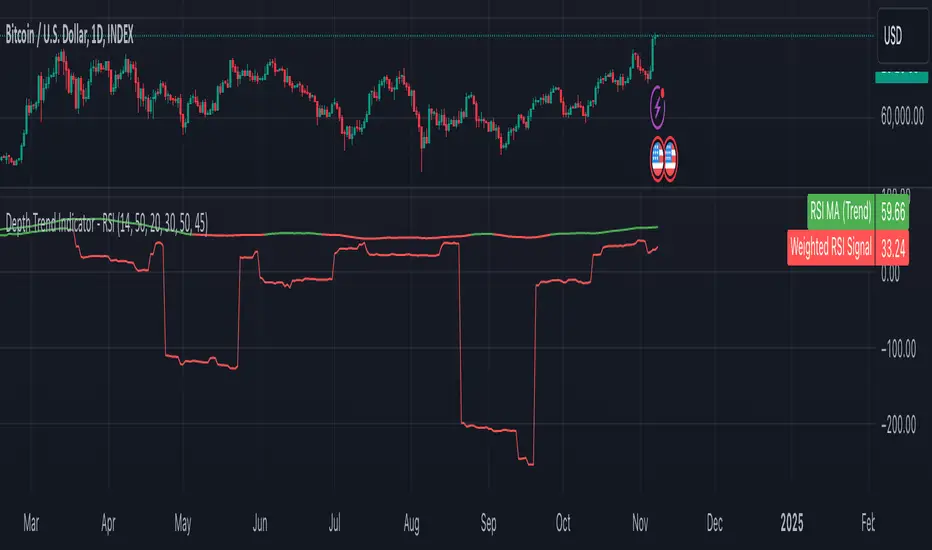
Depth Trend Indicator - RSIDepth Trend Indicator - RSI
This indicator is designed to identify trends and gauge pullback strength by combining the power of RSI and moving averages with a depth-weighted calculation. The script was created by me, Nathan Farmer and is based on a multi-step process to determine trend strength and direction, adjusted by a "depth" factor for more accurate signal analysis.
How It Works
Trend Definition Using RSI: The RSI Moving Average ( rsiMa ) is calculated to assess the current trend, using customizable parameters for the RSI Period and MA Period .
Trends are defined as follows:
Uptrend : RSI MA > Critical RSI Value
Downtrend : RSI MA < Critical RSI Value
Pullback Depth Calculation: To measure pullback strength relative to the current trend, the indicator calculates a Depth Percentage . This is defined as the portion of the gap between the moving average and the price covered by a pullback.
Depth-Weighted RSI Calculation: The Depth Percentage is then applied as a weighting factor on the RSI Moving Average , giving us a Weighted RSI line that adjusts to the depth of pullbacks. This line is rather noisy, and as such we take a moving average to smooth out some of the noise.
Key Parameters
RSI Period : The period for RSI calculation.
MA Period : The moving average period applied to RSI.
Price MA Period : Determines the SMA period for price, used to calculate pullback depth.
Smoothing Length : Length of smoothing applied to the weighted RSI, creating a more stable signal.
RSI Critical Value : The critical value (level) used in determining whether we're in an uptrend or a downtrend.
Depth Critical Value : The critical value (level) used in determining whether or not the depth weighted value confirms the state of a trend.
Notes:
As always, backtest this indicator and modify the parameters as needed for your specific asset, over your specific timeframe. I chose these defaults as they worked well on the assets I look at, but it is likely you tend to look at a different group of assets over a different timeframe than what I do.
Large pullbacks can create large downward spikes in the weighted line. This isn't graphically pleasing, but I have tested it with various methods of normalization and smoothing and found the simple smoothing used in the indicator to be best despite this.
Multi Fibonacci Supertrend with Signals【FIbonacciFlux】Multi Fibonacci Supertrend with Signals (MFSS)
Overview
The Multi Fibonacci Supertrend with Signals (MFSS) is an advanced technical analysis tool that combines multiple Supertrend indicators using Fibonacci ratios to identify trend directions and potential trading opportunities.
Key Features
1. Fibonacci-Based Supertrend Levels
* Factor 1 (Weak) : 0.618 - The golden ratio
* Factor 2 (Medium) : 1.618 - The Fibonacci ratio
* Factor 3 (Strong) : 2.618 - The extension ratio
2. Visual Components
* Multi-layered Trend Lines
* Different line weights for easy identification
* Progressive transparency from Factor 1 to Factor 3
* Color-coded trend directions (Green for bullish, Red for bearish)
* Dynamic Fill Areas
* Gradient fills between price and trend lines
* Visual representation of trend strength
* Automatic color adjustment based on trend direction
* Signal Indicators
* Clear BUY/SELL labels on chart
* Position-adaptive signal placement
* High-visibility color scheme
3. Signal Generation Logic
The system generates signals based on two key conditions:
* Primary Condition :
* BUY : Price crossunder Supertrend2 (Factor 1.618)
* SELL : Price crossover Supertrend2 (Factor 1.618)
* Confirmation Filter :
* Signals only trigger when Supertrend3 confirms the trend direction
* Reduces false signals in volatile markets
Technical Details
Input Parameters
* ATR Period : 10 (default)
* Customizable for different market conditions
* Affects sensitivity of all Supertrend levels
* Factor Settings :
* All factors are customizable
* Default values based on Fibonacci sequence
* Minimum value: 0.01
* Step size: 0.01
Alert System
* Built-in alert conditions
* Customizable alert messages
* Real-time notification support
Use Cases
* Trend Trading
* Identify strong trend directions
* Filter out weak signals
* Confirm trend continuations
* Risk Management
* Multiple trend levels for stop-loss placement
* Clear entry and exit signals
* Trend strength visualization
* Market Analysis
* Multi-timeframe analysis capability
* Trend strength assessment
* Market structure identification
Benefits
* Reliability
* Based on proven Supertrend algorithm
* Enhanced with Fibonacci mathematics
* Multiple confirmation levels
* Clarity
* Clear visual signals
* Easy-to-interpret interface
* Reduced noise in signal generation
* Flexibility
* Customizable parameters
* Adaptable to different markets
* Suitable for various trading styles
Performance Considerations
* Optimized code structure
* Efficient calculation methods
* Minimal resource usage
Installation and Usage
Setup
* Add indicator to chart
* Adjust parameters if needed
* Enable alerts as required
Best Practices
* Use with other confirmation tools
* Adjust factors based on market volatility
* Consider timeframe appropriateness
Backtesting Results and Strategy Performance
This indicator is specifically designed for pullback trading with optimized risk-reward ratios in trend-following strategies. Below are the detailed backtesting results from our proprietary strategy implementation:
BTCUSDT Performance (Binance)
* Test Period: Approximately 7 years
* Risk-Reward Ratio: 2:1
* Take Profit: 8%
* Stop Loss: 4%
Key Metrics (BTCUSDT):
* Net Profit: +2,579%
* Total Trades: 551
* Win Rate: 44.8%
* Profit Factor: 1.278
* Maximum Drawdown: 42.86%
ETHUSD Performance (Binance)
* Risk-Reward Ratio: 4.33:1
* Take Profit: 13%
* Stop Loss: 3%
Key Metrics (ETHUSD):
* Net Profit: +8,563%
* Total Trades: 581
* Win Rate: 32%
* Profit Factor: 1.32
* Maximum Drawdown: 55%
Strategy Highlights:
* Optimized for pullback trading in strong trends
* Focus on high risk-reward ratios
* Proven effectiveness in major cryptocurrency pairs
* Consistent performance across different market conditions
* Robust profit factor despite moderate win rates
Note: These results are from our proprietary strategy implementation and should be used as reference only. Individual results may vary based on market conditions and implementation.
Important Considerations:
* The strategy demonstrates strong profitability despite lower win rates, emphasizing the importance of proper risk-reward ratios
* Higher drawdowns are compensated by significant overall returns
* The system shows adaptability across different cryptocurrencies with consistent profit factors
* Results suggest optimal performance in volatile crypto markets
Real Trading Examples
BTCUSDT 4-Hour Chart Analysis
Example of pullback strategy implementation on Bitcoin, showing clear trend definition and entry points
ETHUSDT 4-Hour Chart Analysis
Ethereum chart demonstrating effective signal generation during strong trends
BTCUSDT Detailed Signal Example (15-Minute Scalping)
Close-up view of signal generation and trend confirmation process on 15-minute timeframe, demonstrating the indicator's effectiveness for scalping operations
Chart Analysis Notes:
* Green and red zones clearly indicate trend direction
* Multiple timeframe confirmation visible through different Supertrend levels
* Clear entry signals during pullbacks in established trends
* Precise stop-loss placement opportunities below support levels
Implementation Guidelines:
* Wait for main trend confirmation from Factor 3 (2.618)
* Enter trades on pullbacks to Factor 2 (1.618)
* Use Factor 1 (0.618) for fine-tuning entry points
* Place stops below the relevant Supertrend level
Footnotes:
* Charts provided are from Binance exchange, using both 4-hour and 15-minute timeframes
* Trading view screenshots captured during actual market conditions
* Indicators shown: Multi Fibonacci Supertrend with all three factors
* Time period: Recent market activity showing various market conditions
Important Notice:
These charts are for educational purposes only. Past performance does not guarantee future results. Always conduct your own analysis and risk management.
Disclaimer
This indicator is for informational purposes only. Past performance is not indicative of future results. Always conduct proper risk management and due diligence.
License
Open source under MIT License
Author's Note
Contributions and suggestions for improvement are welcome. Please feel free to fork and enhance.

BOS TRADER [v 1.0] [Influxum]The name of the tool, BOS Trader, comes from the abbreviation BOS, which stands for Break Of Structure. In simple terms, this tool identifies situations where a change in market structure occurs after liquidity has been grabbed. Following the structural change, it looks for a point where the balance between buyers and sellers will be tested, potentially continuing the price movement in the direction of the structural break.
The goal of this tool is to identify areas where a trader can look for potential entry opportunities based on their entry rules and filters. In our own research, we found that while this tool is not a standalone strategy, it provides a statistical advantage that stems from the nature of the market itself. If you expect the market to reverse at a certain price level against a short-term, medium-term, or long-term trend, that reversal must logically begin with a change in structure – i.e., its break. BOS Trader then highlights the zone where you can expect a strong reaction from traders speculating on the continuation of price in the direction of the break.
Another important piece of the puzzle is the concept of liquidity. Liquidity grabs are generally considered by traders to be events that can trigger market direction changes. That's why BOS Trader is complemented with multiple ways to identify liquidity in the market from a Price Action perspective. We have explored the liquidity concept in depth in our other tools – the Liquidity Tool and Liquidity Strategy Tester – so we won’t go into too much detail on liquidity settings here.
🟪 Pivots
Liquidity can be found beyond pivot extremes – the highest candles in a series of candles. The pivot liquidity setting specifies how many candles must be before and after the pivot candle with a lower high for a pivot high or a higher low for a pivot low. A pivot high is the local highest point of the last 31 candles (15 before the pivot candle, the pivot candle itself, and 15 after). Another option is to set the time period in which the pivot extreme must occur. For example, you can differentiate between pivot highs of the Asian or London session.
🟪 % Percent Change
This setting is based on the well-known Zig Zag indicator and confirms swing highs or swing lows when there is a certain percentage change in price. This helps filter out noise that can occur when the market consolidates and randomly creates pivot highs or lows that aren’t significant.
🟪 Session High/Low
Many popular strategies are based on liquidity defined as the price range of a specific trading session. This doesn't have to be London, Asia, or New York sessions, but could be, for instance, the first hour of the New York session, and so on.
🟪 Day High/Low, Week High/Low, Month High/Low
As the name suggests, liquidity is often defined by the high/low of the previous day, week, or month. These price levels are watched by many market participants, and it's reasonable to expect reactions at these levels. That’s why we included this option in the BOS tool.
Tip for Traders
To avoid common issues with setting the correct session time, we have added the BG option to the tool – the ability to display a background for the configured trading session. This makes it easy to verify that your trading session is set correctly in relation to your time zone.
Delete grabbed liquidity
If a liquidity level is breached by price, it becomes invalid. For those who prefer to keep their charts clean and uncluttered, there is an option to delete grabbed liquidity. This way, only untraded, valid liquidity lines will be visible on the chart.
Bars after liquidity grab
A liquidity grab should be a significant event that triggers a reaction from market participants. To ensure this is a real response to liquidity rather than random market behavior, we added a time test to the BOS tool. A structural break must occur within a specified time after the liquidity grab. You can define this time in the tool as the number of bars after which the structural break is still considered valid following the liquidity grab.
🟪 AOI (Area of Interest) Settings
Initially, it's important to note that there are two main options for setting the behavior of the AOI. The first option is to fix its duration by the number of bars – Duration, and the second is to keep the AOI valid until it is traded through – Extended.
Duration
Since we expect a quick reaction to the liquidity grab, we also expect a fast pullback to the AOI and a swift response of traders. Our research has shown that the strongest reactions typically occur within a maximum of 15 bars from the formation of the AOI (fractally across timeframes). Therefore, this value is set as the default. However, we recommend considering not just the speed of the reaction but also its intensity. After the set number of bars, the AOI stops extending further.
Extended
We have noticed that price has a tendency to return to the AOI even after a longer period and react again. For this reason, we included the option in the BOS tool to extend the AOI into the future, with the ability to freely adjust the Max AOI Length.
🟪 AOI Size Mode
There are two options for setting the size of the AOI. Either it can be calculated as a percentage of the swing size (% of swing) in which the structural break occurred (the default setting is 30%), or you can set a different concept for the AOI size. For example, the well-known Optimal Trade Entry model. Custom values can be set in the FIBO Levels option, where you can define either preferred Fibonacci values or values based on your own criteria.
🟪 Trading Session (signals + alerts + visibility)
The main goal of our tools is to make it easier for traders to identify patterns and opportunities in the market and allow them to be alerted to their occurrence. The time for AOI plotting after a liquidity grab is combined into a single Trading Session function. This controls both the AOI plotting and when the tool will send alerts. All of this is aimed at helping traders avoid spending the entire day in front of their monitors, waiting for trading opportunities. Here, too, you can use the BG feature to plot a background on the chart showing the current session.
🟪 Trading within session range
We found that some traders have difficulty navigating the many AOIs plotted during times when the market consolidates and creates numerous false breakouts. Therefore, we included an option in the BOS tool to track only structural changes at the price extremes of the current day and trading session. The tool will not plot structural changes for internal liquidity grabs (within the session range), but only for external liquidity grabs (highest highs and lowest lows of the session or liquidity from previous days).
Visuals
The BOS tool is, of course, supplemented with the option to customize the appearance of all its components according to your preferences.

EMA Distance & Sector InfoThis indicator provides insights into price trends relative to Exponential Moving Averages (EMAs) and displays sector/industry information about the asset. Below is a detailed explanation of its purpose and what it is designed to achieve:
Purpose of the Code
The indicator offers two key functionalities:
1. Analyzing Price Distance from Multiple EMAs:
• Helps traders understand how far the current price is from key EMAs, expressed as a percentage.
• Calculates average percentage distances over a specified period (default: 63 days) to spot consistent trends or mean reversion opportunities.
• Useful for trend-following strategies, allowing the trader to see when the price is above or below important EMAs (e.g., 9, 21, 50, 100, and 150-period EMAs).
2. Displaying Asset Sector and Industry Information:
• Displays the sector and industry of the asset being analyzed (e.g., Technology, Consumer Goods).
• Provides additional context when evaluating performance across a specific sector or comparing an asset to its peers.
Who Would Use This Indicator?
This indicator is particularly helpful for:
1. Swing Traders and Positional Traders:
• They can use it to track whether the price is trading significantly above or below critical EMAs, which often signals overbought/oversold conditions or trend strength.
• The average percentage distances help to identify momentum shifts or pullback opportunities.
2. Sector/Industry-Focused Investors:
• Understanding an asset’s sector and industry helps investors gauge how the asset fits into the broader market context.
• This is valuable for sector rotation strategies, where investors shift funds between sectors based on performance trends.
How It Helps in Trading Decisions
1. Entry and Exit Points:
• If the price is far above an EMA (e.g., 21 EMA), it might indicate an overbought condition or a strong trend, while a negative percentage could signal a pullback or reversal opportunity.
• The average percentage distances smooth the fluctuations and reveal longer-term trends.
2. Contextual Information:
• Knowing the sector and industry is useful when analyzing trends. For example, if Technology stocks are doing well, and this asset belongs to that sector, it could indicate sector-wide momentum.
Summary of the Indicator’s Purpose
This code provides:
• EMA trend monitoring: Visualizes the price position relative to multiple EMAs and averages those distances for smoother insights.
• Sector and industry information: Adds valuable context for asset performance analysis.
• Decision-making support: Helps traders identify overbought/oversold levels and assess the asset within the broader market landscape.
In essence, this indicator is a multi-purpose tool that combines technical analysis (through EMA distances) with fundamental context (via sector/industry info), making it valuable for traders and investors aiming to time entries/exits or understand market behavior better.
MACD Trail | Flux Charts💎 GENERAL OVERVIEW
Introducing our new MACD Trail indicator! Moving average convergence/divergence (MACD) is a well-known indicator among traders. It's a trend-following indicator that uses the relationship between two exponential moving averages (EMAs). This indicator aims to use MACD to generate a trail that follows the current price of the ticker, which can act as a support / resistance zone. More info about the process in the "How Does It Work" section.
Features of the new MACD Trail Indicator :
A Trail Generated Using MACD Calculation
Customizable Algorithm
Customizable Styling
📌 HOW DOES IT WORK ?
First of all, this indicator calculates the current MACD of the ticker using the user's input as settings. Let X = MACD Length setting ;
MACD ~= X Period EMA - (X * 2) Period EMA
Then, two MACD Trails are generated, one being bullish and other being bearish. Let ATR = 30 period ATR (Average True Range)
Bullish MACD Trail = Current Price + MACD - (ATR * 1.75)
Bearish MACD Trail = Current Price + MACD + (ATR * 1.75)
The indicator starts by rendering only the Bullish MACD Trail. Then if it's invalidated (candlestick closes below the trail) it switches to Bearish MACD Trail. The MACD trail switches between bullish & bearish as they get invalidated.
The trail type may give a hint about the current trend of the price action. The trail itself also can act as a support / resistance zone, here is an example :
🚩 UNIQUENESS
While MACD is one of the most used indicators among traders, this indicator aims to add another functionality to it by rendering a trail based on it. This trail may act as a support / resistance zone as described above, and gives a glimpse about the current trend. The indicator also has custom MACD Length and smoothing options, as well as various style options.
⚙️ SETTINGS
1. General Configuration
MACD Length -> This setting adjusts the EMA periods used in MACD calculation. Increasing this setting will make MACD more responseive to longer trends, while decreasing it may help with detection of shorter trends.
Smoothing -> The smoothing of the MACD Trail. Increasing this setting will help smoothen out the MACD Trail line, but it can also make it less responsive to the latest changes.

Brooks Always In [KintsugiTrading]Brooks Always In
Overview:
The "Brooks Always In Indicator" by KintsugiTrading is a tool designed for traders who follow price action methodologies inspired by Al Brooks. This indicator identifies key bar patterns and breakouts, plots an Exponential Moving Average (EMA), and highlights consecutive bullish and bearish bars. It is intended to assist traders in making informed decisions based on price action dynamics.
Features:
Consecutive Bar Patterns:
Identifies and highlights consecutive bullish and bearish bars.
Differentiates between bars that are above/below the EMA and those that are not.
Customizable EMA:
Option to display an Exponential Moving Average (EMA) with user-defined length and offset.
The EMA can be smoothed using various methods such as SMA, EMA, SMMA (RMA), WMA, and VWMA.
Breakout Patterns:
Recognizes bullish and bearish breakout bars and outside bars.
Tracks inside bars and prior bar conditions to better understand the market context.
Customizable Display:
Users can display or hide the EMA, consecutive bar patterns, and consecutive bars relative to the moving average.
How to Use:
Customize Settings:
First, I like to navigate to the top right corner of the chart (bolt icon), and change both the bull and bear body color to match the background (white/black) - this helps the user visualize the indicator far better.
Next, Toggle to display EMA, consecutive bar patterns, and consecutive bars relative to the moving average using the provided input options.
Adjust the EMA length, source, and offset as per your trading strategy.
Select the smoothing method and length for the EMA if desired.
Analyze Key Patterns:
Observe the highlighted bars on the chart to identify consecutive bullish and bearish patterns.
Use the plotted EMA to gauge the general trend and analyze the relationship between price bars and the moving average.
Informed Decision Making:
Utilize the identified bar patterns and breakouts to make informed trading decisions, such as identifying potential entry and exit points based on price action dynamics.
Good luck with your trading!

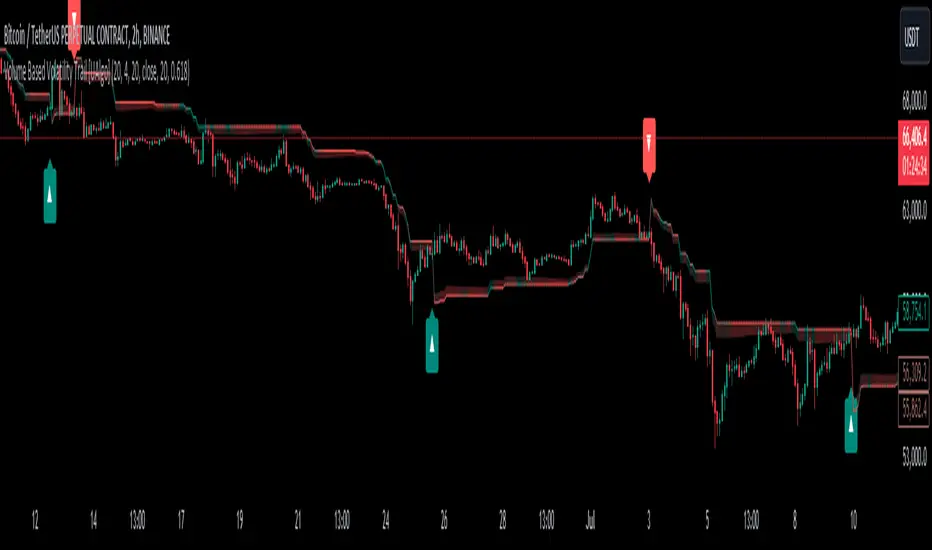
Volume Based Volatility Trail [UAlgo]"Volume Based Volatility Trail ", is designed to identify potential trading opportunities based on volatility and volume analysis. It calculates the Average True Range (ATR) to gauge market volatility and uses a volume-based multiplier to dynamically adjust a trailing stop level. The indicator also incorporates volume analysis to identify high volume periods that might signal potential breakouts.
🔶 Key Features
Volume-Based Volatility Trail: The indicator calculates a trailing stop level based on the ATR, which is then adjusted based on volume. Higher volume periods can lead to a wider trailing stop to account for increased volatility.
Price Source: Users can select the price source (e.g., close, open) for volume calculations.
Customizable Inputs: Users can adjust various parameters like the ATR period, multiplier, smoothing period, volume SMA period, ATR adjustment factor, and colors for buy/sell signals and the trailing stop area.
Buy/Sell Alerts: The indicator generates alerts for potential buy and sell opportunities based on the trailing stop crossing the price.
🔶 Usage
Look for buy signals (▲ marker) when the price crosses above the trailing stop level, potentially indicating a bullish trend.
Conversely, sell signals (▼ marker) appear when the price falls below the trailing stop, suggesting a bearish trend.
The shaded area around the trailing stop represents a buffer zone that might offer some protection against price fluctuations, but it can also indicate areas of potential pullbacks. During volatile periods or after strong price movements, the price might retrace back towards the trailing stop before continuing its trend. This shaded area can help visualize these potential retracement zones.
High volume periods (highlighted by the indicator) can be used in conjunction with other technical analysis to confirm potential breakouts. Analyze these high volume periods alongside price action and other indicators to assess the strength of the breakout and the likelihood of the price continuing its upward move.
🔶 Disclaimer:
Use with Caution: This indicator is provided for educational and informational purposes only and should not be considered as financial advice. Users should exercise caution and perform their own analysis before making trading decisions based on the indicator's signals.
Not Financial Advice: The information provided by this indicator does not constitute financial advice, and the creator (UAlgo) shall not be held responsible for any trading losses incurred as a result of using this indicator.
Backtesting Recommended: Traders are encouraged to backtest the indicator thoroughly on historical data before using it in live trading to assess its performance and suitability for their trading strategies.
Risk Management: Trading involves inherent risks, and users should implement proper risk management strategies, including but not limited to stop-loss orders and position sizing, to mitigate potential losses.
No Guarantees: The accuracy and reliability of the indicator's signals cannot be guaranteed, as they are based on historical price data and past performance may not be indicative of future results.
RSI Trail [UAlgo]The RSI Trail indicator is a technical analysis tool designed to assist traders in making informed decisions by utilizing the Relative Strength Index (RSI) and various moving average calculations. This indicator dynamically plots support and resistance levels based on RSI values, providing visual cues for potential bullish and bearish signals. The inclusion of a trailing stop mechanism allows traders to adapt to market volatility, ensuring optimal entry and exit points.
🔶 Key Features
Multiple Moving Average Types: Choose from Simple Moving Average (SMA), Exponential Moving Average (EMA), Weighted Moving Average (WMA), Running Moving Average (RMA), and McGinley Dynamic for diverse analytical approaches.
Configurable RSI Bounds: Tailor the RSI lower and upper bounds to your specific trading preferences, with default settings at 40 and 60.
Signals: The indicator determines bullish and bearish market states and plots corresponding signals on the chart.
Customizable Visualization: Options to display the midline and color candles based on market state enhance visual analysis.
Alerts: Integrated alert conditions notify you of bullish and bearish signals.
🔶 Calculations
The RSI Trail indicator calculates dynamic support and resistance levels using a combination of moving averages and the Relative Strength Index (RSI). It starts by computing a chosen moving average (SMA, EMA, WMA, RMA, or McGinley) over a period of 27 using the typical price (ohlc4).
The indicator then defines upper and lower bounds based on customizable RSI levels (default 40 and 60) and adjusts these bounds using the Average True Range (ATR) to account for market volatility. The upper bound is calculated by adding a volatility-adjusted value to the moving average, while the lower bound is found by subtracting this value. Bullish signals occur when the price crosses above the upper bound, and bearish signals when it falls below the lower bound.
The RSI Trail indicator also can be used to identify pullback opportunities. When the price high/low crosses above/below the calculated upper/lower bound, it indicates a potential pullback, suggesting a favorable point to enter a trade during a pullback.
🔶 Disclaimer
This indicator is for informational purposes only and should not be considered financial advice.
Always conduct your own research and due diligence before making any trading decisions. Past performance is not necessarily indicative of future results.

Volume Buyer-Seller [GOODY]This indicator was designed to analyze buying and selling pressure through volume calculations, providing insights into market dynamics. It can be used to determine whether buyers or sellers dominate the market at any given time.
Key Features
1. Volume Calculations: This indicator calculates the volume attributable to buyers and sellers for each bar, then represents it as buying and selling columns on the chart. It also provides the average volume over a specified period for context.
2. Dominance Logic: By comparing the buying and selling volumes, the indicator determines which side (buyers or sellers) has dominance. If the difference between the two is within a specified threshold, the market is considered indecisive.
3. Dominance Marker: Circles or squares appear on the chart to indicate the dominant force, helping traders quickly assess market sentiment. The colors of these markers can be customized.
4. Label Display: The indicator displays a comprehensive label on the chart with information like total volume, buyer/seller percentages, average volume, ratio, and ATR (Average True Range) details. This label can show current or past data depending on user preference.
5. Ratio and Control: A critical component is the ratio, calculated as the proportion of buying volume to selling volume. This ratio is a key indicator of market sentiment, with an appended symbol to denote whether buyers or sellers are in control.
How to Use
• Settings: Adjust the settings to align with your trading strategy. You can modify the length for average volume, ATR, and other parameters to suit your trading style.
• Volume Analysis: Monitor the buying and selling columns to determine market activity. The larger columns indicate higher volume, suggesting a strong buying or selling pressure.
• Dominance: Pay attention to the dominance markers. Green markers indicate buying dominance, while red markers signify selling dominance. If the market is indecisive, the marker will be gray.
• Ratio: A ratio above 1 suggests buying dominance, while a ratio below 1 indicates selling dominance. The ratio's appended color tag helps quickly identify which side is in control.
• Labels: The labels provide a snapshot of key data, including total volume, buyer/seller percentages, average volume, ratio, and ATR. This information is helpful in understanding overall market conditions.
Reading the Indicator
• Buying and Selling Columns: These represent the respective volumes for each side. Positive columns are buying volumes, and negative columns are selling volumes.
• Dominance Circles: A circle appears at the zero baseline to show which side is currently dominant. A blue circle indicates buying dominance, while a red circle indicates selling dominance.
• Ratio with Dominance: The label includes a ratio with a tag showing who is in control. A green tag indicates buyers, and a red tag indicates sellers.
• ATR and Average Volume: The label provides additional context with ATR and average volume, helping you understand volatility and relative volume.
Volume Gauge Addition : Introduced a volume gauge display option to visualize the relative strength of buying vs. selling volumes. Users can toggle this feature on or off according to their analysis needs.
Total Volume
Metric: Displays "Total Vol."
Value: Shows the total trading volume for the current bar, formatted in a human-readable format (K for thousands, M for millions). Additionally, it shows the percentage of this volume relative to the average volume, aiding in understanding volume spikes or drops.
Usage: Compare current volume to historical averages to identify unusual market activity.
Average Volume
Metric: Displays "Avg Vol."
Value: Shows the simple moving average of the volume over a user-defined period, formatted similarly to Total Volume.
Usage: Helps determine if current volume is above or below average, indicating potential interest or disinterest in the asset.
Buyers
Metric: Displays "BUYERS."
Value: Shows the volume of buying calculated from the upward price movements within the bar, along with its percentage of the total volume.
Usage: Spot dominance in buying activity which might suggest bullish conditions.
Sellers
Metric: Displays "SELLERS."
Value: Shows the volume of selling calculated from the downward price movements within the bar, along with its percentage of the total volume.
Usage: Spot dominance in selling activity which might suggest bearish conditions.
Delta
Metric: Displays "Delta."
Value: Shows the difference between buying and selling volumes, providing a quick snapshot of which side of the market is exerting more pressure.
Usage: Use to gauge overall market sentiment and potential price direction.
Ratio
Metric: Displays "Ratio."
Value: Shows the ratio of buying volume to selling volume, providing insight into the relative strength of buyers vs. sellers.
Usage: Ratios significantly above or below 1 can indicate strong market biases.
ATR (Average True Range)
Metric: Displays "ATR."
Value: Shows the current ATR value to gauge volatility, with an arrow indicating the direction of change from the previous bar’s ATR.
Usage: Utilize to assess market volatility and potentially adjust trading strategies or risk management settings.
Dynamic Background Colors
The table employs dynamic background colors for certain metrics to visually represent data intensity or significance:
Total Volume: Changes color based on the percentage relative to the average volume.
Buyers/Sellers: The background color indicates whether buying or selling is dominant.
Delta and Ratio: Colors change based on their calculated values to reflect market conditions quickly.
What is Volume Delta?
Volume delta, also known as volume difference or volume delta divergence, refers to the difference between buying (accumulation) and selling (distribution) volumes within a given time period. It provides a quantitative measure of the net buying or selling pressure in the market.
How to Use Volume Delta:
Identifying Market Sentiment:
Positive delta values indicate that buying volume exceeds selling volume, suggesting bullish sentiment.
Negative delta values indicate that selling volume exceeds buying volume, suggesting bearish sentiment.
Confirming Price Movements:
Volume delta can be used to confirm price movements. For example, if prices are rising and volume delta is positive, it may suggest that the uptrend is supported by strong buying interest.
Conversely, if prices are falling and volume delta is negative, it may suggest that the downtrend is supported by strong selling pressure.
Spotting Divergence:
Divergence between price and volume delta can signal potential trend reversals. For example, if prices are rising but volume delta is declining (or vice versa), it may indicate weakening momentum and a possible reversal in trend.
Confirming Breakouts:
Volume delta can help confirm breakout moves. For instance, a breakout accompanied by increasing positive delta values may suggest strong buying interest and validate the breakout.
In summary, volume delta provides valuable insights into market sentiment and can be used alongside price action analysis to make more informed trading decisions.
Last Kiss - PullBack to TrendLine
So far, various indicators have been published to draw the trend line. There are also indicators to detect trend line breakouts. But in rare indicators, the issue of " pullback to the trend line " has been discussed.
After breaking the trend line, the price usually returns to the trend line, which is called a pullback or the last kiss.
A pullback is a confirmation of the strength of the trend break.
1. Find the trend line
An uptrend line is formed by connecting two low-pivots.
low-pivot is a candle that has a lower low value than the before and after candles.
The pivot period is optional and can be changed from the indicator settings.
A pivot may form trend lines with several pivots before it. One of the important features of the indicator is that it can identify all trend lines.
The maximum number of trend lines for each pivot can be determined from the indicator settings.
It is also possible to determine the minimum and maximum distance between two pivots.
2. Find the trend line breakout
After the formation of the trend line, we wait for the price to return to it and break that line. As soon as the first candle closes after the trend line, the breakout is confirmed.
A trend line is not valid forever. If after a certain number of candles, the price does not move towards the trend line, the trend line becomes invalid.
The allowed distance from the formation of the trend line to the breaking point is optional.
3. Detect the last kiss (pullback)
For a valid pullback, after breaking the trend line, the price should move far enough away from the trend line (minimum distance is an optional factor of ATR) and then return to the trend line range and react to it.
Since the price reaction to the exact value of a trend line seems to be rare, therefore, we define an area parallel and close to the trend line as the range of the trend line.
The range is defined as an optional factor of ATR(50).
Also, the allowed distance between the trend line breakout and the pullback can be changed from the indicator settings.
Some features of indicator:
- Manage pivots and their distance
- Trend-Line detection of live market
- Extend lines from the right side for more clarity
- Detection of trend line breakout with the possibility of displaying on the chart and sending alarms
- Fast changing the color of broken lines
- Follow the broken lines to detect the pullback to the broken trend line
- Find pullback points and show them on the chart and send alarms
- Color management of trend lines, broken lines and pullback
- Instructions for using the indicator in the form of different tooltips.

Engulfing pullbackThis Indicator searching for pullback on input Moving Average with Engulfing candle
Rules for indicator :-
Buy Signal -
1) search for pullback on ma if price above ma and come back and touches ma
2)after pullback on ma searching for bullish engulfing pattern on next candle
3)if pullback on previous candle and bullish engulfing for buy signal form
Sell Signal -
1) search for pullback on ma if price below ma and come back touches ma
2)after pullback on ma searching for bearish engulfing pattern on next candle
3)if pullback on previous candle and bearish engulfing for buy signal form
Disclaimer -Traders can use this script as a starting point for further customization or as a reference for developing their own trading strategies. It's important to note that past performance is not indicative of future results, and thorough testing and validation are recommended before deploying any trading strategy.
BitBell - EMA PullBack RSI EXO
🔵 Introduction
Version 1.1
This is a Pine 5 trend following strategy. It has a four strategy with several alerts and signals. The design intent is to produce a commercial grade signal generator that can be adapted to any symbol in cryptocurrency and only 1H Chart. Ideally, the script is reliable enough to be the basis of an automated trading system web-hooked to a server with API access to crypto brokerages. The strategy can be run in three different modes: long, short and bidirectional.
As a trend following strategy, the behavior of the script is to buy on strength and sell on weakness. As such the trade orders maintain its directional bias according to price pressure. What you will see on the chart is long positions on the left side of the mountain and short on the right. Long and short positions are not intermingled as long as there exists a detectable trend. This is extremely beneficial feature in long running bull or bear markets. The script uses multiple setups to avoid the situation where you got in on the trend, took a small profit but couldn’t get back in because the logic is waiting for a pullback or some other intricate condition.
Deep draw-downs are a characteristic of trend following systems and this system is no different. However, this script makes use of the TradingView pyramid feature with three NPUs to find better place and even you can change drop percentage in settings for another trigger, accessible from the properties tab.
When trend market break it will stop the trade and usually it takes 2-4 percent loss but don't worry it has prefect money management and you can use it for Futures market and even Spot market.
🔵 Design
This script uses twelve indicators on two time frames. The chart (primary) interval and one higher time frame which is based on the primary. The higher time frame identifies the trend for which the primary will trade. I’ve tried to keep the higher time frame around five times greater than the primary. The original trading algorithms are a port from a much larger program on another trading platform. I’ve converted some of the statistical functions to use standard indicators available on TradingView. The setups make heavy use of the Hull Moving Average in conjunction with EMAs that form the Bill Williams Alligator as described in his book “New Trading Dimensions” Chapter 3. Lag between the Hull and the EMAs form the basis of the entry and exit points. The alligator itself is used to identify the trend main body.
The entire script is around 740 lines of Pine code which is the maximum incidental size given the TradingView limits: local scopes, run-time duration and compile time. I’ve been working on this script for over a year and have tested it on various instruments stock crypto. It performs well on higher liquidity markets that have at least a year of historical data. Though it can be configured to work on any interval between 15 minutes and 4 hour, trend trading is generally a longer term paradigm. For day trading the 10 to 15 minute interval will allow you to catch momentum breakouts. For intraweek trades 30 minutes to 1 hour should give you a trade every other a day.
Inputs to the script use cone centric measurements in effort to avoid exposing adjustments to the various internal indicators. The goal was to keep the inputs relevant to the actual trade entry and exit locations as opposed to a series of MA input values and the like. As a result the strategy exposes over 12 inputs grouped into long or short sections. Inputs are available for the usual minimum profit and stop-loss as well as trade, modes, presets, reports and lots of calibrations. The inputs are numerous, I’m aware. Unfortunately, at this time, TradingView does not offer any other method to get data in the script. The usual initialization files such as cnf, cfg, ini, json and xml files are currently unsupported.
Example configurations for various instruments along with a detailed PDF user manual is available.
it has no repaint i guaranty this, and you can have 10 days free with comment and check it by yourself
One issue that comes up when comparing the strategy with the study is that the strategy trades show on the chart one bar later than the study. This problem is due to the fact that “strategy.entry()” and “strategy_close()” do not execute on the same bar called. The study, on the other hand, has no such limitation since there are no position routines. However, alerts that are subsequently fired off when triggered in the study are dispatched from the TradingView servers one bar later from the study plot. Therefore the alert you actually receive on your cell phone matches the strategy plot but is one bar later than the study plot.
Please be aware that the data source matters. Cryptocurrency has no central tick repository so each exchange supplies TradingView its feed. Even though it is the same symbol the quality of the data and subsequently the bars that are supplied to the chart varies with the exchange. This script will absolutely produce different results on different data feeds of the same symbol. Be sure to backtest this script on the same data you intend to receive alerts for. Any example settings I share with you will always have the exchange name used to generate the test results.
🟡 Usage
It sends long and short signals with pyramid orders of up to 3, meaning that the strategy can trigger up to 3 orders in the same direction. Good risk and money management.
It's important to note that the strategy combines 2 systems working together (Long and LongX). Let’s describe the specific features of this strategy.
🔵 If Findes Supports And Ressitances And Trend Lines As Best As It Can, And You Can See:
🟢 Frist Simple Long Condition = It Look At The Trend Wait For RSI Cross 30 Number Then Ckeck Risk To Reward, check something else such as divergence:
🟢 Another Long Example:
🔴 Frist Simple Short Condition = It Look At The Trend Wait For RSI Cross 70 Number Then Ckeck Risk To Reward, check something else such as divergence:
🔴 Another Short Example:
The following steps provide a very brief set of instructions that will get you started but will most certainly not produce the best backtest. A trading system that you are willing to risk your hard earned capital will require a well crafted configuration that involves time, expertise and clearly defined goals. As previously mentioned, I have several example configs that I use for my own trading that I can share with you along with a PDF which describes each input in detail. To get hands on experience in setting up your own symbol from scratch please follow the steps below.
The input dialog box contains over 12 inputs, There are four options must to be configured: Choose Target, side, Choose Settings, Money Management,and settings that apply to both. The following steps address these four main options only.
Money Management System For Leverage 10:
Bot Finds Last Lower Low And Calculate Distance From Entry Price, Then Cross It To Initial Capitan And Cross Leverage =>
Position_Size = (((1.64) * (initial Capital)) * (leverage))
And Check Dominances Too For Getting Best Money Management Result
🔵 Settings
* Side, You Can Set Long Or Short Or Both.
* Choose Target, You Can Set One Target Or All Targets.
* Money Management, You Can ON Or OFF It, With OFF You Can USE It For SPOT Trades.
* Choose Settings, In This Field You Can Set Mathematical Optimization, Ddepends On Which Pair You USE.
* Clear With Daily PullBack?, With This Check Box You Can Clear Signals With Daily PullBack.
* Long X, You Can Set Long Leverage.
* Short X, You Can Set Short Leverage.
* Second Order X, You Can Set Pyramiding Leverage.
* Target Long, You Can Set Percent For Long Target.
* Target Short, You Can Set Percent For Short Target.
* Short Martin Percent, You Can Set Short Martingale Percent.
* Long Martin Percent, You Can Set Long Martingale Percent.
🟡 Pyraming 3
🟡 Commission Is 0.065 %
🟡 Slippage Is 10 ticks
🔴Only Use For 1 Hour Chart
🔴 CONCLUSION
We believe that success lies in the association of the user with the indicator, opposed to many traders who have the perspective that the indicator itself can make them become profitable. The reality is much more complicated than that.
The aim is to provide an indicator comprehensive, customizable, and intuitive enough that any trader can be led to understand this truth and develop an actionable perspective of technical indicators as support tools for decision making.
🔴 RISK DISCLAIMER
Trading is risky & most day traders lose money. All content, tools, scripts, articles, & education provided by BitBell are purely for informational & educational purposes only. Past performance does not guarantee future results.

TrendGuard Pullback Trader Signals [Quantigenics]The "TrendGuard Pullback Trader Signals" script, integral to the "TrendGuard Pullback Trader" system, offers a sophisticated suite of trading tools for nearly any market or time frame. Designed to be used alongside the "TrendGuard Pullback Trader Indicators" script, this script is pivotal for identifying Buy/Sell Signals, Profit Target Signals, and Stop Loss Levels.
As with all of our scripts, the "TrendGuard Pullback Trader Signals" script, is designed to work on ANY symbol and time frame. The input parameters can be adjusted to fit your specific trading style.
Methodology and Application:
The script's core methodology lies in identifying primary signals at the onset of a trend and secondary signals during pullbacks or dips. It focuses on pinpointing optimal entry points during market pullbacks, enhancing the "TrendGuard Pullback Trader Indicators" script with well-timed signals for profit targets and stop loss levels.
Technical Composition:
The "TrendGuard Pullback Trader Signals" script combines various technical analysis tools to generate comprehensive trading signals. It calculates stop levels by assessing the highest and lowest bars over a chosen period, defining the market range. Primary signals are derived using a triple exponential moving average (EMA) of logarithmic closing prices, identifying trend changes with stop level plots and directional arrows. For secondary signals, the script uses a sequence of EMAs applied to the average price (HLC3) and an oscillator that measures the extremity of recent price movements, pinpointing potential entry points. The script also incorporates a sideways exit mechanism, comparing short-term and long-term EMAs of the average price to detect significant deviations, suggesting exit opportunities. This layered strategy offers a detailed perspective on market trends, momentum, and possible entry and exit points.
EMA-Based Trend Analysis Algorithm :
Utilizes an advanced algorithm that incorporates exponential moving averages (EMA) with specific length parameters. This algorithm analyzes the slope and direction of EMA lines to identify significant shifts in market trends.
Primary Signal Generation : Logarithmic and Triple EMA Function:
Primary signals are derived from a unique logarithmic function applied to price data, which is then processed through a series of three EMAs with distinct period settings. This combination targets potential trend initiation points by detecting shifts in the logarithmic trend curve.
Dynamic Stop Level Determination :
Employs a methodology involving the calculation of recent high and low price bars, adjusted by a factor that considers market volatility. This factor dynamically alters the sensitivity of the stop levels, aligning them with current market conditions.
Secondary Signal Identification During Pullbacks :
Secondary signals are identified through a complex comparison of the market's relative position to its moving averages. This involves calculating the divergence between price and moving averages, adjusted for the rate of change in the market, to flag strategic entry points during pullbacks.
Composite Market Trend Analysis for Signal Mechanism :
Signal generation integrates a composite of multiple technical indicators, each contributing unique mathematical calculations. This integration enhances the accuracy and reliability of entry and exit signals.
Practical Application in Trading :
> For trade initiation, primary signals are used to identify the start of potential trends, applying a specific mathematical threshold to confirm the trend change. Secondary signals focus on quantifying the pullback depth relative to recent market movements for additional entry opportunities.
> The script's dynamic stop loss adjustment incorporates a calculated moving average of recent highs and lows, providing a responsive and protective mechanism for open positions.
How to Use the Script:
Trade Initiation : Primary signals at trend onset can be used for potential entry points, or to simply establish a trend-bias, to watch for Strategic Entries signals.
Strategic Entries on Pullbacks : Secondary signals provide opportunities for additional entries or scaling into positions during pullbacks within the main trend.
Profit Targets and Exit Strategy : Profit target signals serve as potential exit points. For larger positions, consider partial exits at these targets while adjusting stop loss levels to secure profits, and hold the remaining position for further potential gains.
Dynamic Risk Management : Regularly adjust stop loss levels based on the script's dynamic stop level determination to protect against market reversals and lock in profits.
Integration with TrendGuard Pullback Trader Indicators:
The script is designed and intended to be used in conjunction with the "TrendGuard Pullback Trader Indicators ". This integration ensures a holistic approach to market analysis, combining the strengths of both scripts for a comprehensive understanding of market trends, momentum, and entry points.
Note: The lower indicators are from the 'TrendGuard Pullback Trader Indicators' script, complementing the 'TrendGuard Pullback Trader Signals' script seen here, which generates the 'cloud' and signals on the price chart.
The 'TrendGuard Pullback Traders Indicators” script can be found here :
Input Parameter Settings:
Important Usage Guidance: For seamless integration with its counterpart, the "TrendGuard Pullback Trader Indicators" script, it's crucial to align the input parameter settings across both scripts. When adjusting values from their defaults, ensure that corresponding parameters in both scripts are identically set. This synchronization is key to achieving a cohesive and accurate representation on your charts.
Intra-Bar Order Generation (IntraBar): Determines whether signals are generated within the current bar or only after it closes, enhancing flexibility in signal timing.
Stop Level Strength (StopLvlStr): Sets the strength for calculating stop levels, impacting the sensitivity of the script to market highs and lows for stop placement.
Primary Signal Display (PrimON_OFF): Toggles the visibility of primary signals on the chart, aiding in identifying trend initiation points.
Secondary Signal Display (SecON_OFF): Controls the display of secondary signals for opportunities during pullbacks, allowing traders to capitalize on additional entry points.
Stop Loss Level Display (StopLossLvls): Enables or disables the visualization of stop loss levels, crucial for risk management strategies.
Trend Length (TrendLen): Adjusts the length parameter for the EMA calculations, influencing how the script interprets trend duration and strength.
These parameters allow traders to customize the script’s functionality according to their trading style and preferences, ensuring a tailored approach to signal generation and risk management.
Trade Alerts:
The script includes an advanced alert system designed to notify traders of crucial trading signals. This can Especially be useful when using larger time frames where trade setups can take a longer period of time to develop:
Primary Buy/Sell Alerts: Alerts are triggered at primary signals, indicating potential trend initiation points for entering trades.
Secondary Buy/Sell Alerts: These alerts activate during secondary signals, highlighting opportunities within ongoing trends for strategic entries or exits.
Stop Loss Level Alerts: The script can alert traders when the price reaches or crosses the script-determined stop loss levels, aiding in timely decision-making for risk management.
Sideways Exit Alerts: Alerts for potential exits are generated in sideways market conditions, based on the script’s analysis of average price movements.
To set up these alerts, traders can use TradingView’s alert system to specify the conditions under which they receive notifications, such as when a certain shape (e.g., arrow up for buy, arrow down for sell) appears on the chart. This feature helps traders stay informed and react promptly to the dynamic market conditions.
The "TrendGuard Pullback Trader Signals " script is a meticulously crafted tool, essential for traders aiming to enhance their market analysis and decision-making across diverse trading environments. While the script offers advanced functionalities, it reaches its full potential when used alongside the "TrendGuard Pullback Trader Indicators" script. Traders are advised to familiarize themselves with both scripts for a well-rounded trading strategy.
As always, remember that trading involves risks and past performance is not indicative of future results.
You can see the “Author’s instructions" below to get immediate access to TrendGuard Pullback Trader Signals & the rest of the “Quantigenics Premium Indicator Suite”.
Supertrend Advance Pullback StrategyHandbook for the Supertrend Advance Strategy
1. Introduction
Purpose of the Handbook:
The main purpose of this handbook is to serve as a comprehensive guide for traders and investors who are looking to explore and harness the potential of the Supertrend Advance Strategy. In the rapidly changing financial market, having the right tools and strategies at one's disposal is crucial. Whether you're a beginner hoping to dive into the world of trading or a seasoned investor aiming to optimize and diversify your portfolio, this handbook offers the insights and methodologies you need. By the end of this guide, readers should have a clear understanding of how the Supertrend Advance Strategy works, its benefits, potential pitfalls, and practical application in various trading scenarios.
Overview of the Supertrend Advance Pullback Strategy:
At its core, the Supertrend Advance Strategy is an evolution of the popular Supertrend Indicator. Designed to generate buy and sell signals in trending markets, the Supertrend Indicator has been a favorite tool for many traders around the world. The Advance Strategy, however, builds upon this foundation by introducing enhanced mechanisms, filters, and methodologies to increase precision and reduce false signals.
1. Basic Concept:
The Supertrend Advance Strategy relies on a combination of price action and volatility to determine the potential trend direction. By assessing the average true range (ATR) in conjunction with specific price points, this strategy aims to highlight the potential starting and ending points of market trends.
2. Methodology:
Unlike the traditional Supertrend Indicator, which primarily focuses on closing prices and ATR, the Advance Strategy integrates other critical market variables, such as volume, momentum oscillators, and perhaps even fundamental data, to validate its signals. This multidimensional approach ensures that the generated signals are more reliable and are less prone to market noise.
3. Benefits:
One of the main benefits of the Supertrend Advance Strategy is its ability to filter out false breakouts and minor price fluctuations, which can often lead to premature exits or entries in the market. By waiting for a confluence of factors to align, traders using this advanced strategy can increase their chances of entering or exiting trades at optimal points.
4. Practical Applications:
The Supertrend Advance Strategy can be applied across various timeframes, from intraday trading to swing trading and even long-term investment scenarios. Furthermore, its flexible nature allows it to be tailored to different asset classes, be it stocks, commodities, forex, or cryptocurrencies.
In the subsequent sections of this handbook, we will delve deeper into the intricacies of this strategy, offering step-by-step guidelines on its application, case studies, and tips for maximizing its efficacy in the volatile world of trading.
As you journey through this handbook, we encourage you to approach the Supertrend Advance Strategy with an open mind, testing and tweaking it as per your personal trading style and risk appetite. The ultimate goal is not just to provide you with a new tool but to empower you with a holistic strategy that can enhance your trading endeavors.
2. Getting Started
Navigating the financial markets can be a daunting task without the right tools. This section is dedicated to helping you set up the Supertrend Advance Strategy on one of the most popular charting platforms, TradingView. By following the steps below, you'll be able to integrate this strategy into your charts and start leveraging its insights in no time.
Setting up on TradingView:
TradingView is a web-based platform that offers a wide range of charting tools, social networking, and market data. Before you can apply the Supertrend Advance Strategy, you'll first need a TradingView account. If you haven't set one up yet, here's how:
1. Account Creation:
• Visit TradingView's official website.
• Click on the "Join for free" or "Sign up" button.
• Follow the registration process, providing the necessary details and setting up your login credentials.
2. Navigating the Dashboard:
• Once logged in, you'll be taken to your dashboard. Here, you'll see a variety of tools, including watchlists, alerts, and the main charting window.
• To begin charting, type in the name or ticker of the asset you're interested in the search bar at the top.
3. Configuring Chart Settings:
• Before integrating the Supertrend Advance Strategy, familiarize yourself with the chart settings. This can be accessed by clicking the 'gear' icon on the top right of the chart window.
• Adjust the chart type, time intervals, and other display settings to your preference.
Integrating the Strategy into a Chart:
Now that you're set up on TradingView, it's time to integrate the Supertrend Advance Strategy.
1. Accessing the Pine Script Editor:
• Located at the top-center of your screen, you'll find the "Pine Editor" tab. Click on it.
• This is where custom strategies and indicators are scripted or imported.
2. Loading the Supertrend Advance Strategy Script:
• Depending on whether you have the script or need to find it, there are two paths:
• If you have the script: Copy the Supertrend Advance Strategy script, and then paste it into the Pine Editor.
• If searching for the script: Click on the “Indicators” icon (looks like a flame) at the top of your screen, and then type “Supertrend Advance Strategy” in the search bar. If available, it will show up in the list. Simply click to add it to your chart.
3. Applying the Strategy:
• After pasting or selecting the Supertrend Advance Strategy in the Pine Editor, click on the “Add to Chart” button located at the top of the editor. This will overlay the strategy onto your main chart window.
4. Configuring Strategy Settings:
• Once the strategy is on your chart, you'll notice a small settings ('gear') icon next to its name in the top-left of the chart window. Click on this to access settings.
• Here, you can adjust various parameters of the Supertrend Advance Strategy to better fit your trading style or the specific asset you're analyzing.
5. Interpreting Signals:
• With the strategy applied, you'll now see buy/sell signals represented on your chart. Take time to familiarize yourself with how these look and behave over various timeframes and market conditions.
3. Strategy Overview
What is the Supertrend Advance Strategy?
The Supertrend Advance Strategy is a refined version of the classic Supertrend Indicator, which was developed to aid traders in spotting market trends. The strategy utilizes a combination of data points, including average true range (ATR) and price momentum, to generate buy and sell signals.
In essence, the Supertrend Advance Strategy can be visualized as a line that moves with the price. When the price is above the Supertrend line, it indicates an uptrend and suggests a potential buy position. Conversely, when the price is below the Supertrend line, it hints at a downtrend, suggesting a potential selling point.
Strategy Goals and Objectives:
1. Trend Identification: At the core of the Supertrend Advance Strategy is the goal to efficiently and consistently identify prevailing market trends. By recognizing these trends, traders can position themselves to capitalize on price movements in their favor.
2. Reducing Noise: Financial markets are often inundated with 'noise' - short-term price fluctuations that can mislead traders. The Supertrend Advance Strategy aims to filter out this noise, allowing for clearer decision-making.
3. Enhancing Risk Management: With clear buy and sell signals, traders can set more precise stop-loss and take-profit points. This leads to better risk management and potentially improved profitability.
4. Versatility: While primarily used for trend identification, the strategy can be integrated with other technical tools and indicators to create a comprehensive trading system.
Type of Assets/Markets to Apply the Strategy:
1. Equities: The Supertrend Advance Strategy is highly popular among stock traders. Its ability to capture long-term trends makes it particularly useful for those trading individual stocks or equity indices.
2. Forex: Given the 24-hour nature of the Forex market and its propensity for trends, the Supertrend Advance Strategy is a valuable tool for currency traders.
3. Commodities: Whether it's gold, oil, or agricultural products, commodities often move in extended trends. The strategy can help in identifying and capitalizing on these movements.
4. Cryptocurrencies: The volatile nature of cryptocurrencies means they can have pronounced trends. The Supertrend Advance Strategy can aid crypto traders in navigating these often tumultuous waters.
5. Futures & Options: Traders and investors in derivative markets can utilize the strategy to make more informed decisions about contract entries and exits.
It's important to note that while the Supertrend Advance Strategy can be applied across various assets and markets, its effectiveness might vary based on market conditions, timeframe, and the specific characteristics of the asset in question. As always, it's recommended to use the strategy in conjunction with other analytical tools and to backtest its effectiveness in specific scenarios before committing to trades.
4. Input Settings
Understanding and correctly configuring input settings is crucial for optimizing the Supertrend Advance Strategy for any specific market or asset. These settings, when tweaked correctly, can drastically impact the strategy's performance.
Grouping Inputs:
Before diving into individual input settings, it's important to group similar inputs. Grouping can simplify the user interface, making it easier to adjust settings related to a specific function or indicator.
Strategy Choice:
This input allows traders to select from various strategies that incorporate the Supertrend indicator. Options might include "Supertrend with RSI," "Supertrend with MACD," etc. By choosing a strategy, the associated input settings for that strategy become available.
Supertrend Settings:
1. Multiplier: Typically, a default value of 3 is used. This multiplier is used in the ATR calculation. Increasing it makes the Supertrend line further from prices, while decreasing it brings the line closer.
2. Period: The number of bars used in the ATR calculation. A common default is 7.
EMA Settings (Exponential Moving Average):
1. Period: Defines the number of previous bars used to calculate the EMA. Common periods are 9, 21, 50, and 200.
2. Source: Allows traders to choose which price (Open, Close, High, Low) to use in the EMA calculation.
RSI Settings (Relative Strength Index):
1. Length: Determines how many periods are used for RSI calculation. The standard setting is 14.
2. Overbought Level: The threshold at which the asset is considered overbought, typically set at 70.
3. Oversold Level: The threshold at which the asset is considered oversold, often at 30.
MACD Settings (Moving Average Convergence Divergence):
1. Short Period: The shorter EMA, usually set to 12.
2. Long Period: The longer EMA, commonly set to 26.
3. Signal Period: Defines the EMA of the MACD line, typically set at 9.
CCI Settings (Commodity Channel Index):
1. Period: The number of bars used in the CCI calculation, often set to 20.
2. Overbought Level: Typically set at +100, denoting overbought conditions.
3. Oversold Level: Usually set at -100, indicating oversold conditions.
SL/TP Settings (Stop Loss/Take Profit):
1. SL Multiplier: Defines the multiplier for the average true range (ATR) to set the stop loss.
2. TP Multiplier: Defines the multiplier for the average true range (ATR) to set the take profit.
Filtering Conditions:
This section allows traders to set conditions to filter out certain signals. For example, one might only want to take buy signals when the RSI is below 30, ensuring they buy during oversold conditions.
Trade Direction and Backtest Period:
1. Trade Direction: Allows traders to specify whether they want to take long trades, short trades, or both.
2. Backtest Period: Specifies the time range for backtesting the strategy. Traders can choose from options like 'Last 6 months,' 'Last 1 year,' etc.
It's essential to remember that while default settings are provided for many of these tools, optimal settings can vary based on the market, timeframe, and trading style. Always backtest new settings on historical data to gauge their potential efficacy.
5. Understanding Strategy Conditions
Developing an understanding of the conditions set within a trading strategy is essential for traders to maximize its potential. Here, we delve deep into the logic behind these conditions, using the Supertrend Advance Strategy as our focal point.
Basic Logic Behind Conditions:
Every strategy is built around a set of conditions that provide buy or sell signals. The conditions are based on mathematical or statistical methods and are rooted in the study of historical price data. The fundamental idea is to recognize patterns or behaviors that have been profitable in the past and might be profitable in the future.
Buy and Sell Conditions:
1. Buy Conditions: Usually formulated around bullish signals or indicators suggesting upward price momentum.
2. Sell Conditions: Centered on bearish signals or indicators indicating downward price momentum.
Simple Strategy:
The simple strategy could involve using just the Supertrend indicator. Here:
• Buy: When price closes above the Supertrend line.
• Sell: When price closes below the Supertrend line.
Pullback Strategy:
This strategy capitalizes on price retracements:
• Buy: When the price retraces to the Supertrend line after a bullish signal and is supported by another bullish indicator.
• Sell: When the price retraces to the Supertrend line after a bearish signal and is confirmed by another bearish indicator.
Indicators Used:
EMA (Exponential Moving Average):
• Logic: EMA gives more weight to recent prices, making it more responsive to current price movements. A shorter-period EMA crossing above a longer-period EMA can be a bullish sign, while the opposite is bearish.
RSI (Relative Strength Index):
• Logic: RSI measures the magnitude of recent price changes to analyze overbought or oversold conditions. Values above 70 are typically considered overbought, and values below 30 are considered oversold.
MACD (Moving Average Convergence Divergence):
• Logic: MACD assesses the relationship between two EMAs of a security’s price. The MACD line crossing above the signal line can be a bullish signal, while crossing below can be bearish.
CCI (Commodity Channel Index):
• Logic: CCI compares a security's average price change with its average price variation. A CCI value above +100 may mean the price is overbought, while below -100 might signify an oversold condition.
And others...
As the strategy expands or contracts, more indicators might be added or removed. The crucial point is to understand the core logic behind each, ensuring they align with the strategy's objectives.
Logic Behind Each Indicator:
1. EMA: Emphasizes recent price movements; provides dynamic support and resistance levels.
2. RSI: Indicates overbought and oversold conditions based on recent price changes.
3. MACD: Showcases momentum and direction of a trend by comparing two EMAs.
4. CCI: Measures the difference between a security's price change and its average price change.
Understanding strategy conditions is not just about knowing when to buy or sell but also about comprehending the underlying market dynamics that those conditions represent. As you familiarize yourself with each condition and indicator, you'll be better prepared to adapt and evolve with the ever-changing financial markets.
6. Trade Execution and Management
Trade execution and management are crucial aspects of any trading strategy. Efficient execution can significantly impact profitability, while effective management can preserve capital during adverse market conditions. In this section, we'll explore the nuances of position entry, exit strategies, and various Stop Loss (SL) and Take Profit (TP) methodologies within the Supertrend Advance Strategy.
Position Entry:
Effective trade entry revolves around:
1. Timing: Enter at a point where the risk-reward ratio is favorable. This often corresponds to confirmatory signals from multiple indicators.
2. Volume Analysis: Ensure there's adequate volume to support the movement. Volume can validate the strength of a signal.
3. Confirmation: Use multiple indicators or chart patterns to confirm the entry point. For instance, a buy signal from the Supertrend indicator can be confirmed with a bullish MACD crossover.
Position Exit Strategies:
A successful exit strategy will lock in profits and minimize losses. Here are some strategies:
1. Fixed Time Exit: Exiting after a predetermined period.
2. Percentage-based Profit Target: Exiting after a certain percentage gain.
3. Indicator-based Exit: Exiting when an indicator gives an opposing signal.
Percentage-based SL/TP:
• Stop Loss (SL): Set a fixed percentage below the entry price to limit potential losses.
• Example: A 2% SL on an entry at $100 would trigger a sell at $98.
• Take Profit (TP): Set a fixed percentage above the entry price to lock in gains.
• Example: A 5% TP on an entry at $100 would trigger a sell at $105.
Supertrend-based SL/TP:
• Stop Loss (SL): Position the SL at the Supertrend line. If the price breaches this line, it could indicate a trend reversal.
• Take Profit (TP): One could set the TP at a point where the Supertrend line flattens or turns, indicating a possible slowdown in momentum.
Swing high/low-based SL/TP:
• Stop Loss (SL): For a long position, set the SL just below the recent swing low. For a short position, set it just above the recent swing high.
• Take Profit (TP): For a long position, set the TP near a recent swing high or resistance. For a short position, near a swing low or support.
And other methods...
1. Trailing Stop Loss: This dynamic SL adjusts with the price movement, locking in profits as the trade moves in your favor.
2. Multiple Take Profits: Divide the position into segments and set multiple TP levels, securing profits in stages.
3. Opposite Signal Exit: Exit when another reliable indicator gives an opposite signal.
Trade execution and management are as much an art as they are a science. They require a blend of analytical skill, discipline, and intuition. Regularly reviewing and refining your strategies, especially in light of changing market conditions, is crucial to maintaining consistent trading performance.
7. Visual Representations
Visual tools are essential for traders, as they simplify complex data into an easily interpretable format. Properly analyzing and understanding the plots on a chart can provide actionable insights and a more intuitive grasp of market conditions. In this section, we’ll delve into various visual representations used in the Supertrend Advance Strategy and their significance.
Understanding Plots on the Chart:
Charts are the primary visual aids for traders. The arrangement of data points, lines, and colors on them tell a story about the market's past, present, and potential future moves.
1. Data Points: These represent individual price actions over a specific timeframe. For instance, a daily chart will have data points showing the opening, closing, high, and low prices for each day.
2. Colors: Used to indicate the nature of price movement. Commonly, green is used for bullish (upward) moves and red for bearish (downward) moves.
Trend Lines:
Trend lines are straight lines drawn on a chart that connect a series of price points. Their significance:
1. Uptrend Line: Drawn along the lows, representing support. A break below might indicate a trend reversal.
2. Downtrend Line: Drawn along the highs, indicating resistance. A break above might suggest the start of a bullish trend.
Filled Areas:
These represent a range between two values on a chart, usually shaded or colored. For instance:
1. Bollinger Bands: The area between the upper and lower band is filled, giving a visual representation of volatility.
2. Volume Profile: Can show a filled area representing the amount of trading activity at different price levels.
Stop Loss and Take Profit Lines:
These are horizontal lines representing pre-determined exit points for trades.
1. Stop Loss Line: Indicates the level at which a trade will be automatically closed to limit losses. Positioned according to the trader's risk tolerance.
2. Take Profit Line: Denotes the target level to lock in profits. Set according to potential resistance (for long trades) or support (for short trades) or other technical factors.
Trailing Stop Lines:
A trailing stop is a dynamic form of stop loss that moves with the price. On a chart:
1. For Long Trades: Starts below the entry price and moves up with the price but remains static if the price falls, ensuring profits are locked in.
2. For Short Trades: Starts above the entry price and moves down with the price but remains static if the price rises.
Visual representations offer traders a clear, organized view of market dynamics. Familiarity with these tools ensures that traders can quickly and accurately interpret chart data, leading to more informed decision-making. Always ensure that the visual aids used resonate with your trading style and strategy for the best results.
8. Backtesting
Backtesting is a fundamental process in strategy development, enabling traders to evaluate the efficacy of their strategy using historical data. It provides a snapshot of how the strategy would have performed in past market conditions, offering insights into its potential strengths and vulnerabilities. In this section, we'll explore the intricacies of setting up and analyzing backtest results and the caveats one must be aware of.
Setting Up Backtest Period:
1. Duration: Determine the timeframe for the backtest. It should be long enough to capture various market conditions (bullish, bearish, sideways). For instance, if you're testing a daily strategy, consider a period of several years.
2. Data Quality: Ensure the data source is reliable, offering high-resolution and clean data. This is vital to get accurate backtest results.
3. Segmentation: Instead of a continuous period, sometimes it's helpful to backtest over distinct market phases, like a particular bear or bull market, to see how the strategy holds up in different environments.
Analyzing Backtest Results:
1. Performance Metrics: Examine metrics like the total return, annualized return, maximum drawdown, Sharpe ratio, and others to gauge the strategy's efficiency.
2. Win Rate: It's the ratio of winning trades to total trades. A high win rate doesn't always signify a good strategy; it should be evaluated in conjunction with other metrics.
3. Risk/Reward: Understand the average profit versus the average loss per trade. A strategy might have a low win rate but still be profitable if the average gain far exceeds the average loss.
4. Drawdown Analysis: Review the periods of losses the strategy could incur and how long it takes, on average, to recover.
9. Tips and Best Practices
Successful trading requires more than just knowing how a strategy works. It necessitates an understanding of when to apply it, how to adjust it to varying market conditions, and the wisdom to recognize and avoid common pitfalls. This section offers insightful tips and best practices to enhance the application of the Supertrend Advance Strategy.
When to Use the Strategy:
1. Market Conditions: Ideally, employ the Supertrend Advance Strategy during trending market conditions. This strategy thrives when there are clear upward or downward trends. It might be less effective during consolidative or sideways markets.
2. News Events: Be cautious around significant news events, as they can cause extreme volatility. It might be wise to avoid trading immediately before and after high-impact news.
3. Liquidity: Ensure you are trading in assets/markets with sufficient liquidity. High liquidity ensures that the price movements are more reflective of genuine market sentiment and not due to thin volume.
Adjusting Settings for Different Markets/Timeframes:
1. Markets: Each market (stocks, forex, commodities) has its own characteristics. It's essential to adjust the strategy's parameters to align with the market's volatility and liquidity.
2. Timeframes: Shorter timeframes (like 1-minute or 5-minute charts) tend to have more noise. You might need to adjust the settings to filter out false signals. Conversely, for longer timeframes (like daily or weekly charts), you might need to be more responsive to genuine trend changes.
3. Customization: Regularly review and tweak the strategy's settings. Periodic adjustments can ensure the strategy remains optimized for the current market conditions.
10. Frequently Asked Questions (FAQs)
Given the complexities and nuances of the Supertrend Advance Strategy, it's only natural for traders, both new and seasoned, to have questions. This section addresses some of the most commonly asked questions regarding the strategy.
1. What exactly is the Supertrend Advance Strategy?
The Supertrend Advance Strategy is an evolved version of the traditional Supertrend indicator. It's designed to provide clearer buy and sell signals by incorporating additional indicators like EMA, RSI, MACD, CCI, etc. The strategy aims to capitalize on market trends while minimizing false signals.
2. Can I use the Supertrend Advance Strategy for all asset types?
Yes, the strategy can be applied to various asset types like stocks, forex, commodities, and cryptocurrencies. However, it's crucial to adjust the settings accordingly to suit the specific characteristics and volatility of each asset type.
3. Is this strategy suitable for day trading?
Absolutely! The Supertrend Advance Strategy can be adjusted to suit various timeframes, making it versatile for both day trading and long-term trading. Remember to fine-tune the settings to align with the timeframe you're trading on.
4. How do I deal with false signals?
No strategy is immune to false signals. However, by combining the Supertrend with other indicators and adhering to strict risk management protocols, you can minimize the impact of false signals. Always use stop-loss orders and consider filtering trades with additional confirmation signals.
5. Do I need any prior trading experience to use this strategy?
While the Supertrend Advance Strategy is designed to be user-friendly, having a foundational understanding of trading and market analysis can greatly enhance your ability to employ the strategy effectively. If you're a beginner, consider pairing the strategy with further education and practice on demo accounts.
6. How often should I review and adjust the strategy settings?
There's no one-size-fits-all answer. Some traders adjust settings weekly, while others might do it monthly. The key is to remain responsive to changing market conditions. Regular backtesting can give insights into potential required adjustments.
7. Can the Supertrend Advance Strategy be automated?
Yes, many traders use algorithmic trading platforms to automate their strategies, including the Supertrend Advance Strategy. However, always monitor automated systems regularly to ensure they're operating as intended.
8. Are there any markets or conditions where the strategy shouldn't be used?
The strategy might generate more false signals in markets that are consolidative or range-bound. During significant news events or times of unexpected high volatility, it's advisable to tread with caution or stay out of the market.
9. How important is backtesting with this strategy?
Backtesting is crucial as it allows traders to understand how the strategy would have performed in the past, offering insights into potential profitability and areas of improvement. Always backtest any new setting or tweak before applying it to live trades.
10. What if the strategy isn't working for me?
No strategy guarantees consistent profits. If it's not working for you, consider reviewing your settings, seeking expert advice, or complementing the Supertrend Advance Strategy with other analysis methods. Remember, continuous learning and adaptation are the keys to trading success.
Other comments
Value of combining several indicators in this script and how they work together
Diversification of Signals: Just as diversifying an investment portfolio can reduce risk, using multiple indicators can offer varied perspectives on potential price movements. Each indicator can capture a different facet of the market, ensuring that traders are not overly reliant on a single data point.
Confirmation & Reduced False Signals: A common challenge with many indicators is the potential for false signals. By requiring confirmation from multiple indicators before acting, the chances of acting on a false signal can be significantly reduced.
Flexibility Across Market Conditions: Different indicators might perform better under different market conditions. For example, while moving averages might excel in trending markets, oscillators like RSI might be more useful during sideways or range-bound conditions. A mashup strategy can potentially adapt better to varying market scenarios.
Comprehensive Analysis: With multiple indicators, traders can gauge trend strength, momentum, volatility, and potential market reversals all at once, providing a holistic view of the market.
How do the different indicators in the Supertrend Advance Strategy work together?
Supertrend: This is primarily a trend-following indicator. It provides traders with buy and sell signals based on the volatility of the price. When combined with other indicators, it can filter out noise and give more weight to strong, confirmed trends.
EMA (Exponential Moving Average): EMA gives more weight to recent price data. It can be used to identify the direction and strength of a trend. When the price is above the EMA, it's generally considered bullish, and vice versa.
RSI (Relative Strength Index): An oscillator that measures the magnitude of recent price changes to evaluate overbought or oversold conditions. By cross-referencing with other indicators like EMA or MACD, traders can spot potential reversals or confirmations of a trend.
MACD (Moving Average Convergence Divergence): This indicator identifies changes in the strength, direction, momentum, and duration of a trend in a stock's price. When the MACD line crosses above the signal line, it can be a bullish sign, and when it crosses below, it can be bearish. Pairing MACD with Supertrend can provide dual confirmation of a trend.
CCI (Commodity Channel Index): Initially developed for commodities, CCI can indicate overbought or oversold conditions. It can be used in conjunction with other indicators to determine entry and exit points.
In essence, the synergy of these indicators provides a balanced, comprehensive approach to trading. Each indicator offers its unique lens into market conditions, and when they align, it can be a powerful indication of a trading opportunity. This combination not only reduces the potential drawbacks of each individual indicator but leverages their strengths, aiming for more consistent and informed trading decisions.
Backtesting and Default Settings
• This indicator has been optimized to be applied for 1 hour-charts. However, the underlying principles of this strategy are supply and demand in the financial markets and the strategy can be applied to all timeframes. Daytraders can use the 1min- or 5min charts, swing-traders can use the daily charts.
• This strategy has been designed to identify the most promising, highest probability entries and trades for each stock or other financial security.
• The combination of the qualifiers results in a highly selective strategy which only considers the most promising swing-trading entries. As a result, you will normally only find a low number of trades for each stock or other financial security per year in case you apply this strategy for the daily charts. Shorter timeframes will result in a higher number of trades / year.
• Consequently, traders need to apply this strategy for a full watchlist rather than just one financial security.
• Default properties: RSI on (length 14, RSI buy level 50, sell level 50), EMA, RSI, MACD on, type of strategy pullback, SL/TP type: ATR (length 10, factor 3), trade direction both, quantity 5, take profit swing hl 5.1, highest / lowest lookback 2, enable ATR trail (ATR length 10, SL ATR multiplier 1.4, TP multiplier 2.1, lookback = 4, trade direction = both).

Strong Pullback Indicator [Rami_LB]Strong Pullback Indicator
Description:
The Strong Pullback Indicator is designed to identify potential pullbacks or even trend reversals by utilizing a specific candlestick pattern in conjunction with the Relative Strength Index (RSI). It is advised to employ this indicator in chart intervals of 15 minutes or higher, as intervals below 15 minutes may generate excessive false signals.
Working Mechanism:
Upon detecting the designated candlestick pattern, the indicator examines whether any of the last five candles exhibit RSI values below 30 or above 70 across at least four distinct time intervals, depending on whether the pattern is bullish or bearish. The RSI calculations incorporate eight different intervals: 1 minute (1m), 5 minutes (5m), 15 minutes (15m), 30 minutes (30m), 1 hour (1h), 2 hours (2h), 4 hours (4h), and 1 day (1d). An arrow is rendered above or below the current candle only when these conditions are met.
Users have the option to adjust the number of overbought or oversold intervals, as well as the general settings for the RSI.
SL/TP Lines:
The indicator can also serve as a trade signal to initiate trades in the opposite direction. To evaluate the potential success of a trade in a backtesting scenario, SL (Stop Loss) and TP (Take Profit) lines can be displayed on the chart. The SL is calculated by taking the distance from the close of the current candle to the high/low of the previous candle and multiplying it by 2.
In the settings, you can alter the Risk Reward Ratio (RRR) of the trade. Given the pullback nature of this indicator, a RRR of 1:1 is deemed logical, thus set as the default value.
Bullish vs. Bearish Candle Counter:
An additional feature of this indicator is its ability to analyze the last 100 candles to ascertain the ratio of bullish to bearish candles. When a 60% threshold is reached, the chart background color alters accordingly. This feature was conceived after a thorough analysis of over 50,000 candles of a currency pair revealed nearly identical counts of bullish and bearish candles, suggesting a market tendency to maintain this balance.
Within the settings, you have the flexibility to modify the number of candles to be analyzed and the percentage threshold for each candle type.
Should you have any ideas on how to enhance the accuracy of this indicator, or suggestions for other indicators that could improve the signals, feel free to leave a comment.
