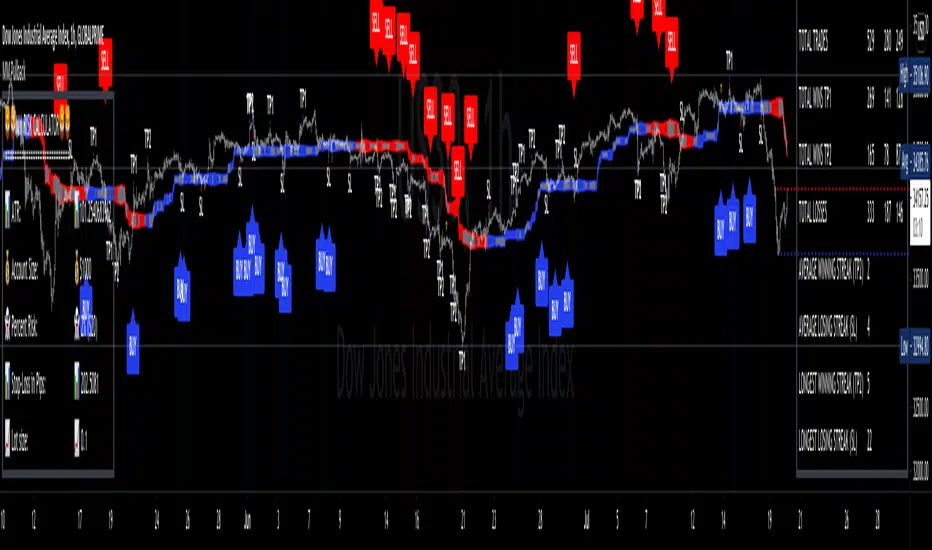
MM PullbackThis Strategy Indicator that detects price reaction zones and give out high probability trades when price pulls back from the zone
with two built in Oscillators the Momentum Oscillator and StochRsi
Art x1.5 SL and Two Tp Levels and Sl alarm to help backtesting
also Built in Channel indicators to help filter trades
Also alerts for all the signals
How to Use
Best time to buy is when you see the Buy badge at the bounce off the Green MA
vis Versa for Sells
for signals that are away from the MA that acts like your major level of S&R
you can use the Bands to help catch the current trend
This is an advanced Market Structure Algo First be able to identify market trend and structure before using this algo
For access please PM
Happy trading
Pullback
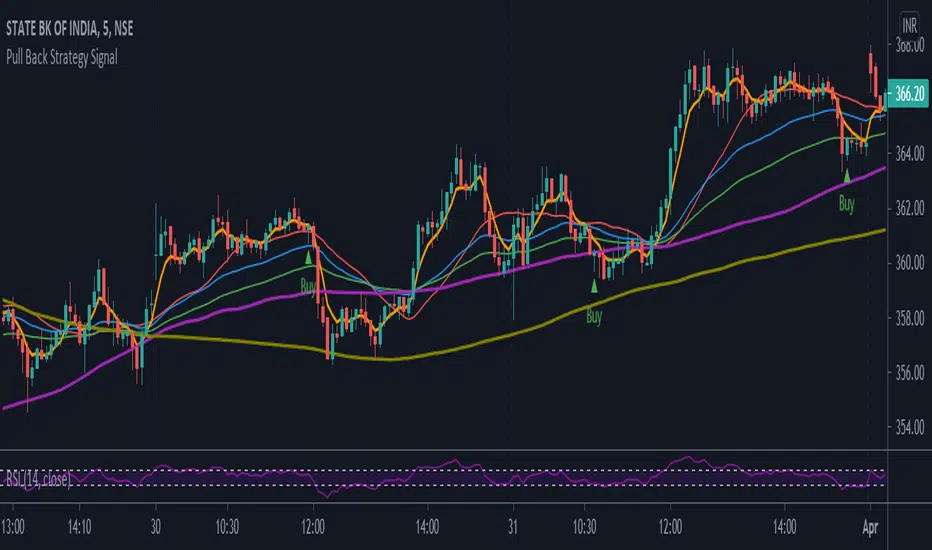
Pull Back Strategy SignalPull back strategy based on moving averages. The scripts will show buy or sell signal based on moving averages - exponential.
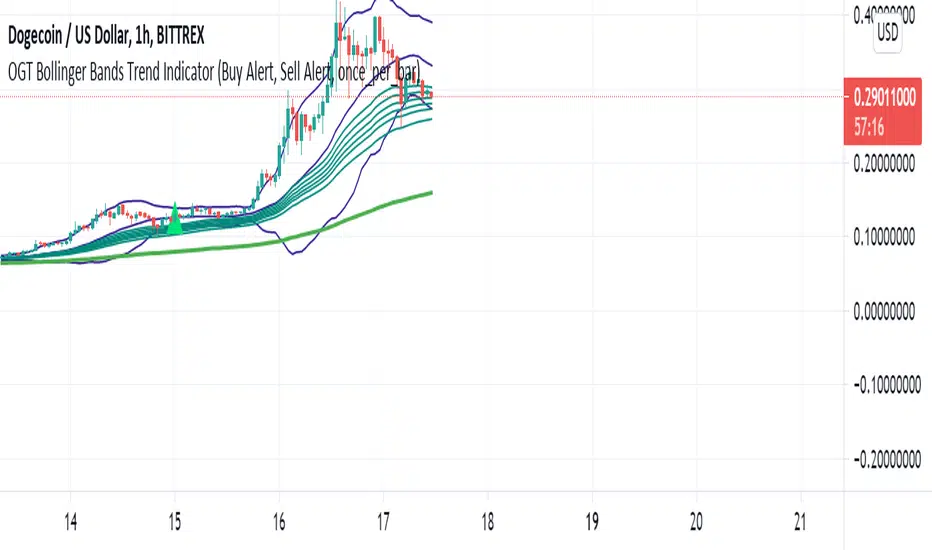
OGT Bollinger Bands Trend IndicatorWhat Is The OGT Bollinger Bands Trend Indicator?
This indicator is a pullback trend trading indicator which uses the following indicators:
- 200 EMA - Long Term Trend Direction
- 30, 35, 40, 45, 50, 60 EMAs - Shorter Term Trend Direction
- Bollinger Bands - Pullback / Entry Signal
How Are Signals Generated?
Buy
- Price above the 200 EMA
- Price touches lower BB with shorter term EMAs all aligned (not crossed)
- Indicator waits for price to close above midpoint BB with shorter term EMAs all still aligned (not crossed)
Sell
- Price below the 200 EMA
- Price touches upper BB with shorter term EMAs all aligned (not crossed)
- Indicator waits for price to close above midpoint BB with shorter term EMAs all still aligned (not crossed)
Alerts function built in, input settings customisable to show/not show indicators and change colours.
Trend ResumptionWe again keep it really simple.
This indicator just plots the combination of RGRR and GRGG candlesticks. (R = Red / Bearish, G = Green / Bullish)
When either pattern occurs, trade the combined high and combined low of recent 2 RR or recent 2 GG candles. I.e.,
Buy above GG's high with SL at GG's low.
Sell below RR's low with SL at RR's high.
Refer the shared chart for example. The signals were plotted on both the sides, and wherever triggered - gave rewards.
Only 1 at 05-Apr, 10:50 a.m. did not trigger, but that must then be ignored. Do not hurry to enter the trade, wait for breakout / breakdown above combined high / low.

Entry master RSI pullbackSimply using a single RSI and placing a signal after it crosses the 50 level after being overbought or oversold in the same direction.

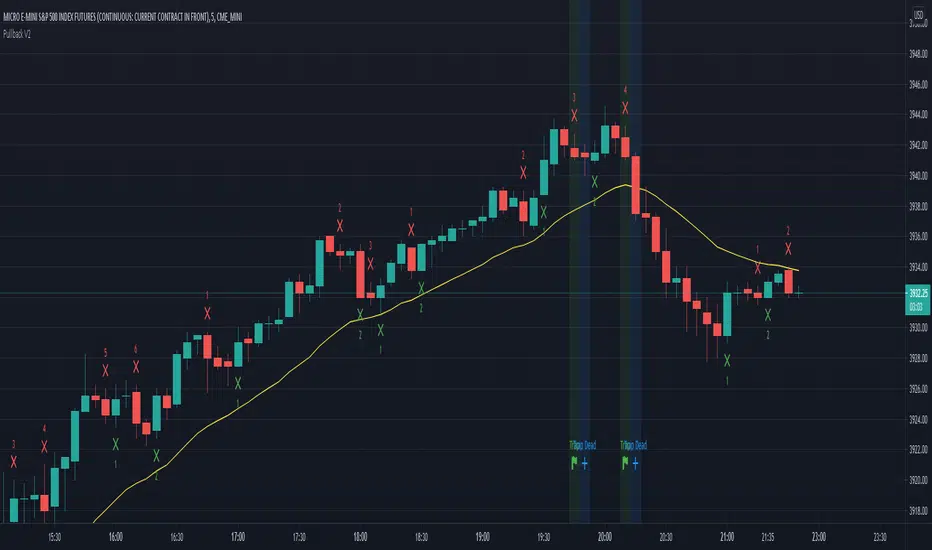
Pullback Traps v. 0.1Trading Strategy for scalping the CME_MINI:ES1! and CME_MINI:MES1! futures on the 5 min. time frame.
The strategy will count legs and look for failed pullbacks and failed second entries where shorters get trapped.
How to use:
When a trap occurs (Marked with green light) place an order one tick above the high of the trap and enter on next candle
If entry doesn't happen on next candle and it has a lower high, move entry to one tick above high of that candle.
Keep doing the above until you enter or until a candle is marked with a blue light and the text Trap Dead.
If you see Trap dead and you haven't entered, quickly cancel your order.
What is green light?
A second or later pullback down away from the uptrend. When the green light is present the shorters haven't made a 1 point profit and short scalpers are trapped.
What is blue light?
1. Shorters made their 1 point profit and trap is dead. Cancel your trade. Or...
2. Shorters hit their stop loss and you're probably in a trade now and about to profit.
Profit and stop loss:
Numbers are done with profit 5 ticks and stop loss 30 ticks.
Should I have a stop loss 6 times greater than profit?
Probably not. The numbers you see here are made with these profit and stop loss figures but I don't advice it in real trading.
The numbers look good on this backtest but in reality a few bad trades would ruin everything.
This was made purely for fun and sim trading - Feel free to do your own testing and show the resulsts.

Buy The Retrace studyA trend-following strategy entering pullbacks
Simple but efficient
The components of the script:
-MTF ATR based Trend
-Fib based cloud to help determine the trend
-Oscillator which is based on the current close relative to the close-only high-low range over a given period of time
The signal frequency can be changed on:
- Period - Length of the period to look for - i.e 25 means, the last 25 candles
- Bullline - signals created if oscillator above this level
- Bearline - signals created if oscillator below this level
I'd recommend taking the first few signals once the trend has changed.
Alerts are available as:
- First long / short signal
- Long / short signal
- Take profit long / short signal
- HTF trend change any direction
- HTF trend change up / down
Does not repaint - however, wait for a candle to close before entering a signal.

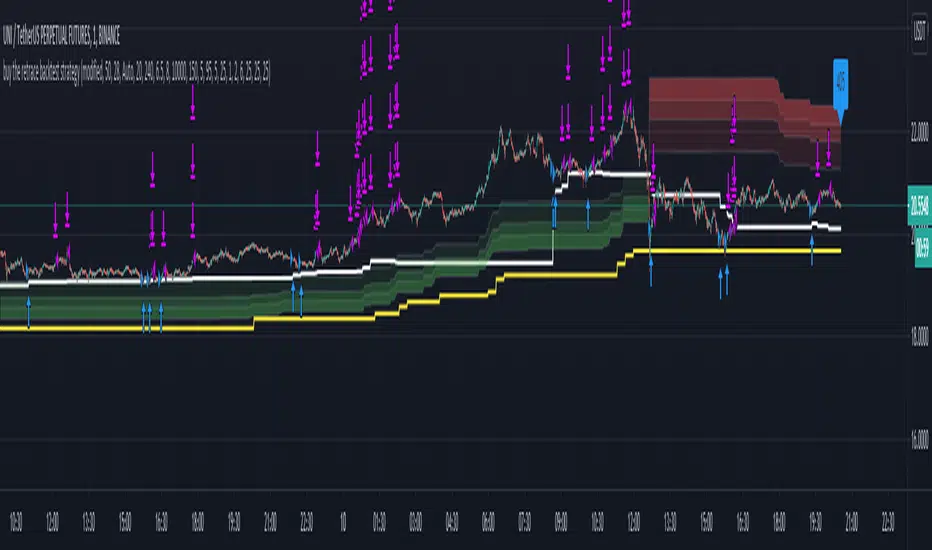
Buy The Retrace backtest strategyA trend-following strategy entering pullbacks
Simple but efficient
Mostly used it on 1 min chart but it works extremely well on 5 min as well.
The components of the strategy:
-MTF ATR based Trend
-Fib based cloud to help determine the trend - Caution when trend and cloud shows a different trend - a reversal may be possible.
-Optional values for the signals -how often you would like to get one- can be changed based on - the current close relative to the close-only high-low range over a given period of time.
-3x take profit levels
- all adjustable in %
- take profit quantities adjustable in % for each level
-paints a line where your average position is
-labels the current position size
Be careful where the cloud is broken, a reversal may happen.
Be careful longing / shorting the same levels which acted as a support/resistance before - this is why the win ratio is around 80% only as a small percentage gets stopped out usually.
Would like to get access? Pm me I'll grant it.
scalping against trapped countertrendAbstract
This script attempts to find the end of countertrend.
This script uses oscillators to measure long term and short period trends. When the long term trend keeps positive and clear short term period is over, this script provides a buy signal.
This script does not contain pullback, cut loss and re-enter. You need to add it manually.
Introduction
Many traders want to buy when long term trend is bullish and short term pullback is over.
This is because we can take advantage to the emotion of countertrend traders.
Countertrend traders realizes their profit is finite and therefore want to protect their profit well and limit their loss.
This script is inspired by a searchable trading strategy video.
The video mentioned 4 points.
(1) long term trend. The video did not spend much ink on this point. You can use any method to observe.
(2) clear pullback bar (at least 50% body)
(3) weak bar after clear pullback
(4) entry trigger buy stop
This script attempts to quantize these points to determine trading direction.
This script is originally designed for timeframes lower than examples in the video but you can apply it on any timeframe.
Computing and Adjusting
(1) long term trend
This script uses smoothed stochastic.
(2) clear pullback bar
Since this script is originally designed for timeframes lower than examples in the video, so the condition becomes:
RSI is low enough
(3) weak bar after clear pullback
RSI goes back from low level.
(4) entry trigger buy stop
This script does not include this condition.
You can decide enter when buy stop or pullback.
Parameters
x_src : the value for computing oscillators
x_len_a : how many bars for measuring short term trend
x_len_b : how many bars for measuring long term trend
x_k_b : smooth long term trend, the average value of stochastic values
x_changk = check if clear short term pullback appears recently. 1 means do not use, larger numbers means how long of periods to check.
x_rsi_ct : threshold of short term pullback clear
x_rsi_ft : threshold of short term pullback end
Reading numbers in Strategy Tester
Most possible loss :
(1) to find rational pullback. Generally 1/3 to 2/3 atr.
(2) to find cut loss distance. Generally 1 to 2 atr.
Most possible profit :
to find if trading the opposite direction against this script is profitable.
Conclusion
This script can suggest us trading direction.
Waiting for pullback can reduce risk, compared to buy stop.
This script does not provide good signals in sideways markets.
Reference
A searchable trading strategy video

Excellent ADXThe Average Directional movement indeX (ADX) is an indicator that helps you determine the trend direction, pivot points, and much more else! But it looks not so easy as other famous indicators. It seems strange or even terrible, but don't be afraid. Let's understand how it works and get its power into your analysis tactics.
In the beginning, imagine a drunk man goes through a ladder: step by step. Up, up, down, up, down, down, up...
How can we understand which direction he goes? Exactly! We can count the number of steps in each direction. In the above example, in the upward – 4, in the downward – 3. So, it looks like he goes in an upward direction.
The ADX indicator counts the same steps, but for price. The size of each step equals 1 ATR for "DI Length" candles. On the indicator chart, we have the green and red lines. The green line represents a number of steps upward. The red line shows one downward. When the red line upper green, then the price goes below, then the trend is directed down. Later the green line comes above the red one, and then the trend changes the direction to upward. Wow? After that, you can easy detect the trend direction on the market!
But it is still not the end. On the chart, we also have the fat blue line. This is the ADX line, and it represents the power of the trend. It is calculated from a distance between the green and red curves. The ADX line value grows if the distance is increased. If the movement is really powerful, then a number of steps into a direction much more prominent than one in an opposed direction. Then the blue line grows faster. But if the growth has stopped and the blue line turns back or already had changed self-direction, then it is a signal that the trend has ended too. It's an excellent sign to close the position (but not always). Easy? Not quite. Thresholds help you there. The indicator has two additional parameters: upper and lower thresholds to evaluate the trend-over signal strength. An u-turn of the ADX line above the upper threshold sends a strong signal. If one occurs between both thresholds, it is a bit weak signal. But if the blue line goes below the lower threshold, it looks like there is no trend, and the price goes side. We can also say that the price goes side when the ADX value gradually falls down.
The Excellent ADX indicator helps you catch pivot/pullback signals based on green, red, and blue lines. Each such signal is highlighted as a green (buy) or red (sell) dot on the plot. The size of the dot represents the strength of the signal. You can also check the position of green and red lines from each other to determine the trend direction and the place where it has been changed. The Excellent ADX indicator helps you there too. It highlights the trend direction by the background-color, so you'll never miss it! The Excellent ADX good compliance with the Price Channel indicator built for the same length. You can use them together to be on a trend wave always!

ATR Trend & ATR Top/Bottom (Zeiierman)█ Overview
ATR Trend & ATR Top/Bottom (Zeiierman) blends momentum, volatility, and adaptive trend analysis into a unified framework. It fuses a dynamic oscillator with ATR-based exhaustion detection to identify trend direction, impulses, and potential reversals within the same structure.
Rather than viewing volatility as noise, this tool interprets it as trend expansion, which represents directional conviction, while contraction signals absorption or exhaustion. By combining multi-phase smoothing, adaptive ATR scaling, and contextual trend filtering, the indicator delivers a complete picture of when a market is accelerating, stabilizing, or reversing.
It performs best once a trend has matured and volatility normalizes around a directional core, giving traders the confidence to participate in established moves while dynamically managing risk.
⚪ Why This One Is Unique
Traditional trend oscillators rely on fixed parameters that degrade across assets or timeframes. ATR Trend & ATR Top/Bottom instead employs adaptive weighting and volatility-normalized filtering that automatically aligns with the current market structure.
Its framework integrates three distinct components:
Adaptive Oscillator Core that reveals the internal rhythm of trend and momentum.
ATR Top/Bottom Layer that marks exhaustion and potential turning zones.
Trend Signal & Dynamic Trailing Stop Engine that highlights directional shifts, confirms alignment with the prevailing trend, and transforms trend data into a self-adjusting risk-management system.
█ Main Features
⚪ ATR Trend (The Main Oscillator)
The ATR Trend serves as the indicator’s primary oscillator, translating price and volatility dynamics into a smooth directional curve. When the oscillator line remains above its equilibrium, bullish momentum dominates; when it stays below, bearish momentum prevails. Color transitions reflect real-time trend bias, helping traders immediately recognize whether the market is strengthening or weakening.
This component forms the structural core of the tool, defining overall trend direction, momentum intensity, and transition zones.
It also visualizes trend expansion through the fast leading signal line. When this line crosses above the upper or below the lower boundary, it signals an expansive move within the active trend, often representing short-term overbought or oversold conditions, and can also indicate trend strength in the prevailing market direction.
⚪ ATR Top/Bottom
The ATR Top/Bottom layer highlights potential exhaustion zones within the trend. Green peaks reveal areas of buy-side saturation, suggesting a possible slowdown or reversal in bullish momentum, while red peaks mark sell-side extremes, often appearing before stabilization or renewed strength. These zones help traders identify when a move is becoming stretched or losing balance, offering valuable context for managing exits, scaling out, or anticipating reversals. However, these areas can extend for a prolonged period when price is in a strong, sustained trend, reflecting persistent directional pressure rather than immediate exhaustion.
⚪ Trend Channel Hits
The Trend Channel Hits feature visualizes moments when the price interacts with the projected internal trend channel boundaries of the prevailing trend.
Green arrows appear when the price touches the upper boundary of the trend channel. This can indicate two possible outcomes:
A potential breakout from a negative trend into a developing bullish trend, as price breaks above the upper boundary of the descending channel.
A take-profit zone within an established bullish trend, as price reaches the upper channel where mean reversion is likely to occur.
Red arrows appear when the price touches the lower boundary of the trend channel. This can indicate:
A potential breakout from a positive trend into a developing bearish trend, as price breaks below the lower boundary of the rising channel.
A take-profit opportunity within an established bearish trend, as price reaches the lower channel where mean reversion or short-term recovery is likely to occur.
These signals provide early visual confirmation of trend exhaustion, continuation, or structural breakout, helping traders refine entries, exits, and profit-taking within the broader market context.
█ How to Use
⚪ Trend Following
When the oscillator line remains above the mid-level, the market is in a bullish phase. When it stays below the mid-level, the trend is bearish. Periods where the oscillator holds close to its upper or lower limits indicate strong, sustained momentum in that direction. Watch for color changes or crossovers near the mid-level, as these often signal an upcoming shift in trend control.
Bullish Trend
Bearish Trend
⚪ Trend Signals
To help traders identify and participate in trend trades, the indicator includes pre-built Trend Signals that highlight optimal entry conditions within confirmed market trends. These signals are designed to activate only once the market shows established directional momentum, ensuring higher reliability and filtering out noise from short-term fluctuations.
In addition, the indicator includes built-in take-profit markers for each signal. These serve as suggested partial exit levels, helping traders systematically secure profits while allowing the remaining position to follow the trend with the dynamic trailing stop.
Before relying on the signals, always confirm that the market has been trending for a sustained period. This ensures that entries align with genuine long-term directional strength rather than temporary volatility.
Bullish Trend Signals
Bullish Trend Signals appear during an established uptrend when the indicator detects confirmed positive momentum and stable directional structure. These signals mark potential continuation points where buyers regain control after short-term pauses or pullbacks.
The objective is to follow the trend signals, manage trades with the dynamic trailing stop, and consider taking partial profits at the inbuilt take-profit levels plotted by the indicator.
This setup works best when the market is trending clearly upward and has demonstrated consistent buying strength over time.
Bearish Trend Signals
Bearish Trend Signals occur during a confirmed downtrend, indicating that selling momentum remains dominant and the trend structure is intact. They typically appear after short-term corrective rallies, signaling that sellers are reasserting control within the broader bearish environment.
As with bullish signals, the goal is to follow the trend signals and trailing stop to capture sustained downside movement, while using the inbuilt take-profit levels to lock in partial gains as the move progresses. This approach performs best when the market is in a clear, mature downtrend with persistent selling pressure and expanding downside momentum.
⚪ Trend Impulses
Impulses represent short bursts of directional acceleration within the active trend.
A surge above the upper band reflects bullish expansion.
A move below the lower band marks bearish acceleration.
These impulses often precede short consolidations before the trend resumes. Traders can use them to scale into strong phases or take partial profits at temporary extremes.
⚪ Reversals
Enable ATR Top/Bottom to monitor momentum peaks:
Red peaks show strong selling momentum. When these peaks start to fade, it can signal that selling pressure is weakening and a potential recovery may be forming.
Green peaks show strong buying momentum. As their size shrinks, it may signal that buying pressure is slowing, and a possible pullback or reversal could follow.
⚪ Extended Trends
For traders who want to visualize intense, extended trend phases, enable the ATR Top/Bottom feature and increase the Length setting to around 30, with Sensitivity set between 40 and 50. Consider reducing the ATR Trend Length to 50 to gain clearer signals of when a trend begins and ends.
This configuration extends the ATR Top/Bottom zones across the entire duration of a major trend, making it easier to identify sustained directional strength and long-lasting momentum phases.
█ How It Works
⚪ Adaptive Oscillator Engine
The oscillator interprets directional flow through a combination of momentum mapping and volatility weighting. It continuously re-centers its equilibrium to reflect evolving market structure, producing a stable yet responsive representation of underlying trend force.
Calculation: Applies multi-domain smoothing and adaptive normalization to align amplitude with volatility while maintaining directional coherence.
⚪ ATR Top/Bottom Detection
The exhaustion layer isolates high-magnitude deviations from the current volatility envelope, identifying potential top and bottom regions where expansion may stall.
Calculation: Uses proportional volatility thresholds and dynamic range modeling to highlight statistically elevated momentum extremes without over-reacting to noise.
-----------------
Disclaimer
The content provided in my scripts, indicators, ideas, algorithms, and systems is for educational and informational purposes only. It does not constitute financial advice, investment recommendations, or a solicitation to buy or sell any financial instruments. I will not accept liability for any loss or damage, including without limitation any loss of profit, which may arise directly or indirectly from the use of or reliance on such information.
All investments involve risk, and the past performance of a security, industry, sector, market, financial product, trading strategy, backtest, or individual's trading does not guarantee future results or returns. Investors are fully responsible for any investment decisions they make. Such decisions should be based solely on an evaluation of their financial circumstances, investment objectives, risk tolerance, and liquidity needs.
Script a pagamento

EMA Pullback StudyA colored EMA (period can be chosen via inputs).
A signal is generated on the first price touch of the EMA following the price floating above or below it for several bars.
- If EMA is green and a green up arrow appears (price touch), look for buys.
- If EMA is red and a red down arrow appears look for sells.
Can be used with a longer period MA to confirm overall direction, MTF, chop zone, etc.
May wish to enter on the signal, or wait for price to turn back in direction of the trend.
Still in development!

Bollinger Band+ Multi EMA, SMAHello Everyone.
I make Bollinger band , 3 ema and 3 sma combined.
I think this indicator can use all timeframe.
--------------------------------------------------------------
Indicator will show you
1. Trend follow
2. Pullback catch
2. Market bounce.
1. Trend Follow
- Trend Follow for I used 3 terms. They are short, Mid and Long Trend.
2. Pullback Catch
- EMA for Save, take care, alert Zones.
- Mid Term Trend can be catch also.
3. Market Bounce
- Bollinger Band will show you market re-bounce point.
Final Notes
Indicator will show Trend, Pullback, Market bounce and some support and resistant level.

TrendBand CycleSimple breakout signal with POTENTIAL target price and stop loss / trailing stop.
Cycle begin with green bar signal and will end if price break above target or break below stop loss.
Volume test and pullback signal only appear within cycle period.
Few example :

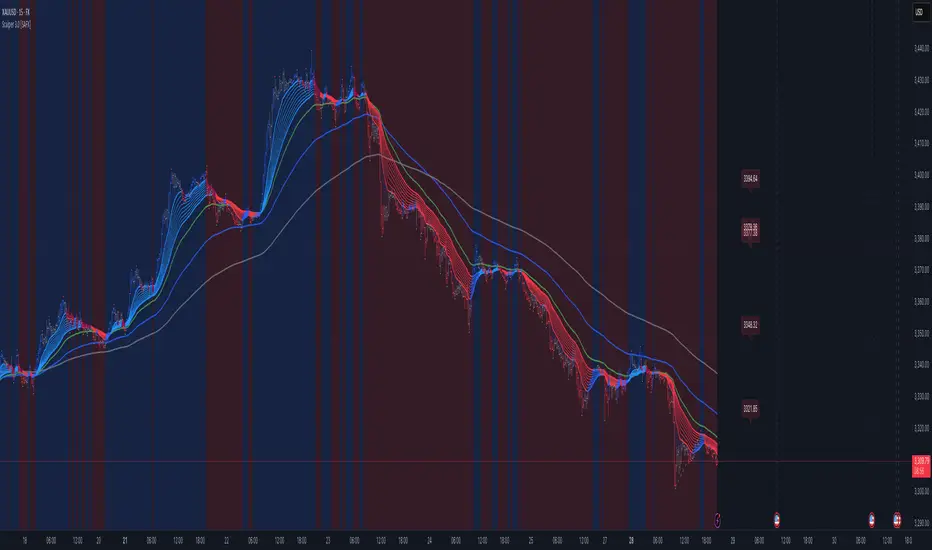
Scalper [SystemAlpha]This is a scalping tool designed for a two pane chart layout.
Includes:
- EMAs
- Price Action Channel
- Bar Color based on PAC, Impulse and TTM
- Pivot HL - Price, Shape, Text
- Pivot Extensions
- Dynamic Support Resistance
Reference:
- Scalping Swing Trading Tool R1-4 by JustUncle
- Support Resistance - Dynamic by LonesomeTheBlue
Buying/Selling Pressure & Trend Strength/Direction (Zeiierman)█ Overview
Buying/Selling Pressure & Trend Strength/Direction (Zeiierman) transforms price behavior into a continuous, evolving map of bullish and bearish pressure. The system breaks every candle into internal buying pressure, selling pressure, net dominance, and the broader structural trend environment. These elements combine into a unified visual structure that reveals how actively each side participates and how organized or fragmented the underlying trend has become.
Long/Short Covered visualization adds an additional layer of insight by highlighting moments when traders unwind positions, often exposing squeeze conditions, exhaustion zones, or developing turning points before they appear in price alone.
⚪ Why This One Is Unique
This system stands out because it reconstructs market pressure from multiple directional components rather than relying on a single trend or momentum source. Instead of treating bullish and bearish movement as a simple up/down outcome, it forms a dual-sided pressure environment that adapts to how each side is behaving relative to its own historical structure. This produces a fluid, context-aware representation of participation that moves with the market instead of fighting it.
The anomaly-based Long/Short Covered component adds another layer of uniqueness. Rather than flagging spikes mechanically, it evaluates how current pressure behavior deviates from expected balance and highlights when traders are being forced out of positions. This produces a highly intuitive map of squeeze events, capitulation, and exhaustion dynamics.
█ Main Features
⚪ Buying/Selling Pressure Candles
Visualize the balance between bullish and bearish pressure as oscillator-style candles. Traders use these to quickly see whether current bars are dominated by buying or selling aggression and how strong that pressure is relative to recent history.
Fast Trend: A highly responsive trend layer that reflects short-term pressure shifts. Use it as the earliest indication of changing momentum and as a guide for deciding whether to participate in the developing pressure move or wait for stronger confirmation.
Core Trend: The underlying long-term pressure trend that reveals the broader market direction. Values above zero indicate a bullish regime, while values below zero indicate a bearish regime. Use the Core Trend to align your trades in the same direction as the dominant market trend.
Strong Trend: Strong Trend highlights periods of unusually intense and extended trend movement. These moves can continue for a while, but they often signal that the trend is becoming stretched. Extended Strong Trend conditions can precede exhaustion, deeper pullbacks, or even full reversals, so traders should remain cautious when these appear.
Established Trend: Identifies areas where market pressure has matured into a well-developed directional trend. Use this as a high-confidence confirmation layer. If the Established Trend begins to fade or stop printing while the price weakens, it can be an early sign that a pullback or reversal is approaching.
⚪ Long/Short Covered
Highlights candles where the pressure structure suggests aggressive unwinding of existing positions (longs or shorts). These zones often align with sharp spikes, squeezes, or capitulation and can be used to time reversals, profit-taking, or fade extreme moves.
⚪ Pressure Changes
Pressure Cross
Pressure Cross events show clear shifts where one side’s pressure overtakes the other. They signal that the balance of force is changing, but they still require confirmation from the Fast or Established Trend before being used as entry triggers or position add-ons.
Pre Signals
Pre Signals appear even earlier and highlight the first hints of pressure building in the opposite direction. They act as early heads-up alerts that may reflect short-term fluctuations, so traders should wait for additional confirmation before treating them as meaningful trend movement.
█ How to Use
⚪ Breakout/Momentum Trading (Buying and Selling Pressure)
Buying and selling pressure is displayed directly through the pressure candlesticks. The stronger the coloring, the stronger the force behind the move. This makes it easy to see which side is in control and whether the market is building enough pressure for a breakout or continuation. Traders can use this to gauge the strength of a move and align their entries with the dominant side of the market.
Breakout Trading
When strong green pressure candles appear as the price approaches resistance, it shows that buyers are actively pushing the breakout. Likewise, strong red pressure candles during a breakdown indicate decisive selling pressure. These surges help confirm whether a breakout has real strength behind it and reduce the chances of entering weak or false moves.
Bullish Breakout
Bearish Breakout
Momentum Trading
The deeper the candle coloration, the stronger the underlying momentum. Intense green candles reflect an accelerating bullish drive, while intense red candles reflect an accelerating bearish drive. Traders can use these moments to enter in the direction of momentum, focusing on strong moves that are more likely to continue.
Note: To capture longer and more sustained momentum moves, increase the candle length above 30.
⚪ Trend Trading
The indicator provides several components to evaluate trend direction and trend maturity. The pressure candlesticks and the Core Trend form the foundation of trend detection, while the Established Trend and Strong Trend features help confirm when a trend has developed into a mature, sustained phase. These layers together help identify trends with a higher likelihood of continuation or potential exhaustion when the move becomes extended.
Note: To capture longer and more sustained trend moves, increase the candle length above 30. You can also raise the Smoothed value into the 10–30 range for additional stability.
Candlesticks or Fast Trend
The pressure candlesticks and the Fast Trend can both be used to read trend direction. When green candles dominate and extend above the +200 region, and the Fast Trend is rising while red candles stay above the −200 region, the market is operating in a bullish environment. When red candles dominate below the −200 region, and the Fast Trend is falling while green candles stay below the +200 region, the environment is bearish. Stronger candle coloration and a firmly aligned Fast Trend both signal stronger trend behavior.
Core Trend
The Core Trend complements the candlesticks by offering a clear background bias. Green histogram bars indicate bullish conditions, while red histogram bars indicate bearish conditions. Traders can use the Core Trend to validate whether the pressure structure aligns with the broader directional bias.
⚪ Pressure Changes
Pressure Changes highlight moments where buying and selling pressure begin shifting from one side to the other. These movements often appear before trend transitions, but they are not trend reversals by default. Instead, they reveal temporary or emerging changes in pressure that may or may not develop into a lasting move. Traders should treat these signals as early information that needs further confirmation.
Pressure Cross events mark clear shifts where one side’s pressure overtakes the other. These events show that the balance of force is changing, but they do not guarantee a sustained trend reversal. Traders should confirm the shift by checking alignment with the Fast Trend, Core Trend, or Established Trend before acting on the signal.
Pre Signals appear even earlier than Pressure Cross events and highlight the first hints of pressure building in the opposite direction. These signals offer early awareness but can represent short-term fluctuations rather than meaningful shifts. Traders should use them as heads-up alerts and rely on additional confirmation tools to determine whether the pressure change will evolve into a genuine trend movement.
⚪ Reversal/Pullback Trading (Long/Short Covered)
Long traders eventually need to sell, and short traders eventually need to buy back. These actions can create meaningful pressure spikes that often appear near reversal zones or trend pullback areas.
Long Covered events tend to occur when long positions are being unwound, often marking potential reversal points or areas where price may find support within an existing uptrend. This can provide early clues that the current move is losing steam or preparing to reset.
Short Covered events tend to occur when short positions are being closed, often appearing near resistance zones or within strong downtrends where the market temporarily retraces. These signals can act as early warnings of pullbacks or exhaustion within broader bearish flows.
⚪ Overbought/Oversold
When the pressure candles reach the upper or lower limits, the market may be entering an extended condition. These zones often precede pauses, pullbacks, or full reversals, depending on the broader context. Traders can treat these boundaries as early caution areas where strong moves may temporarily lose strength.
⚪ Divergence Trading
The pressure candles naturally highlight divergences. When price makes a new high or low but the pressure candles fail to confirm with equally strong activity, it suggests that buying or selling pressure is fading. These divergence patterns can help traders identify potential reversal points or weakening momentum in ongoing trends.
█ How It Works
⚪ Buying/Selling Pressure
The indicator reframes each bar through a two-channel transformation that separately models bullish and bearish pressure. Instead of interpreting movement as a single directional value, the system generates a pair of opposing pressure streams that evolve against each other. This creates a dynamic field where dominance, imbalance, acceleration, and exhaustion can be observed simultaneously.
Calculation: Constructs a bi-directional pressure surface using normalized displacement relationships, volatility-adjusted scaling, and directional competition modeling.
⚪ Adaptive Strength Normalization
To avoid flat readings, each side’s pressure is evaluated relative to its own historical envelope, producing a normalized strength scale. This allows the model to interpret current motion in the context of what has recently been “strong” or “weak,” rather than relying on static reference levels.
Calculation: Applies rolling extremum mapping and nonlinear rescaling, converting raw directional activity into a bounded strength metric that reflects real-time contextual significance.
⚪ Geometric Trend Core Engine
Trend state is derived by combining directional pressure into a geometrically structured core. This core reacts not only to direction but to symmetry, dispersion, and slope of the pressure environment. When the core flattens while pressure expands, the system recognizes structural organization, flagging strong trends.
Calculation: Uses geometric mean transformations and smoothed envelope interactions to build a stable trend backbone that identifies when movement transitions from noise into coordinated directional behavior.
⚪ Long/Short Covered Anomaly
Long/Short Covered events emerge from a comparison of expected vs. actual pressure symmetry. When bullish and bearish gradients diverge beyond a context-defined limit, the system interprets it as forced unwinding or aggressive covering. These anomalies often signal structural stress, squeezes, or capitulation.
Calculation: Implements a bidirectional gradient comparison model, where deviation from the neutral equilibrium curve produces a significance score. If this score exceeds its adaptive threshold, an anomaly event is triggered.
-----------------
Disclaimer
The content provided in my scripts, indicators, ideas, algorithms, and systems is for educational and informational purposes only. It does not constitute financial advice, investment recommendations, or a solicitation to buy or sell any financial instruments. I will not accept liability for any loss or damage, including without limitation any loss of profit, which may arise directly or indirectly from the use of or reliance on such information.
All investments involve risk, and the past performance of a security, industry, sector, market, financial product, trading strategy, backtest, or individual's trading does not guarantee future results or returns. Investors are fully responsible for any investment decisions they make. Such decisions should be based solely on an evaluation of their financial circumstances, investment objectives, risk tolerance, and liquidity needs.
Script a pagamento

Rockstar - Pullback FlagSimple script to identify pullbacks in an uptrend.
Indicator will add yellow flags if ideal conditions are met.
Additionally plots SMA20, SMA50 and SMA200.
Use this indicator in combination with observed price action and your own strategy.
Do no trade blindly on this indicator.
Conditions:
Price above 200MA
50MA above 200MA
20MA near 50MA
RSI reset below 55
Price delta is close to delta between 20MA and 50MA (trying to filter out volatile moves)
Closed price is near 20MA (setting up again for a move)

[Trend] Support- & Resistance Levels/Zones (Expo)- Trend - Support & Resistance Levels/Zones (Expo) automatically identifies and displays support and resistance levels based on the direction of the trend.
Levels/Zones are displayed where there is a high probability that price will find Support in positive trends and Resistance in negative trends.
Trend Cloud and Trend Detection Line can be enabled.
The indicator can be used standalone or as a part of your current trading strategy.
Real-time
No repainting
Works on any market
HOW TO USE
1. Use the indicator to identify where the price can find support and resistance Levels/Zones in trends.
2. Use the indicator to identify the trend direction.
INDICATOR IN ACTION
4 hour chart
I hope you find this indicator useful , and please comment or contact me if you like the script or have any questions/suggestions for future improvements. Thanks!
I will continually work on this indicator, so please share your experience and feedback as it will enable me to make even better improvements. Thanks to everyone that has already contacted me regarding my scripts. Your feedback is valuable for future developments!
ACCESS THE INDICATOR
• Contact me on TradingView or use the links below
-----------------
Disclaimer
Copyright by Zeiierman.
The information contained in my scripts/indicators/ideas does not constitute financial advice or a solicitation to buy or sell any securities of any type. I will not accept liability for any loss or damage, including without limitation any loss of profit, which may arise directly or indirectly from the use of or reliance on such information.
All investments involve risk, and the past performance of a security, industry, sector, market, financial product, trading strategy, or individual’s trading does not guarantee future results or returns. Investors are fully responsible for any investment decisions they make. Such decisions should be based solely on an evaluation of their financial circumstances, investment objectives, risk tolerance, and liquidity needs.
My scripts/indicators/ideas are only for educational purposes!

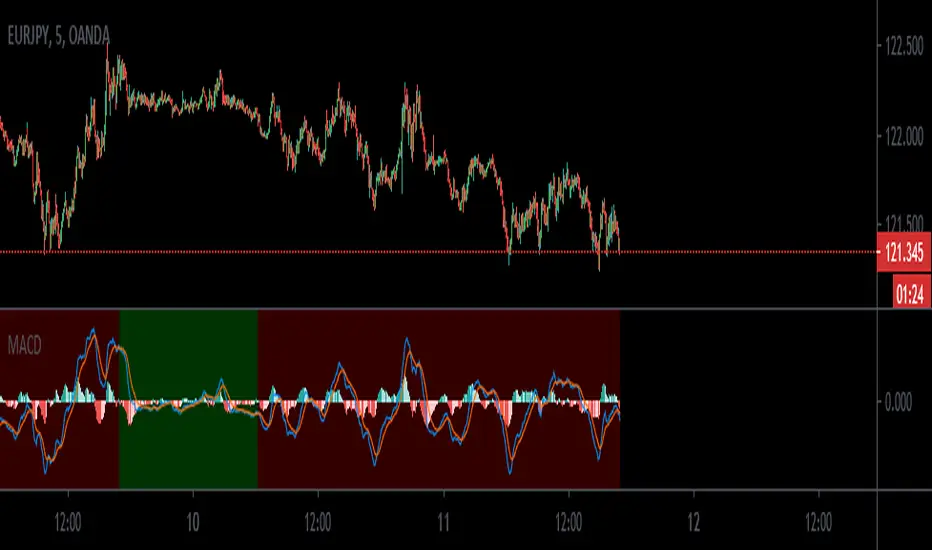
MACD_trendtraderThis is my modified macd indicator. It uses moving averages to determine the trend of the market. It is best used on lower time frames such as 5min and 15min. I found it useful especially with Forex pairs and also traditional markets.
This indicator will help you get in at a pullback in a trending market.
RED background tells you the trend is down. A possible entry happens when you get a sell signal from the macd oscillator above the 0 line.
GREEN background tells you the trend is up. A possible entry happens when you get a buy signal from the macd oscillator below the 0 line.
a couple of examples:
Leave your feedback in the comments. Enjoy:)

Mean Deviation IndexThe Mean Deviation Index (MDX) is used to see how much price is deviating from the mean. This indicator takes both volatility and mean deviation in consideration.
It uses the standard deviation of the ATR to filter an EMA, and uses this as the mean. It then only plots > or < 0 if price is more than one x ATR away from the mean. If index is positive, the background turns green, meaning price is more than 1 x ATR above the mean. If the index is negative, the background turns red, meaning price is more than 1 x ATR below the mean. This setting can be changed by changing the setting "ATR Multiplier", but the default is 1 x ATR.
There are two main ways to use this index.
1. Use it aggressively to find trends (by combining it with other indicators) by entereding each time the background changes color to green for longs or red for shorts.
2. Use it spot breakouts, waiting for a pullback, and then entering on the next move in the same direction. In this context for a short, you wait for the background color to turn green, then wait for the index to pull back, and then enter once it starts moving up again.

Extremes (Expo) Extremes (Expo)
DESCRIPTION
This Extreme (Expo) indicator identifies areas where the market is extreme. The length of the extreme calculation can be changed and gives you the flexibility to choose how sensitive the indicator should be. A longer length means that the indicator only identifies bold extremes. A shorter length is more sensitive and thus identifies all extremes in the market.
When the market is in an extreme mode, keep your trade until the extreme mode ends.
Postive extreme is when the price is above the positive extreme lines. (Keep your long trade until the positive extreme ends).
Negative extreme is when the price is below the negative extreme lines. (Keep your short trade until the negative extreme ends).
The Extremes (Expo) can be used to visualize the trend. Price crossing indicates a directional change. Price can also bounce off the extremes lines, which can act as dynamic support and resistance. It is often used in combination with other signals and analysis techniques.
TREND
The indictor has a Trend- feature that can be switched on which identifies trend shifts as well as trend direction.
A positive trend is when all three trendlines are green, and when the price is at least above one of these three lines.
A Negative trend is when all three trendlines are red, and when the price is at least under one of these three lines.
When the color of the trend lines changes color it indicates that the trend might shift direction. When all three trendlines have shifted color a trend is established.
PULLBACK
A bonus feature that is added to the trend-setting is that it can detect pullbacks in trends. This is visualized by that one of the three trendlines change color. For instance, say that all 3 lines are red (negative trend) and one of these lines changes color to green it can be regarded as a pullback in the negative trend.
HOW TO USE
1. Use the indicator to identify extreme areas.
2. Use the indicator to identify trends.
3. Use the indicator to identify trend shifts.
4. Use the indicator to identify pullbacks in trends.
INDICATOR IN ACTION
EXTREMES
BTCUSD
BTCUSD
TESLA
WALL STREET
TREND & PULLBACK
WALL STREET
EURUSD
I hope you find this indicator useful , and please comment or contact me if you like the script or have any questions/suggestions for future improvements. Thanks!
I will continue to work on this indicator, so please share your experience and feedback with me so that I can continuously improve it. Thanks to everyone that have contacted me regarding my scripts. Your feedback is valuable for future developments!
ACCESS THE INDICATOR
• Contact me on TradingView or use the links below
-----------------
Disclaimer
Copyright by Zeiierman.
The information contained in my scripts/indicators/ideas does not constitute financial advice or a solicitation to buy or sell any securities of any type. I will not accept liability for any loss or damage, including without limitation any loss of profit, which may arise directly or indirectly from use of or reliance on such information.
All investments involve risk, and the past performance of a security, industry, sector, market, financial product, trading strategy, or individual’s trading does not guarantee future results or returns. Investors are fully responsible for any investment decisions they make. Such decisions should be based solely on an evaluation of their financial circumstances, investment objectives, risk tolerance, and liquidity needs.
My scripts/indicators/ideas are only for educational purposes!
