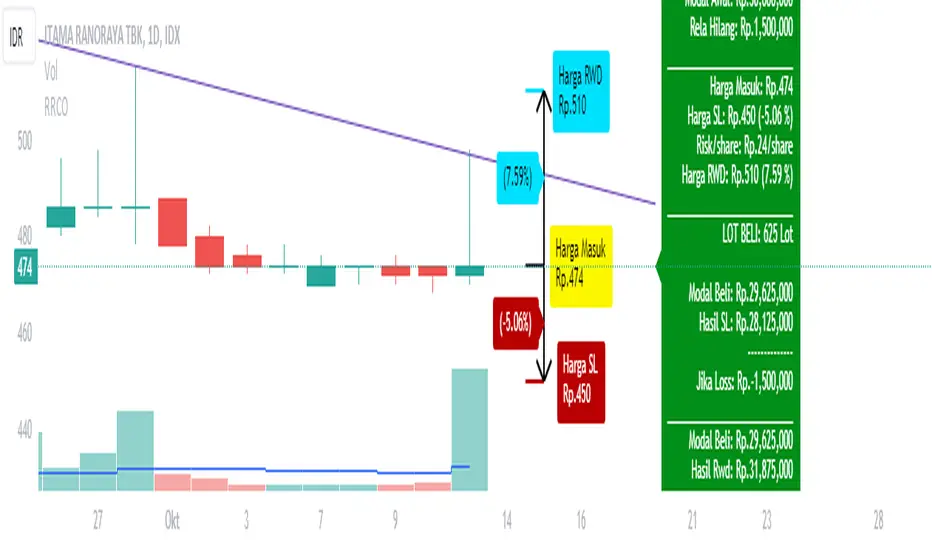
Risk Reward CalculatorPlanning your trading is an important step that you must do before buying the stock.
Risk and Reward Calculator is an important tool for the trader.
With this calculator, you only need to put the capital for one trade and it will automaticaly put the plan for you. But if you want to enter your plan for buy and sell, you just need to check the button and enter the number. the risk and reward calculator will suggest position size based on the information.
The Steps to use Risk Reward Calculator
1. enter how many percentage you can accept if your analysis is wrong.
2. enter how much money you want to trade
3. it will automaticaly calculate the plan for you
4. you can change the reward
5. but if you want to enter your own number, you can check the box. After that enter the number you want for your new plan.
Risk
Futures Risk CalculatorFutures Risk Calculator Script - Description
The Futures Risk Calculator (FRC) is a comprehensive tool designed to help traders effectively manage risk when trading futures contracts. This script allows users to calculate risk/reward ratios directly on the chart by specifying their entry price and stop loss. It's an ideal tool for futures traders who want to quantify their potential losses and gains with precision, based on their trading account size and the number of contracts they trade.
What the Script Does:
1. Risk and Reward Calculation:
The script calculates your total risk in dollars and as a percentage of your account size based on the entry and stop-loss prices you input.
It also calculates two key levels where potential reward (Take Profit 1 and Take Profit 2) can be expected, helping you assess the reward-to-risk ratio for any trade.
2. Customizable Settings:
You can specify the size of your trading account (available $ for Futures trading) and the number of futures contracts you're trading. This allows for tailored risk management that reflects your exact trading conditions.
3. Live Chart Integration:
You add the script to your chart after opening a futures chart in TradingView. Simply click on the chart to set your Entry Price and Stop Loss. The script will instantly calculate and display the risk and reward levels based on the points you set.
Adjusting the entry and stop-loss points later is just as easy: drag and drop the levels directly on the chart, and the risk and reward calculations update automatically.
4. Futures Contract Support:
The script is pre-configured with a list of popular futures symbols (like ES, NQ, CL, GC, and more). If your preferred futures contract isn’t in the list, you can easily add it by modifying the script.
The script uses each symbol’s point value to ensure precise risk calculations, providing you with an accurate dollar risk and potential reward based on the specific contract you're trading.
How to Use the Script:
1. Apply the Script to a Futures Chart:
Open a futures contract chart in TradingView.
Add the Futures Risk Calculator (FRC) script as an indicator.
2. Set Entry and Stop Loss:
Upon applying the script, it will prompt you to select your entry price by clicking the chart where you plan to enter the market.
Next, click on the chart to set your stop-loss level.
The script will then calculate your total risk in dollars and as a percentage of your account size.
3. View Risk, Reward, and (Take Profit):
You can immediately see visual lines representing your entry, stop loss, and the calculated reward-to-risk ratio levels (Take Profit 1 and Take Profit 2).
If you want to adjust the entry or stop loss after plotting them, simply move the points on
the chart, and the script will recalculate everything for you.
4. Configure Account and Contracts:
In the script settings, you can enter your account size and adjust the number of contracts you are trading. These inputs allow the script to calculate risk in monetary terms and as a percentage, making it easier to manage your risk effectively.
5. Understand the Information in the Table:
Once you apply the script, a table will appear in the top-right corner of your chart, providing you with key information about your futures contract and the trade setup. Here's what each field represents:
Account Size: Displays your total account value, which you can set in the script's settings.
Future: Shows the selected futures symbol, along with key details such as its tick size and point value. This gives you a clear understanding of how much one point or tick is worth in dollar terms.
Entry Price: The exact price at which you plan to enter the trade, displayed in green.
Stop Loss Price: The price level where you plan to exit the trade if the market moves against you, shown in red.
Contracts: The number of futures contracts you are trading, which you can adjust in the settings.
Risk: Highlighted in orange, this field shows your total risk in dollars, as well as the percentage risk based on your account size. This is a crucial value to help you stay within your risk tolerance and manage your trades effectively.

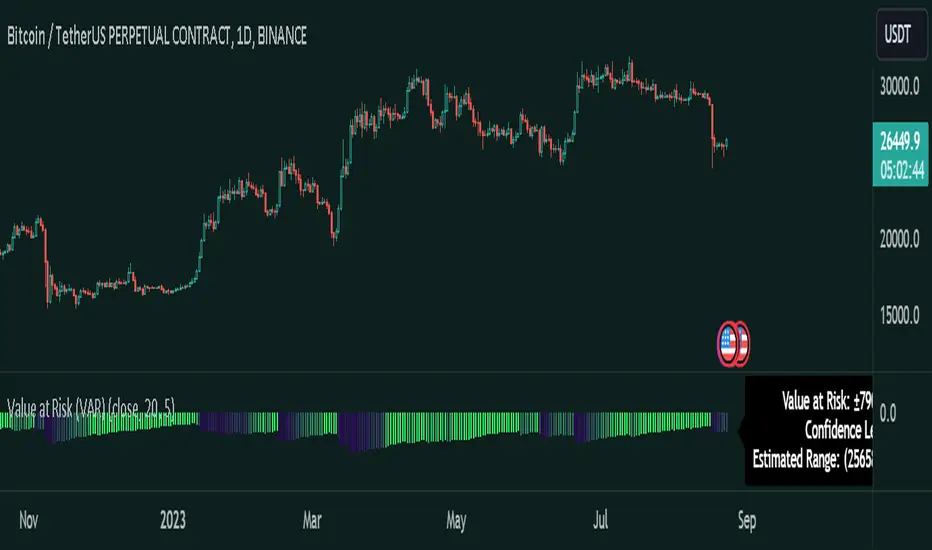
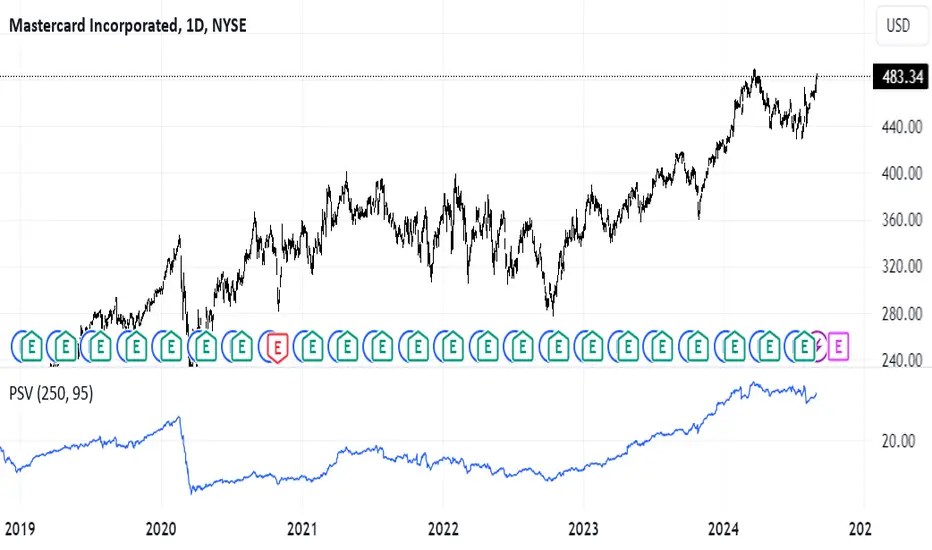
Position Sizer by VolatilityDescription :
The **Position Sizer by Volatility (PSV)** is an indicator that helps traders determine what percentage of their deposit a position will occupy, taking into account the current market volatility. PSV calculates the range of price movements over recent periods and shows how large this movement is compared to historical data. The lower the value, the lower the volatility, and the smaller the stop-loss required relative to the current price.
Explanation of PSV Parameters:
- ` len ` (Period Length):** This parameter sets the number of candles (bars) on the chart that will be used to calculate volatility. For example, if `len` is set to 250, the indicator will analyze price movements over the last 250 bars. The larger the value, the longer the period used for volatility assessment.
- ` percent ` (Percentile):** This parameter determines how strong price fluctuations you want to account for. For instance, if you set `percent` to 95, the indicator will focus on the 5% of instances where the price range was the largest over the specified period. This helps evaluate volatility during periods of sharp price movements, which may require a larger stop-loss. A higher percentile accounts for rarer but stronger movements, and vice versa.
Market Structure Based Stop LossMarket Structure Based Dynamic Stop Loss
Introduction
The Market Structure Based Stop Loss indicator is a strategic tool for traders designed to be useful in both rigorous backtesting and live testing, by providing an objective, “guess-free” stop loss level. This indicator dynamically plots suggested stop loss levels based on market structure, and the concepts of “interim lows/highs.”
It provides a robust framework for managing risk in both long and short positions. By leveraging historical price movements and real time market dynamics, this indicator helps traders identify quantitatively consistent risk levels while optimizing trade returns.
Legend
This indicator utilizes various inputs to customize its functionality, including "Stop Loss Sensitivity" and "Wick Depth," which dictate how closely the stop loss levels hug the price's highs and lows. The stop loss levels are plotted as lines on the trading chart, providing clear visual cues for position management. As seen in the chart below, this indicator dynamically plots stop loss levels for both long and short positions at every point in time.
A “Stop Loss Table” is also included, in order to enhance precision trading and increase backtesting accuracy. It is customizable in both size and positioning.
Case Study
Methodology
The methodology behind this indicator focuses on the precision placement of stop losses using market structure as a guide. It calculates stop losses by identifying the "lowest close" and the corresponding "lowest low" for long setups, and inversely for short setups. By adjusting the sensitivity settings, traders can tweak the indicator's responsiveness to price changes, ensuring that the stop losses are set with a balance between tight risk control and enough room to avoid premature exits due to market noise. The indicator's ability to adapt to different trading styles and time frames makes it an essential tool for traders aiming for efficiency and effectiveness in their risk management strategies.
An important point to make is the fact that the stop loss levels are always placed within the wicks. This is important to avoid what can be described as a “floating stop loss”. A stop loss placed outside of a wick is susceptible to an outsized degree of slippage. This is because traders always cluster their stop losses at high/low wicks, and a stop loss placed outside of this level will inevitably be caught in a low liquidity cascade or “wash-out.” When price approaches a cluster of stop losses, it is highly probable that you will be stopped out anyway, so it is prudent to attempt to be the trader who gets stopped out first in order to avoid high slippage, and losses above what you originally intended.
// For long positions: stop-loss is slightly inside the lowest wick
float dynamic_SL_Long = lowestClose - (lowestClose - lowestLow) * (1 - WickDepth)
// For short positions: stop-loss is slightly inside the highest wick
float dynamic_SL_Short = highestClose + (highestHigh - highestClose) * (1 - WickDepth)
The percentage depth of the wick in which the stop loss is placed is customisable with the “Wick Depth” variable, in order to customize stop loss strategies around the liquidity of the market a trader is executing their orders in.

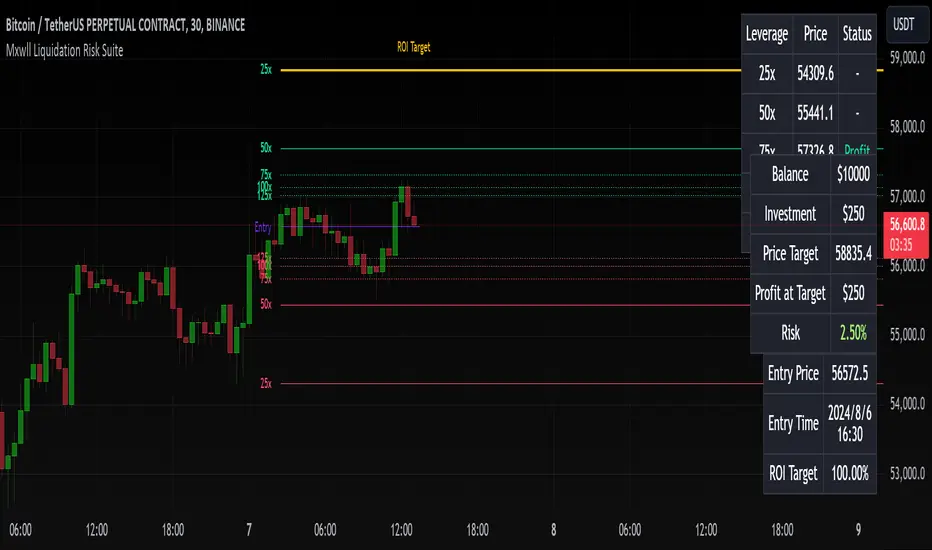
Liquidation Risk Suite [Mxwll]Hello traders 👋
This indicator "Liquidation Risk Suite" hosts various features that allow the trade to determine optimal position sizing, leverage, profit targets, and more!
Features
Customizable entry price and time
From the entry price, a user-defined number of liquidation levels by leverage are shown
From the entry price, a user-defined number of profit targets by leverage are shown
User-defined ROI % target. Liquidation levels and profit targets automatically change to account for the traders' desired profit percentage.
Calculate for long and short positions
Trader can set portfolio balance and investment per trade - indicator will warn the trader when the investment per trade is too high relative to the portfolio balance.
How this script works
The Liquidation Risk Suite is designed to help traders determine position sizing, appropriate risk for their position (leverage, etc.), and potential profit targets from their entry point.
Upon loading the script, the script will prompt you for an entry price and entry time. Simply click the screen at the appropriate locations (your entry price and entry bar) and, from there, the script will calculate various liquidation levels, determine whether your trade has achieved the desired profit at various leverages, and provide various trading metrics such as % risk of portfolio, ROI target %, profit at target, and more!
The image above outlines various trade-related metrics for your position!
These metrics include:
Status of trade (profit or loss) for various common leverage amounts
Portfolio balance
Investment amount
Price target (calculated from desired ROI%)
Profit at target (calculated from desired ROI% and leverage used)
Portfolio risk
Entry price
Entry time
ROI Target %
The image above explains the output of the script, including line style indications!
Solid lines indicate that the leverage used for at your entry price constitutes an active trade. Dotted lines mean the trade has already achieved your profit target for that leverage, or stopped out.
Additionally, the script can calculate pertinent metrics for short positions!
That's all, just a simple, sweet script to help traders figure out what leverage to use for their positions, the risk they're taking on, and potential stop and profit levels!
Thank you to kaigouthro for his colors library!
Partial Profit Calculator [TFO]This indicator was built to help calculate the outcome of trades that utilize multiple profit targets and/or multiple entries.
In its simplest form, we can have a single entry and a single profit target. As shown below in this long trade example, the indicator will draw risk and reward boxes (red and green, respectively) with several annotations. On the left-hand side, all entries will be displayed (in this case there is only one entry, "E1"). On the bottom, the "SL" label indicates the trade's stop loss placement. On the top, all target prices are displayed (in this case there is only one target, "TP1"). Lastly, on the right-hand side a label will display the total R that is to be expected from a winning trade, where R is one's unit of risk.
In the following example, we have two target prices - one at 18600 and one at 18700. You can input as many target prices as you'd like, separated by commas, i.e. "18600,18700" in this example. Make sure the values are separated by commas only, and not spaces, new lines, etc. As a result, we can see that the indicator draws where our profit targets would be with respect to our entry, E1. The indicator assumes that equal parts of the trade position are taken off at each target price. In this example on Nasdaq futures (NQ1!), since we have 2 target prices, this would be equivalent to assuming that we take exactly half the trade position off at TP1, and the remaining half of the position at TP2.
If we wanted to take more of the position off at a certain target, we could simply duplicate the target price. Here I set the target prices to "18600,18600,18700" to enforce that two thirds of the position be taken off at TP1 and TP2, while the remaining third gets taken off at TP3.
We can also show outcome annotations to describe how much R is generated from each possible trade outcome. Using the below chart as an example, the stop loss indicates a -1R loss. The total R from this trade criteria is 1.33 R, and each target price shows how much R is being generated if one were to take off an equal part of the position at said target prices. In this case, we would generate 0.17 R from taking one third of the position off at TP1, another 0.5 R from taking one third of the position off at TP2, and another 0.67 R from taking the remaining one third of the position off at TP3, all adding up to the total R indicated on the right-hand side label.
Using multiple entries works the same way as using multiple target prices, where the input should indicate each entry price separated by commas. In this example I've used "18550,18450" to achieve an average price of 18500, as indicated by the "E_avg" label that appears when more than one entry price is utilized. We can also opt to display risk as dollars instead of R values, where you can input your desired risk per trade, and all values are shown as dollar amounts instead of R multiples, as shown below with a risk per trade of $100.
This is meant to be an educational tool for trades that utilize multiple profit targets and/or entries. Hope you like it!

Macro Risk On/Off SentimentOverview
As an Ichimoku trader, I've always found it crucial to understand the broader market sentiment before entering trades. That's why I developed this Macro Risk On/Off Sentiment Indicator. It's designed to provide a comprehensive view of global market risk sentiment by analysing multiple factors across different asset classes. By combining nine key market indicators, it produces an overall risk sentiment score, giving me a clearer picture of the market's mood before I apply my Ichimoku strategy.
Rationale
While Ichimoku is powerful for identifying trends and potential entry points, I realised it doesn't always capture the broader market context. Markets don't exist in isolation—they're influenced by a myriad of factors including volatility, economic indicators, and cross-asset relationships. By creating this indicator, I aimed to fill that gap, providing myself with a macro view that complements my Ichimoku analysis.
How It Works
The indicator analyses nine different market factors:
VIX (Volatility Index): Measures market expectations of near-term volatility.
S&P 500 Performance: Represents the overall US stock market performance.
US 10-Year Treasury Yield: Indicates bond market sentiment and economic outlook.
Gold Price Movement: Often seen as a safe-haven asset.
US Dollar Index: Measures the strength of the USD against a basket of currencies.
Emerging Markets Performance: Represents risk appetite for higher-risk markets.
High Yield Bond Spreads: Indicates credit market risk sentiment.
Copper/Gold Ratio: An economic growth indicator.
Put/Call Ratio: Measures overall market sentiment based on options trading.
Each factor is assigned a score based on its z-score relative to its recent history, then weighted according to its perceived importance. The overall risk score is a weighted average of these individual scores.
How I Use It
Before applying my Ichimoku strategy, I first check this indicator to gauge the overall market sentiment:
I look at the blue line plotted on the chart, which represents the overall risk score.
I note the background colour: green for risk-on (positive score) and red for risk-off (negative score).
I check the label in the lower-left corner, which provides specific FX pair recommendations and market expectations.
In a risk-on environment (positive score):
I focus on long positions in AUD/JPY, NZD/JPY, EUR/USD, etc.
I look for short opportunities in USD/CAD, USD/NOK, etc.
I expect commodities and yields to rise
In a risk-off environment (negative score):
I focus on long positions in USD/JPY, USD/CHF, USD/CAD
I look for short opportunities in AUD/USD, NZD/USD, EUR/USD
I expect increased volatility and falling yields
The strength of the sentiment is reflected in how close the score is to either 1 (strong risk-on) or -1 (strong risk-off). This helps me gauge how aggressive or conservative I should be with my Ichimoku trades.
Customisation
I've designed this indicator to be flexible. You can modify it to:
Adjust the lookback period and moving average length (both default to 30)
Change the weighting of different factors in the final score calculation
Include or exclude specific factors based on your analysis needs
By combining this Macro Risk On/Off Sentiment Indicator with my Ichimoku analysis, I've found I can make more informed trading decisions, taking into account both the technical setups I see on the chart and the broader market context.

Sharpe and Sortino Ratios█ OVERVIEW
This indicator calculates the Sharpe and Sortino ratios using a chart symbol's periodic price returns, offering insights into the symbol's risk-adjusted performance. It features the option to calculate these ratios by comparing the periodic returns to a fixed annual rate of return or the returns from another selected symbol's context.
█ CONCEPTS
Returns, risk, and volatility
The return on an investment is the relative gain or loss over a period, often expressed as a percentage. Investment returns can originate from several sources, including capital gains, dividends, and interest income. Many investors seek the highest returns possible in the quest for profit. However, prudent investing and trading entails evaluating such returns against the associated risks (i.e., the uncertainty of returns and the potential for financial losses) for a clearer perspective on overall performance and sustainability.
The profitability of an investment typically comes at the cost of enduring market swings, noise, and general uncertainty. To navigate these turbulent waters, investors and portfolio managers often utilize volatility , a measure of the statistical dispersion of historical returns, as a foundational element in their risk assessments because it provides a tangible way to gauge the uncertainty in returns. High volatility suggests increased uncertainty and, consequently, higher risk, whereas low volatility suggests more stable returns with minimal fluctuations, implying lower risk. These concepts are integral components in several risk-adjusted performance metrics, including the Sharpe and Sortino ratios calculated by this indicator.
Risk-free rate
The risk-free rate represents the rate of return on a hypothetical investment carrying no risk of financial loss. This theoretical rate provides a benchmark for comparing the returns on a risky investment and evaluating whether its excess returns justify the risks. If an investment's returns are at or below the theoretical risk-free rate or the risk premium is below a desired amount, it may suggest that the returns do not compensate for the extra risk, which might be a call to reassess the investment.
Since the risk-free rate is a theoretical concept, investors often utilize proxies for the rate in practice, such as Treasury bills and other government bonds. Conventionally, analysts consider such instruments "risk-free" for a domestic holder, as they are a form of government obligation with a low perceived likelihood of default.
The average yield on short-term Treasury bills, influenced by economic conditions, monetary policies, and inflation expectations, has historically hovered around 2-3% over the long term. This range also aligns with central banks' inflation targets. As such, one may interpret a value within this range as a minimum proxy for the risk-free rate, as it may correspond to the minimum rate required to maintain purchasing power over time. This indicator uses a default value of 2% as the risk-free rate in its Sharpe and Sortino ratio calculations. Users can adjust this value from the "Risk-free rate of return" input in the "Settings/Inputs" tab.
Sharpe and Sortino ratios
The Sharpe and Sortino ratios are two of the most widely used metrics that offer insight into an investment's risk-adjusted performance . They provide a standardized framework to compare the effectiveness of investments relative to their perceived risks. These metrics can help investors determine whether the returns justify the risks taken to achieve them, promoting more informed investment decisions.
Both metrics measure risk-adjusted performance similarly. However, they have some differences in their formulas and their interpretation:
1. Sharpe ratio
The Sharpe ratio , developed by Nobel laureate William F. Sharpe, measures the performance of an investment compared to a theoretically risk-free asset, adjusted for the investment risk. The ratio uses the following formula:
Sharpe Ratio = (𝑅𝑎 − 𝑅𝑓) / 𝜎𝑎
Where:
• 𝑅𝑎 = Average return of the investment
• 𝑅𝑓 = Theoretical risk-free rate of return
• 𝜎𝑎 = Standard deviation of the investment's returns (volatility)
A higher Sharpe ratio indicates a more favorable risk-adjusted return, as it signifies that the investment produced higher excess returns per unit of increase in total perceived risk.
2. Sortino ratio
The Sortino ratio is a modified form of the Sharpe ratio that only considers downside volatility , i.e., the volatility of returns below the theoretical risk-free benchmark. Although it shares close similarities with the Sharpe ratio, it can produce very different values, especially when the returns do not have a symmetrical distribution, since it does not penalize upside and downside volatility equally. The ratio uses the following formula:
Sortino Ratio = (𝑅𝑎 − 𝑅𝑓) / 𝜎𝑑
Where:
• 𝑅𝑎 = Average return of the investment
• 𝑅𝑓 = Theoretical risk-free rate of return
• 𝜎𝑑 = Downside deviation (standard deviation of negative excess returns, or downside volatility)
The Sortino ratio offers an alternative perspective on an investment's return-generating efficiency since it does not consider upside volatility in its calculation. A higher Sortino ratio signifies that the investment produced higher excess returns per unit of increase in perceived downside risk.
The risk-free rate (𝑅𝑓) in the numerator of both ratio formulas acts as a baseline for comparing an investment's performance to a theoretical risk-free alternative. By subtracting the risk-free rate from the expected return (𝑅𝑎−𝑅𝑓), the numerator essentially represents the risk premium of the investment.
Comparison with another symbol
In addition to the conventional Sharpe and Sortino ratios, which compare an instrument's returns to a risk-free rate, this indicator can also compare returns to a user-specified benchmark symbol , allowing the calculation of Information ratios .
An Information ratio is a generalized form of the Sharpe ratio that compares an investment's returns to a risky benchmark , such as SPY, rather than a risk-free rate. It measures the investment's active return (the difference between its returns and the benchmark returns) relative to its tracking error (i.e., the volatility of the active return) using the following formula:
𝐼𝑅 = (𝑅𝑝 − 𝑅𝑏) / 𝑇𝐸
Where:
• 𝑅𝑝 = Average return on the portfolio or investment
• 𝑅𝑏 = Average return from the benchmark instrument
• 𝑇𝐸 = Tracking error (volatility of 𝑅𝑝 − 𝑅𝑏)
Comparing returns to a benchmark instrument rather than a theoretical risk-free rate offers unique insights into risk-adjusted performance. Higher Information ratios signify that the investment produced higher active returns per unit of increase in risk relative to the benchmark. Conventional choices for non-risk-free benchmarks include major composite indices like the S&P 500 and DJIA, as the resulting ratios can provide insight into the effectiveness of an investment relative to the broader market.
Users can enable this generalized calculation for both the Sharpe and Sortino ratios by selecting the "Benchmark symbol returns" option from the "Benchmark type" dropdown in the "Settings/Inputs" tab.
It's crucial to note that this indicator compares the charts symbol's rate of change (return) to the rate of change in the benchmark symbol. Consequently, not all symbols available on TradingView are suitable for use with these ratios due to the nature of what their values represent. For instance, using a bond as a benchmark will produce distorted results since each bar's values represent yields rather than prices, meaning it compares the rate of change in the yield. To maintain consistency and relevance in the calculated ratios, ensure the values from the compared symbols strictly represent price information.
█ FEATURES
This indicator provides traders with two widely used metrics for assessing risk-adjusted performance, generalized to allow users to compare the chart symbol's price returns to a fixed risk-free rate or the returns from another risky symbol. Below are the key features of this indicator:
Timeframe selection
The "Returns timeframe" input determines the timeframe of the calculated price returns. Users can select any value greater than or equal to the chart's timeframe. The default timeframe is "1M".
Periodic returns tracking
This indicator compounds and collects requested price returns from the selected timeframe over monthly or daily periods, similar to how the Broker Emulator works when calculating strategy performance metrics on trade data. It employs the following logic:
• Track returns over monthly periods if the chart's data spans at least two months.
• Track returns over daily periods if the chart's data spans at least two days but not two months.
• Do not track or collect returns if the data spans less than two days, as the amount of data is insufficient for meaningful ratio calculations.
The indicator uses the returns collected from up to a specified number of periods to calculate the Sharpe and Sortino ratios, depending on the available historical data. It also uses these periodic returns to calculate the average returns it displays in the Data Window.
Users can control the maximum number of periods the indicator analyzes with the "Max no. of periods used" input in the "Settings/Inputs" tab. The default value is 60 periods.
Benchmark specification
The "Benchmark return type" input specifies the benchmark type the indicator compares to the chart symbol's returns in the ratio calculations. It features the following two options:
• "Risk-free rate of return (%)": Compares the price returns to a user-specified annual rate of return representing a theoretical risk-free rate (e.g., 2%).
• "Benchmark symbol return": Compares the price returns to a selected benchmark symbol (e.g., "AMEX:SPY) to calculate Information ratios.
When comparing a chart symbol's returns to a specified benchmark symbol, this indicator aligns the times of data points from the benchmark with the times of data points from the chart's symbol to facilitate a fair comparison between symbols with different active sessions.
Visualization and display
• The indicator displays the periodic returns requested from the specified "Returns timeframe" in a separate pane. The plot includes dynamic colors to signify positive and negative returns.
• When the "Returns timeframe" value represents a higher timeframe, the indicator displays background highlights on the main chart pane to signify when a new value is available and whether the return is positive or negative.
• When the specified benchmark return type is a benchmark symbol, the indicator displays the requested symbol's returns in the separate pane as a gray line for visual comparison.
• Within the separate pane, the indicator displays a single-cell table that shows the base period it uses for periodic returns, the number of periods it uses in the calculation, the timeframe of the requested data, and the calculated Sharpe and Sortino ratios.
• The Data Window displays the chart symbol and benchmark returns, their periodic averages, and the Sharpe and Sortino ratios.
█ FOR Pine Script™ CODERS
• This script utilizes the functions from our RiskMetrics library to determine the size of the periods, calculate and collect periodic returns, and compute the Sharpe and Sortino ratios.
• The `getAlignedPrices()` function in this script requests price data for the chart's symbol and a benchmark symbol with consistent time alignment by utilizing spread symbols , which helps facilitate a fair comparison between different symbol types. Retrieving prices from spreads avoids potential information loss and data misalignment that can otherwise occur when using separate requests from each symbol's context when those symbols have different sessions or data times.
• For consistency, the `getAlignedPrices()` function includes extended hours and dividend adjustment modifiers in its data requests. Additionally, it includes other settings inherited from the chart's context, such as "settlement-as-close" preferences for fair comparison between futures instruments.
• This script uses the `changePercent()` function from our ta library to calculate the percentage changes of the requested data.
• The newly released `force_overlay` parameter in display-related functions allows indicators to display visuals on the main chart and a separate pane simultaneously. We use the parameter in this script's bgcolor() call to display background highlights on the main chart.
Look first. Then leap.

RiskMetrics█ OVERVIEW
This library is a tool for Pine programmers that provides functions for calculating risk-adjusted performance metrics on periodic price returns. The calculations used by this library's functions closely mirror those the Broker Emulator uses to calculate strategy performance metrics (e.g., Sharpe and Sortino ratios) without depending on strategy-specific functionality.
█ CONCEPTS
Returns, risk, and volatility
The return on an investment is the relative gain or loss over a period, often expressed as a percentage. Investment returns can originate from several sources, including capital gains, dividends, and interest income. Many investors seek the highest returns possible in the quest for profit. However, prudent investing and trading entails evaluating such returns against the associated risks (i.e., the uncertainty of returns and the potential for financial losses) for a clearer perspective on overall performance and sustainability.
One way investors and analysts assess the risk of an investment is by analyzing its volatility , i.e., the statistical dispersion of historical returns. Investors often use volatility in risk estimation because it provides a quantifiable way to gauge the expected extent of fluctuation in returns. Elevated volatility implies heightened uncertainty in the market, which suggests higher expected risk. Conversely, low volatility implies relatively stable returns with relatively minimal fluctuations, thus suggesting lower expected risk. Several risk-adjusted performance metrics utilize volatility in their calculations for this reason.
Risk-free rate
The risk-free rate represents the rate of return on a hypothetical investment carrying no risk of financial loss. This theoretical rate provides a benchmark for comparing the returns on a risky investment and evaluating whether its excess returns justify the risks. If an investment's returns are at or below the theoretical risk-free rate or the risk premium is below a desired amount, it may suggest that the returns do not compensate for the extra risk, which might be a call to reassess the investment.
Since the risk-free rate is a theoretical concept, investors often utilize proxies for the rate in practice, such as Treasury bills and other government bonds. Conventionally, analysts consider such instruments "risk-free" for a domestic holder, as they are a form of government obligation with a low perceived likelihood of default.
The average yield on short-term Treasury bills, influenced by economic conditions, monetary policies, and inflation expectations, has historically hovered around 2-3% over the long term. This range also aligns with central banks' inflation targets. As such, one may interpret a value within this range as a minimum proxy for the risk-free rate, as it may correspond to the minimum rate required to maintain purchasing power over time.
The built-in Sharpe and Sortino ratios that strategies calculate and display in the Performance Summary tab use a default risk-free rate of 2%, and the metrics in this library's example code use the same default rate. Users can adjust this value to fit their analysis needs.
Risk-adjusted performance
Risk-adjusted performance metrics gauge the effectiveness of an investment by considering its returns relative to the perceived risk. They aim to provide a more well-rounded picture of performance by factoring in the level of risk taken to achieve returns. Investors can utilize such metrics to help determine whether the returns from an investment justify the risks and make informed decisions.
The two most commonly used risk-adjusted performance metrics are the Sharpe ratio and the Sortino ratio.
1. Sharpe ratio
The Sharpe ratio , developed by Nobel laureate William F. Sharpe, measures the performance of an investment compared to a theoretically risk-free asset, adjusted for the investment risk. The ratio uses the following formula:
Sharpe Ratio = (𝑅𝑎 − 𝑅𝑓) / 𝜎𝑎
Where:
• 𝑅𝑎 = Average return of the investment
• 𝑅𝑓 = Theoretical risk-free rate of return
• 𝜎𝑎 = Standard deviation of the investment's returns (volatility)
A higher Sharpe ratio indicates a more favorable risk-adjusted return, as it signifies that the investment produced higher excess returns per unit of increase in total perceived risk.
2. Sortino ratio
The Sortino ratio is a modified form of the Sharpe ratio that only considers downside volatility , i.e., the volatility of returns below the theoretical risk-free benchmark. Although it shares close similarities with the Sharpe ratio, it can produce very different values, especially when the returns do not have a symmetrical distribution, since it does not penalize upside and downside volatility equally. The ratio uses the following formula:
Sortino Ratio = (𝑅𝑎 − 𝑅𝑓) / 𝜎𝑑
Where:
• 𝑅𝑎 = Average return of the investment
• 𝑅𝑓 = Theoretical risk-free rate of return
• 𝜎𝑑 = Downside deviation (standard deviation of negative excess returns, or downside volatility)
The Sortino ratio offers an alternative perspective on an investment's return-generating efficiency since it does not consider upside volatility in its calculation. A higher Sortino ratio signifies that the investment produced higher excess returns per unit of increase in perceived downside risk.
█ CALCULATIONS
Return period detection
Calculating risk-adjusted performance metrics requires collecting returns across several periods of a given size. Analysts may use different period sizes based on the context and their preferences. However, two widely used standards are monthly or daily periods, depending on the available data and the investment's duration. The built-in ratios displayed in the Strategy Tester utilize returns from either monthly or daily periods in their calculations based on the following logic:
• Use monthly returns if the history of closed trades spans at least two months.
• Use daily returns if the trades span at least two days but less than two months.
• Do not calculate the ratios if the trade data spans fewer than two days.
This library's `detectPeriod()` function applies related logic to available chart data rather than trade data to determine which period is appropriate:
• It returns true if the chart's data spans at least two months, indicating that it's sufficient to use monthly periods.
• It returns false if the chart's data spans at least two days but not two months, suggesting the use of daily periods.
• It returns na if the length of the chart's data covers less than two days, signifying that the data is insufficient for meaningful ratio calculations.
It's important to note that programmers should only call `detectPeriod()` from a script's global scope or within the outermost scope of a function called from the global scope, as it requires the time value from the first bar to accurately measure the amount of time covered by the chart's data.
Collecting periodic returns
This library's `getPeriodicReturns()` function tracks price return data within monthly or daily periods and stores the periodic values in an array . It uses a `detectPeriod()` call as the condition to determine whether each element in the array represents the return over a monthly or daily period.
The `getPeriodicReturns()` function has two overloads. The first overload requires two arguments and outputs an array of monthly or daily returns for use in the `sharpe()` and `sortino()` methods. To calculate these returns:
1. The `percentChange` argument should be a series that represents percentage gains or losses. The values can be bar-to-bar return percentages on the chart timeframe or percentages requested from a higher timeframe.
2. The function compounds all non-na `percentChange` values within each monthly or daily period to calculate the period's total return percentage. When the `percentChange` represents returns from a higher timeframe, ensure the requested data includes gaps to avoid compounding redundant values.
3. After a period ends, the function queues the compounded return into the array , removing the oldest element from the array when its size exceeds the `maxPeriods` argument.
The resulting array represents the sequence of closed returns over up to `maxPeriods` months or days, depending on the available data.
The second overload of the function includes an additional `benchmark` parameter. Unlike the first overload, this version tracks and collects differences between the `percentChange` and the specified `benchmark` values. The resulting array represents the sequence of excess returns over up to `maxPeriods` months or days. Passing this array to the `sharpe()` and `sortino()` methods calculates generalized Information ratios , which represent the risk-adjustment performance of a sequence of returns compared to a risky benchmark instead of a risk-free rate. For consistency, ensure the non-na times of the `benchmark` values align with the times of the `percentChange` values.
Ratio methods
This library's `sharpe()` and `sortino()` methods respectively calculate the Sharpe and Sortino ratios based on an array of returns compared to a specified annual benchmark. Both methods adjust the annual benchmark based on the number of periods per year to suit the frequency of the returns:
• If the method call does not include a `periodsPerYear` argument, it uses `detectPeriod()` to determine whether the returns represent monthly or daily values based on the chart's history. If monthly, the method divides the `annualBenchmark` value by 12. If daily, it divides the value by 365.
• If the method call does specify a `periodsPerYear` argument, the argument's value supersedes the automatic calculation, facilitating custom benchmark adjustments, such as dividing by 252 when analyzing collected daily stock returns.
When the array passed to these methods represents a sequence of excess returns , such as the result from the second overload of `getPeriodicReturns()`, use an `annualBenchmark` value of 0 to avoid comparing those excess returns to a separate rate.
By default, these methods only calculate the ratios on the last available bar to minimize their resource usage. Users can override this behavior with the `forceCalc` parameter. When the value is true , the method calculates the ratio on each call if sufficient data is available, regardless of the bar index.
Look first. Then leap.
█ FUNCTIONS & METHODS
This library contains the following functions:
detectPeriod()
Determines whether the chart data has sufficient coverage to use monthly or daily returns
for risk metric calculations.
Returns: (bool) `true` if the period spans more than two months, `false` if it otherwise spans more
than two days, and `na` if the data is insufficient.
getPeriodicReturns(percentChange, maxPeriods)
(Overload 1 of 2) Tracks periodic return percentages and queues them into an array for ratio
calculations. The span of the chart's historical data determines whether the function uses
daily or monthly periods in its calculations. If the chart spans more than two months,
it uses "1M" periods. Otherwise, if the chart spans more than two days, it uses "1D"
periods. If the chart covers less than two days, it does not store changes.
Parameters:
percentChange (float) : (series float) The change percentage. The function compounds non-na values from each
chart bar within monthly or daily periods to calculate the periodic changes.
maxPeriods (simple int) : (simple int) The maximum number of periodic returns to store in the returned array.
Returns: (array) An array containing the overall percentage changes for each period, limited
to the maximum specified by `maxPeriods`.
getPeriodicReturns(percentChange, benchmark, maxPeriods)
(Overload 2 of 2) Tracks periodic excess return percentages and queues the values into an
array. The span of the chart's historical data determines whether the function uses
daily or monthly periods in its calculations. If the chart spans more than two months,
it uses "1M" periods. Otherwise, if the chart spans more than two days, it uses "1D"
periods. If the chart covers less than two days, it does not store changes.
Parameters:
percentChange (float) : (series float) The change percentage. The function compounds non-na values from each
chart bar within monthly or daily periods to calculate the periodic changes.
benchmark (float) : (series float) The benchmark percentage to compare against `percentChange` values.
The function compounds non-na values from each bar within monthly or
daily periods and subtracts the results from the compounded `percentChange` values to
calculate the excess returns. For consistency, ensure this series has a similar history
length to the `percentChange` with aligned non-na value times.
maxPeriods (simple int) : (simple int) The maximum number of periodic excess returns to store in the returned array.
Returns: (array) An array containing monthly or daily excess returns, limited
to the maximum specified by `maxPeriods`.
method sharpeRatio(returnsArray, annualBenchmark, forceCalc, periodsPerYear)
Calculates the Sharpe ratio for an array of periodic returns.
Callable as a method or a function.
Namespace types: array
Parameters:
returnsArray (array) : (array) An array of periodic return percentages, e.g., returns over monthly or
daily periods.
annualBenchmark (float) : (series float) The annual rate of return to compare against `returnsArray` values. When
`periodsPerYear` is `na`, the function divides this value by 12 to calculate a
monthly benchmark if the chart's data spans at least two months or 365 for a daily
benchmark if the data otherwise spans at least two days. If `periodsPerYear`
has a specified value, the function divides the rate by that value instead.
forceCalc (bool) : (series bool) If `true`, calculates the ratio on every call. Otherwise, ratio calculation
only occurs on the last available bar. Optional. The default is `false`.
periodsPerYear (simple int) : (simple int) If specified, divides the annual rate by this value instead of the value
determined by the time span of the chart's data.
Returns: (float) The Sharpe ratio, which estimates the excess return per unit of total volatility.
method sortinoRatio(returnsArray, annualBenchmark, forceCalc, periodsPerYear)
Calculates the Sortino ratio for an array of periodic returns.
Callable as a method or a function.
Namespace types: array
Parameters:
returnsArray (array) : (array) An array of periodic return percentages, e.g., returns over monthly or
daily periods.
annualBenchmark (float) : (series float) The annual rate of return to compare against `returnsArray` values. When
`periodsPerYear` is `na`, the function divides this value by 12 to calculate a
monthly benchmark if the chart's data spans at least two months or 365 for a daily
benchmark if the data otherwise spans at least two days. If `periodsPerYear`
has a specified value, the function divides the rate by that value instead.
forceCalc (bool) : (series bool) If `true`, calculates the ratio on every call. Otherwise, ratio calculation
only occurs on the last available bar. Optional. The default is `false`.
periodsPerYear (simple int) : (simple int) If specified, divides the annual rate by this value instead of the value
determined by the time span of the chart's data.
Returns: (float) The Sortino ratio, which estimates the excess return per unit of downside
volatility.

strategy_helpersThis library is designed to aid traders and developers in calculating risk metrics efficiently across different asset types like equities, futures, and forex. It includes comprehensive functions that calculate the number of units or contracts to trade, the value at risk, and the total value of the position based on provided entry prices, stop levels, and risk percentages. Whether you're managing a portfolio or developing trading strategies, this library provides essential tools for risk management. Functions also automatically select the appropriate risk calculation method based on asset type, calculate leverage levels, and determine potential liquidation points for leveraged positions. Perfect for enhancing the precision and effectiveness of your trading strategies.
Library "strategy_helpers"
Provides tools for calculating risk metrics across different types of trading strategies including equities, futures, and forex. Functions allow for precise control over risk management by calculating the number of units or contracts to trade, the value at risk, and the total position value based on entry prices, stop levels, and desired risk percentage. Additional utilities include automatic risk calculation based on asset type, leverage level calculations, and determination of liquidation levels for leveraged trades.
calculate_risk(entry, stop_level, stop_range, capital, risk_percent, trade_direction, whole_number_buy)
Calculates risk metrics for equity trades based on entry, stop level, and risk percent
Parameters:
entry (float) : The price at which the position is entered. Use close if you arent adding to a position. Use the original entry price if you are adding to a position.
stop_level (float) : The price level where the stop loss is placed
stop_range (float) : The price range from entry to stop level
capital (float) : The total capital available for trading
risk_percent (float) : The percentage of capital risked on the trade. 100% is represented by 100.
trade_direction (bool) : True for long trades, false for short trades
whole_number_buy (bool) : True to adjust the quantity to whole numbers
Returns: A tuple containing the number of units to trade, the value at risk, and the total value of the position:
calculate_risk_futures(risk_capital, stop_range)
Calculates risk metrics for futures trades based on the risk capital and stop range
Parameters:
risk_capital (float) : The capital allocated for the trade
stop_range (float) : The price range from entry to stop level
Returns: A tuple containing the number of contracts to trade, the value at risk, and the total value of the position:
calculate_risk_forex(entry, stop_level, stop_range, capital, risk_percent, trade_direction)
Calculates risk metrics for forex trades based on entry, stop level, and risk percent
Parameters:
entry (float) : The price at which the position is entered. Use close if you arent adding to a position. Use the original entry price if you are adding to a position.
stop_level (float) : The price level where the stop loss is placed
stop_range (float) : The price range from entry to stop level
capital (float) : The total capital available for trading
risk_percent (float) : The percentage of capital risked on the trade. 100% is represented by 100.
trade_direction (bool) : True for long trades, false for short trades
Returns: A tuple containing the number of lots to trade, the value at risk, and the total value of the position:
calculate_risk_auto(entry, stop_level, stop_range, capital, risk_percent, trade_direction, whole_number_buy)
Automatically selects the risk calculation method based on the asset type and calculates risk metrics
Parameters:
entry (float) : The price at which the position is entered. Use close if you arent adding to a position. Use the original entry price if you are adding to a position.
stop_level (float) : The price level where the stop loss is placed
stop_range (float) : The price range from entry to stop level
capital (float) : The total capital available for trading
risk_percent (float) : The percentage of capital risked on the trade. 100% is represented by 100.
trade_direction (bool) : True for long trades, false for short trades
whole_number_buy (bool) : True to adjust the quantity to whole numbers, applicable only for non-futures and non-forex trades
Returns: A tuple containing the number of units or contracts to trade, the value at risk, and the total value of the position:
leverage_level(account_equity, position_value)
Calculates the leverage level used based on account equity and position value
Parameters:
account_equity (float) : Total equity in the trading account
position_value (float) : Total value of the position taken
Returns: The leverage level used in the trade
calculate_liquidation_level(entry, leverage, trade_direction, maintenance_margine)
Calculates the liquidation price level for a leveraged trade
Parameters:
entry (float) : The price at which the position is entered
leverage (float) : The leverage level used in the trade
trade_direction (bool) : True for long trades, false for short trades
maintenance_margine (float) : The maintenance margin requirement, expressed as a percentage
Returns: The price level at which the position would be liquidated, or na if leverage is zero

panpanXBT BTC Risk Metric OscillatorThis is the Bitcoin Risk Metric. Inspired by many power law analysts, this script assigns a risk value to the price of Bitcoin. The model uses regression of 'fair value' data to assign risk values and residual analysis to account for diminishing returns as time goes on. This indicator is for long-term investors looking to maximise their returns by highlighting periods of under and overvaluation for Bitcoin.
This is a companion script for panpanXBT BTC Risk Metric . Use this indicator in tandem to achieve the view shown in the chart above.
Please note, this indicator will only work on BTCUSD charts but will work on any timeframe.
DISCLAIMER: The product on offer presents a novel way to view the price history of Bitcoin. It should not be relied upon solely to inform financial decisions. What you do with the information is entirely up to you. Please thoroughly consider your decisions and consult many different sources to make sure you're making the most well-informed decision.
### How to Interpret
The risk scale goes from 0 to 100,
Blue - 0 being low risk, and
Red - 100 being high risk.
Low risk values represent periods of historical undervaluation, while high values represent overvaluation. These periods are marked by a colourscale from blue to red.
### Use Cases and Best Practice
A dynamic DCA strategy would work best with this indicator, whereby an amount of capital is deployed/retired on a regular basis. This amount deployed grows or shrinks depending on the proximity of the risk level to the extremes (0 and 100).
Let's say you have a maximum of $500 to deploy per month.
When risk is between 0 and 10, you could deploy the full $500.
When risk is between 10 and 20, you could deploy $400.
When risk is between 20 and 30, you could deploy $300.
When risk is between 30 and 40, you could deploy $200.
When risk is between 40 and 50, you could deploy $100.
Conversely, when risk is above 50, you could:
Sell 1/15th of your BTC stack when risk is between 50 and 60.
Sell 2/15th of your BTC stack when risk is between 60 and 70.
Sell 3/15th of your BTC stack when risk is between 70 and 80.
Sell 4/15th of your BTC stack when risk is between 80 and 90.
Sell 5/15th of your BTC stack when risk is between 90 and 100.
This framework allows the user to accumulate during periods of undervaluation and derisk during periods of overvaluation, capturing returns in the process.
In contrast, simply setting limit orders at 0 and 100 would yield the absolute maximum returns, however there is no guarantee price will reach these levels (see 2018 where the bear market bottomed out at 20 risk, or 2021 where price topped out at 97 risk).
### Caveats
"All models are wrong, some are useful"
No model is perfect. No model can predict exactly what price will do as there are too many factors at play that determine the outcome. We use models as a guide to make better-informed decisions, as opposed to shooting in the dark. This model is not a get rich quick scheme, but rather a tool to help inform decisions should you consider investing. This model serves to highlight price extremities, which could present opportune times to invest.
### Conclusion
This indicator aims to highlight periods of extreme values for Bitcoin, which may provide an edge in the market for long-term investors.
Thank you for your interest in this indicator. If you have any questions, recommendations or feedback, please leave a comment or drop me a message on TV or twitter. I aim to be as transparent as possible with this project, so please seek clarification if you are unsure about anything.

panpanXBT BTC Risk MetricThis is the Bitcoin Risk Metric. Inspired by many power law analysts, this script assigns a risk value to the price of Bitcoin. The model uses regression of 'fair value' data to assign risk values and residual analysis to account for diminishing returns as time goes on. This indicator is for long-term investors looking to maximise their returns by highlighting periods of under and overvaluation for Bitcoin.
This is a companion script for panpanXBT BTC Risk Metric Oscillator . Use this indicator in tandem to achieve the view shown in the chart above.
Please note, this indicator will only work on BTCUSD charts but will work on any timeframe.
DISCLAIMER: The product on offer presents a novel way to view the price history of Bitcoin. It should not be relied upon solely to inform financial decisions. What you do with the information is entirely up to you. Please thoroughly consider your decisions and consult many different sources to make sure you're making the most well-informed decision.
### How to Interpret
The risk scale goes from 0 to 100,
Blue - 0 being low risk, and
Red - 100 being high risk.
Low risk values represent periods of historical undervaluation, while high values represent overvaluation. These periods are marked by a colourscale from blue to red.
### Use Cases and Best Practice
A dynamic DCA strategy would work best with this indicator, whereby an amount of capital is deployed/retired on a regular basis. This amount deployed grows or shrinks depending on the proximity of the risk level to the extremes (0 and 100).
Let's say you have a maximum of $500 to deploy per month.
When risk is between 0 and 10, you could deploy the full $500.
When risk is between 10 and 20, you could deploy $400.
When risk is between 20 and 30, you could deploy $300.
When risk is between 30 and 40, you could deploy $200.
When risk is between 40 and 50, you could deploy $100.
Conversely, when risk is above 50, you could:
Sell 1/15th of your BTC stack when risk is between 50 and 60.
Sell 2/15th of your BTC stack when risk is between 60 and 70.
Sell 3/15th of your BTC stack when risk is between 70 and 80.
Sell 4/15th of your BTC stack when risk is between 80 and 90.
Sell 5/15th of your BTC stack when risk is between 90 and 100.
This framework allows the user to accumulate during periods of undervaluation and derisk during periods of overvaluation, capturing returns in the process.
In contrast, simply setting limit orders at 0 and 100 would yield the absolute maximum returns, however there is no guarantee price will reach these levels (see 2018 where the bear market bottomed out at 20 risk, or 2021 where price topped out at 97 risk).
### Caveats
"All models are wrong, some are useful"
No model is perfect. No model can predict exactly what price will do as there are too many factors at play that determine the outcome. We use models as a guide to make better-informed decisions, as opposed to shooting in the dark. This model is not a get rich quick scheme, but rather a tool to help inform decisions should you consider investing. This model serves to highlight price extremities, which could present opportune times to invest.
### Conclusion
This indicator aims to highlight periods of extreme values for Bitcoin, which may provide an edge in the market for long-term investors.
Thank you for your interest in this indicator. If you have any questions, recommendations or feedback, please leave a comment or drop me a message on TV or twitter. I aim to be as transparent as possible with this project, so please seek clarification if you are unsure about anything.

Trading TP SL Risk Commission Calculator🎉 Introducing Your Trading TP SL Risk Commission Calculator! 🎉
Hey there, savvy trader! 🚀 Are you looking to enhance your trading game? Meet the Trading TP SL Risk Commission Calculator! This handy tool is here to guide you through the complexities of trading, providing insights into your potential risks and rewards. Let's walk through how you can leverage it for smarter trading decisions!
Setting Up 🛠
Let's get your calculator ready for action:
Lines and Labels Visibility: Flip this switch on to see your Entry, Take Profit (TP), Stop Loss (SL), and Liquidation points displayed on your chart. It's a great way to get a visual summary of your strategy.
Input Your Trade Details: Enter your Entry Price, Take Profit Price, and Stop Loss Price. These figures are crucial for mapping out your trade.
Order Info: Specify your Order Size in USD, the amount of Leverage you're using, and your platform's Commission Rate. This customizes the calculator to fit your unique trading setup.
Customizing Your View 🎨
Table Placement & Size: Pick the location and size for your results table to appear on your screen. Tailor it to your liking, whether you prefer it out of the way or front and center.
Deciphering Your Results 📊
With your inputs in place, the calculator springs into action. Here's what you'll find:
Risk Assessment (with Emojis!): Quickly gauge your risk level with our intuitive emoji system, ranging from "⛔️⛔️⛔️" (very high risk) to "✅✅✅" (very low risk).
Profit and Loss Insights: Understand your potential take-profit gains and stop-loss implications, both as percentages and in USD. We also factor in fees to give you a clear picture.
Liquidation Alert: For those using leverage, the liquidation price calculation is crucial to avoid unpleasant surprises.
Expert Tips 💡
Stay Flexible: Market conditions evolve, so should your strategy. Revisit and adjust your inputs regularly to stay aligned with your trading goals.
Risk Emoji Check: Keep an eye on your risk level emojis. A sea of "⛔️" might signal it's time to reassess your approach.
Use Visual Guides: The on-chart lines and labels offer a quick visual reference to how your current trade measures up against your TP, SL, and liquidation thresholds.
Dive In and Trade Smart! 🚦
This calculator isn't just about making calculations; it's about empowering you to make informed trading decisions. With this tool in your arsenal, you're equipped to navigate the trading waters with confidence and clarity.

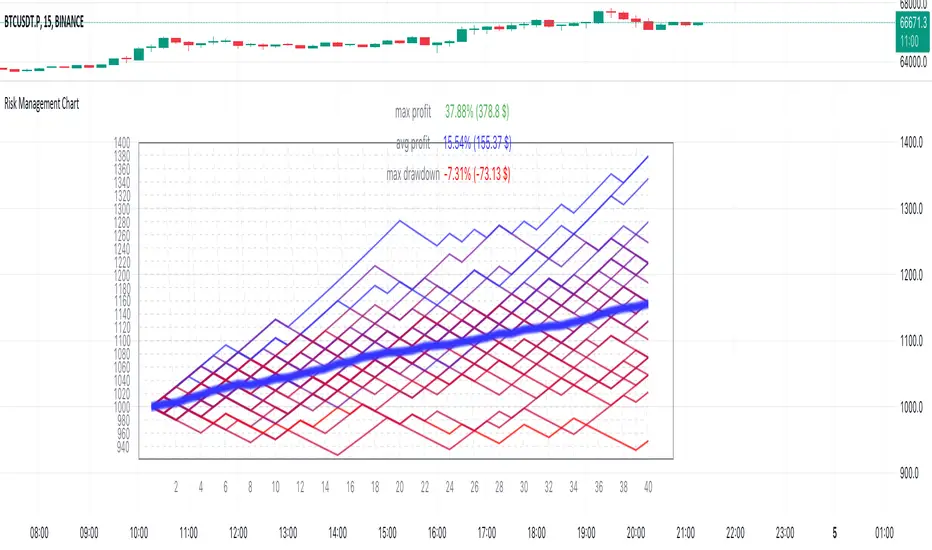
Risk Management Chart█ OVERVIEW
Risk Management Chart allows you to calculate and visualize equity and risk depend on your risk-reward statistics which you can set at the settings.
This script generates random trades and variants of each trade based on your settings of win/loss percent and shows it on the chart as different polyline and also shows thick line which is average of all trades.
It allows you to visualize and possible to analyze probability of your risk management. Be using different settings you can adjust and change your risk management for better profit in future.
It uses compound interest for each trade.
Each variant of trade is shown as a polyline with color from gradient depended on it last profit.
Also I made blurred lines for better visualization with function :
poly(_arr, _col, _t, _tr) =>
for t = 1 to _t
polyline.new(_arr, false, false, xloc.bar_index, color.new(_col, 0 + t * _tr), line_width = t)
█ HOW TO USE
Just add it to the cart and expand the window.
█ SETTINGS
Start Equity $ - Amount of money to start with (your equity for trades)
Win Probability % - Percent of your win / loss trades
Risk/Reward Ratio - How many profit you will get for each risk(depends on risk per trade %)
Number of Trades - How many trades will be generated for each variant of random trading
Number of variants(lines) - How many variants will be generated for each trade
Risk per Trade % -risk % of current equity for each trade
If you have any ask it at comments.
Hope it will be useful.
Market Activity Risk"Market Activity Risk" (MAR) - Is a dynamic tool designed to structurize the competitive landscape of blockchain transaction blocks, offering traders a strategic edge in anticipating market movements.
By capturing where market participants are actively buying and selling, the MAR indicator provides insights into areas of high competition, allowing traders to make informed decisions and potentially front-run transactions.
At the heart of this tool are blockchain transaction fees , they can represent daily shifts in transaction fee pressures.
By measuring momentum in fees, we can analyze the urgency and competition among traders to have their transactions processed first. This indicator is particularly good at revealing potential support or resistance zones, areas where traders are likely to defend their positions or increase their stakes, thus serving as critical junctures for strategic decision-making.
Key Features:
Adaptable Standard Deviation Settings: Users have the flexibility to adjust the length of the standard deviation and its multipliers, managing the risk bands to their individual risk tolerance.
Color-Coded Risk Levels: The MAR indicator employs an intuitive color scheme, making it easy to interpret the data at a glance.
Multi-Currency Compatibility: While designed with Bitcoin in mind, the MAR indicator is versatile, functioning effectively across various cryptocurrencies including Ethereum, XRP, and several other major altcoins. This broad compatibility ensures that traders across different market segments can leverage the insights provided by this tool.
Customizable Moving Average: The 730-day moving average setting is thoughtfully chosen to reflect the nuances of a typical cryptocurrency cycle, capturing long-term trends and fluctuations. However, recognizing the diverse needs and perspectives of traders, the indicator allows for the moving average period to be modified.
Drawdown % (with SMA)This script, titled "Drawdown % (with SMA)" and designed for Pine Script version 5
offers a sophisticated tool for traders to monitor drawdown percentages, a crucial metric in assessing investment risks. The script calculates the drawdown as the percentage decrease from the all-time high value of the selected financial instrument.

Channel CorridorOVERVIEW
The Channel Corridor indicator is designed to operate on a log chart of asset prices (e.g., BTCUSD), specifically on a weekly timeframe.
The intent of the indicator is to provide a visual representation of market dynamics, focusing on a dynamically adjusted corridor around a Simple Moving Average (SMA) of an asset's price. The corridor adapts to changing market conditions. The indicator includes channels within the corridor for additional reference points.
PURPOSE
Trend Identification: The channel corridor can aid in visualising the overall trend, as it dynamically adjusts the corridor based on an SMA and user-defined parameters.
Volatility Assessment: The width of the channel corridor can may act as a gauge of market volatility.
Reversal Points: The channel corridor may signal potential trend reversals or corrections when an asset price approaches the upper or lower bounds of the corridor.
Long-Term Trend Analysis: The channel corridor may aid in longer-term trend analysis.
CONSIDERATIONS
Validation: It's recommended that careful back-testing over historical data be done before acting on any identified opportunities.
User Discretion: Trading decisions should not rely solely on this script. Users should exercise judgment and consider market conditions.
CREDIT
Ideation: Thanks @Sw1ngTr4der for the idea and corridor seed code

ATH Drawdown Indicator by Atilla YurtsevenThe ATH (All-Time High) Drawdown Indicator, developed by Atilla Yurtseven, is an essential tool for traders and investors who seek to understand the current price position in relation to historical peaks. This indicator is especially useful in volatile markets like cryptocurrencies and stocks, offering insights into potential buy or sell opportunities based on historical price action.
This indicator is suitable for long-term investors. It shows the average value loss of a price. However, it's important to remember that this indicator only displays statistics based on past price movements. The price of a stock can remain cheap for many years.
1. Utility of the Indicator:
The ATH Drawdown Indicator provides a clear view of how far the current price is from its all-time high. This is particularly beneficial in assessing the magnitude of a pullback or retracement from peak levels. By understanding these levels, traders can gauge market sentiment and make informed decisions about entry and exit points.
2. Risk Management:
This indicator aids in risk management by highlighting significant drawdowns from the ATH. Traders can use this information to adjust their position sizes or set stop-loss orders more effectively. For instance, entering trades when the price is significantly below the ATH could indicate a higher potential for recovery, while a minimal drawdown from the ATH may suggest caution due to potential overvaluation.
3. Indicator Functionality:
The indicator calculates the percentage drawdown from the ATH for each trading period. It can display this data either as a line graph or overlaid on candles, based on user preference. Horizontal lines at -25%, -50%, -75%, and -100% drawdown levels offer quick visual cues for significant price levels. The color-coding of candles further aids in visualizing bullish or bearish trends in the context of ATH drawdowns.
4. ATH Level Indicator (0 Level):
A unique feature of this indicator is the 0 level, which signifies that the price is currently at its all-time high. This level is a critical reference point for understanding the market's peak performance.
5. Mean Line Indicator:
Additionally, this indicator includes a 'Mean Line', representing the average percentage drawdown from the ATH. This average is calculated over more than a thousand past bars, leveraging the law of large numbers to provide a reliable mean value. This mean line is instrumental in understanding the typical market behavior in relation to the ATH.
Disclaimer:
Please note that this ATH Drawdown Indicator by Atilla Yurtseven is provided as an open-source tool for educational purposes only. It should not be construed as investment advice. Users should conduct their own research and consult a financial advisor before making any investment decisions. The creator of this indicator bears no responsibility for any trading losses incurred using this tool.
Please remember to follow and comment!
Trade smart, stay safe
Atilla Yurtseven

Portfolio HeatThe "Portfolio Heat" indicator offers a visual representation of potential risk exposure for a portfolio across up to eight different symbols. It dynamically calculates three risk metrics based on current price, the number of shares owned, your designated stop loss, and total account size.
Open Dollar Risk – the total dollar amount you will lose if your stop loss is hit.
Open % of Portfolio Risk – the risk as a percentage of your total account size.
Starting Capital Risk – the dollar amount risked based on the difference between the entry price and stop price.
These metrics adjust in real-time, allowing you to monitor and manage risk more effectively.
Open portfolio heat refers to how much you would lose if all your currently held stock positions hit their stop-losses, whether those stop-losses are below what you paid for them - referred to as your “cost basis” - at your cost basis (breakeven) or above your cost basis (in the money). Admittedly, it’s a pretty bad day when all your stops are hit at once, but as traders we need to prepare for the worst. To visualize what “open heat” looks like on a single stock position, please note the chart below:
In the example above you can see that if you were to purchase 100 shares of this stock at a cost-basis of $18/share, and your stop-loss is placed at $15, if the current price of the stock is at $20 and the stock price drops to hit your stop-loss, it would result in a $500 total drawdown in your portfolio. Keep in mind this is just one stock position. Hypothetically, if you were even holding two stocks that had the above open heat, with a $10,000 account size, you could experience a 10% drawdown quite fast if the market corrects.
The “Portfolio Heat” indicator is fully customizable allowing traders to select the number of positions in the portfolio, colors and a detailed or a summary view of risk.
Note if entering a short position, you will enter the number of shares owned as a negative number.

Risk Reward Optimiser [ChartPrime]█ CONCEPTS
In modern day strategy optimization there are few options when it comes to optimizing a risk reward ratio. Users frequently need to experiment and go through countless permutations in order to tweak, adjust and find optimal in their data.
Therefore we have created the Risk Reward Optimizer.
The Risk Reward Optimizer is a technical tool designed to provide traders with comprehensive insights into their trading strategies.
It offers a range of features and functionalities aimed at enhancing traders' decision-making process.
With a focus on comprehensive data, it is there to help traders quickly and efficiently locate Risk Reward optimums for inbuilt of custom strategies.
█ Internal and external Signals:
The script can optimize risk to reward ratio for any type of signals
You can utilize the following :
🔸Internal signals ➞ We have included a number of common indicators into the optimizer such as:
▫️ Aroon
▫️ AO (Awesome Oscillator)
▫️ RSI (Relative Strength Index)
▫️ MACD (Moving Average Convergence Divergence)
▫️ SuperTrend
▫️ Stochastic RSI
▫️ Stochastic
▫️ Moving averages
All these indicators have 3 conditions to generate signals :
Crossover
High Than
Less Than
🔸External signal
▫️ by incorporating your own indicators into the analysis. This flexibility enables you to tailor your strategy to your preferences.
◽️ How to link your signal with the optimizer:
In order to be able to analysis your signal we need to read it and to do so we would need to PLOT your signal with a defined value
plot( YOUR LONG Condition ? 100 : 0 , display = display.data_window)
█ Customizable Risk to Reward Ratios:
This tool allows you to test seven different customizable risk to reward ratios , helping you determine the most suitable risk-reward balance for your trading strategy. This data-driven approach takes the guesswork out of setting stop-loss and take-profit levels.
█ Comprehensive Data Analysis:
The tool provides a table displaying key metrics, including:
Total trades
Wins
Losses
Profit factor
Win rate
Profit and loss (PNL)
This data is essential for refining your trading strategy.
🔸 It includes a tooltip for each risk to reward ratio which gives data for the:
Most Profitable Trade USD value
Most Profitable Trade % value
Most Profitable Trade Bar Index
Most Profitable Trade Time (When it occurred)
Position and size is adjustable
█ Visual insights with histograms:
Visualize your trading performance with histograms displaying each risk to reward ratio trade space, showing total trades, wins, losses, and the ratio of profitable trades.
This visual representation helps you understand the strengths and weaknesses of your strategy.
It offers tooltips for each RR ratio with the average win and loss percentages for further analysis.
█ Dynamic Highlighting:
A drop-down menu allows you to highlight the maximum values of critical metrics such as:
Profit factor
Win rate
PNL
for quick identification of successful setups.
█ Stop Loss Flexibility:
You can adjust stop-loss levels using three different calculation methods:
ATR
Pivot
VWAP
This allows you to align risk-reward ratios with your preferred risk tolerance.
█ Chart Integration:
Visualize your trades directly on your price chart, with each trade displayed in a distinct color for easy tracking.
When your take-profit (TP) level is reached , the tool labels the corresponding risk-reward ratio for that specific TP, simplifying trade management.
█ Detailed Tooltips:
Tooltips provide deeper insights into your trading performance. They include information about the most profitable trade, such as the time it occurred, the bar index, and the percentage gain. Histogram tooltips also offer average win and loss percentages for further analysis.
█ Settings:
█ Code:
In summary, the Risk Reward Optimizer is a data-driven tool that offers traders the ability to optimize their risk-reward ratios, refine their strategies, and gain a deeper understanding of their trading performance. Whether you're a day trader, swing trader, or investor, this tool can help you make informed decisions and improve your trading outcomes.

Equity Trade Risk ManagerEquity Trade Risk Manager is a simple indicator that helps you protect your portfolio by going into each trade risk first !
Equity Trade Risk Manager does this by calculating your ideal position size or ideal stop loss based on your account size, purchase price and risk tolerance. This ensures you are never risking more than your predetermined amount on each trade.
Unlike most position size calculators, that will only tell traders how many shares to purchase, Equity Trade Risk Manger allows the trader to choose whether they want to calculate the ideal number of shares to purchase or where to set the trades stop loss based on the number of shares owned. Not only that, but knowing traders need to act fast, the indicator also gives the option to quickly use the current price and low of the day as an entry and stop. Lastly, your stop loss will be plotted onto the chart for a visual aid.
Features:
Dynamic Risk Settings:
Account Customization: Input your account size to get metrics tailored to you.
Calculation Choices: Decide if you want the tool to calculate the number of shares you should buy or where to set your stop-loss.
Custom Risk Parameters: Use preset risk percentages or set your own to match your comfort level.
Price Point Flexibility:
Enter your entry and stop price or opt to use the current price and the low of the day.
Interactive Display Settings:
Customizable Interface: Adjust table positions, text size, and color schemes to match your trading dashboard aesthetic.
On-Chart Stop-Loss Indication: Visualize your stop loss on the chart itself.
Get a snapshot of your dollar risk, position size, shares to buy, and stop-loss.
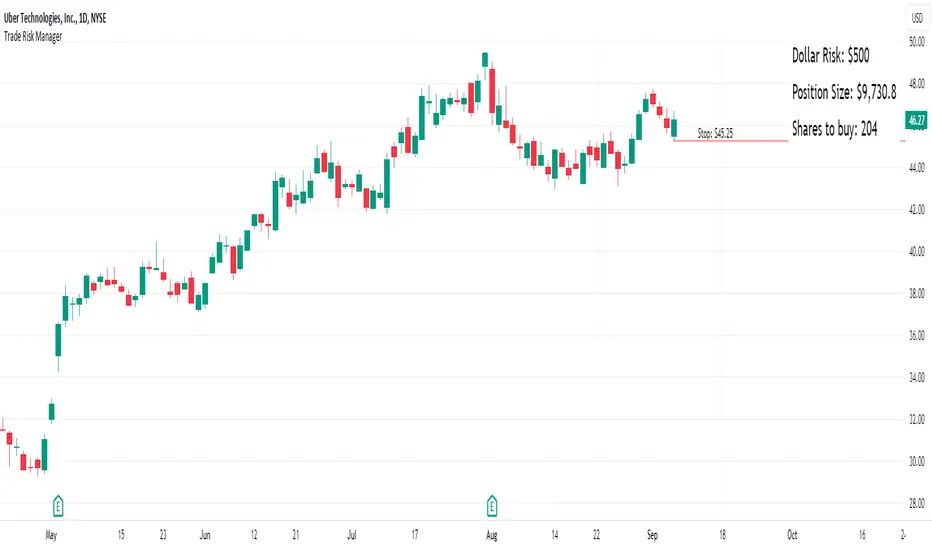
Position and Risk Calculator (for Indices) [dR-Algo]Position and Risk Calculator : Your Ultimate Risk Management Tool for Indices
The difference between a novice and a seasoned trader often comes down to one essential element: risk management. While trading indices, the challenges are even more intense due to market volatility and leverage. The Position and Risk Calculator steps in here to bridge the gap, providing you with an efficient tool designed exclusively for indices trading.
Key Features:
User-Friendly Interface: Designed to integrate effortlessly with your TradingView chart, this tool's interface is intuitive and clutter-free.
Dynamic Price Level Adjustment: Move your Entry, Stop Loss, and Take Profit levels directly on the chart for an interactive experience.
Account Balance Input: Customize the tool to understand your unique financial situation by inputting your current account balance.
Trade Risk Customization: Define how much you're willing to risk per trade, and the tool will do the rest.
Automated Calculations: The indicator calculates the maximum monetary risk and translates it into the maximum lot size you can afford. It delivers a full-integer lot size to make your trading decisions easier.
Comprehensive Risk Evaluation: Beyond lot sizes, it provides you with the Cost-to-Reward Ratio (CRV) of your trade, the actual monetary risk according to the calculated lot size, and the potential profit.
How To Use:
Once you add the Position and Risk Calculator to your TradingView chart, a new interactive panel appears. Here’s how it works:
Set Price Levels: Using draggable lines on the chart, set your Entry Price, Stop Loss, and Take Profit levels.
Account Details: Go to settings and enter your Account Balance and your desired risk percentage per trade.
Automatic Calculations: As soon as the above details are set, the indicator goes to work. It first calculates your maximum risk in monetary terms and then translates that into the maximum lot size you can take for the trade.
Review and Trade: The indicator shows you all the vital statistics - CRV of the trade, the money at risk according to the calculated lot size, and the possible profit.
Why Choose This Tool?
Informed Decisions: Your trading decisions will be based on concrete numbers, removing guesswork.
Time-saving: No need for manual calculations or using separate tools; everything is in one place.
Focus on Trading: By automating the risk management aspect, this tool allows you to focus more on your trading strategy and market analysis.
Tailor-Made for Indices: Unlike many other tools that try to serve all markets, the Position and Risk Calculator is designed specifically for indices trading.
Remember, effective risk management is what separates successful traders from those who burn out. The Position and Risk Calculator not only helps you define your risk but also helps you understand it, empowering you to trade with confidence.
So why not give yourself the best chance of success? Add the Position and Risk Calculator to your TradingView setup and experience the difference it can make.

Value at Risk (VAR)Value at Risk (VAR) is a measure of risk metric in finance used to quantify the potential loss in the value of a portfolio of assets or a single investment in a specific time horizon, given a certain level of confidence.
For instance, lets say there is a VAR of $1000000 at the 95% confidence level in a daily time horizon period, that means that there is a 5% chance that the portfolio will decrease by more than a million within a single day.
Indicator Overview
This indicator calculates the Value at Risk (VAR) using the Variance - Covariance method. On the settings of the indicator you can also determine what significance level you want for the indicator.
Confidence level = 1 - α
α is the significance level.
Basically a 5% significance level will have a 95% Confidence level.
There is also a information tab that displays the Value at Risk (VAR), the Confidence level of the significant level you selected, and an Estimated Range. This is just an estimated range because this is based on returns which follow a normal distributions, unlike price which follows a log normal distribution. So this range will only be obeyed here and then.
Calculation method: Variance - Covariance Method
This method involves the expected return and the standard deviation (volatility). It is based on the assumption that returns follow a normal distribution. For more information on this calculation check this link out.
www.investopedia.com
Applications:
If the calculated Value at Risk (VAR) is high then, that means the risk is high and if the trader has a low risk tolerance then the trader might want to reconsider the trade.
The indicator also lets you see what the potential losses (Long and Short) of the asset can be with the confidence level of your choice.