RSI + STOCH RSI - Marx_CapitalSimple RSI + STOCH RSI indicator in one pane. In addition to the standard 30/70 and 20/80 RSI levels you have three adjustable levels (eg. 0, 50, 100) to indicate STOCH RSI overbought/oversold scenarios.
Rsi-2

[SM-021] Gaussian Trend System [Optimized]This script is a comprehensive trend-following strategy centered around a Gaussian Channel. It is designed to capture significant market movements while filtering out noise during consolidation phases. This version (v2) introduces code optimizations using Pine Script v6 Arrays and a new Intraday Time Control feature.
1. Core Methodology & Math
The foundation of this strategy is the Gaussian Filter, originally conceptualized by @DonovanWall.
Gaussian Poles: Unlike standard moving averages (SMA/EMA), this filter uses "poles" (referencing signal processing logic) to reduce lag while maintaining smoothness.
Array Optimization: In this specific iteration, the f_pole function has been refactored to utilize Pine Script Arrays. This improves calculation efficiency and rendering speed compared to recursive variable calls, especially when calculating deep historical data.
Channel Logic: The strategy calculates a "Filtered True Range" to create High and Low bands around the main Gaussian line.
Long Entry: Price closes above the High Band.
Short Entry: Price closes below the Low Band.
2. Signal Filtering (Confluence)
To reduce false signals common in trend-following systems, the strategy employs a "confluence" approach using three additional layers:
Baseline Filter: A 200-period (customizable) EMA or SMA acts as a regime filter. Longs are only taken above the baseline; Shorts only below.
ADX Filter (Volatility): The Average Directional Index (ADX) is used to measure trend strength. If the ADX is below a user-defined threshold (default: 20), the market is considered "choppy," and new entries are blocked.
Momentum Check: A Stochastic RSI check ensures that momentum aligns with the breakout direction.
3. NEW: Intraday Session Filter
Per user requests, a time-based filter has been added to restrict trading activity to specific market sessions (e.g., the New York Open).
How it works: Users can toggle a checkbox to enable/disable the filter.
Configuration: You can define a specific time range (Default: 09:30 - 16:00) and a specific Timezone (Default: New York).
Logic: The strategy longCondition and shortCondition now check if the current bar's timestamp falls within this window. If outside the window, no new entries are generated, though existing trades are managed normally.
4. Risk Management
The strategy relies on volatility-based exits rather than fixed percentage stops:
ATR Stop Loss: A multiple of the Average True Range (ATR) is calculated at the moment of entry to set a dynamic Stop Loss.
ATR Take Profit: An optional Reward-to-Risk (RR) ratio can be set to place a Take Profit target relative to the Stop Loss distance.
Band Exit: If the trend reverses and price crosses the opposite band, the trade is closed immediately to prevent large drawdowns.
Credits & Attribution
Original Gaussian Logic: Developed by @DonovanWalll. This script utilizes his mathematical formula for the pole filters.
Strategy Wrapper & Array Refactor: Developed by @sebamarghella.
Community Request: The Intraday Session Filter was added to assist traders focusing on specific liquidity windows.
Disclaimer: This strategy is for educational purposes. Past performance is not indicative of future results. Please use the settings menu to adjust the Session Time and Risk parameters to fit your specific asset class.

NeoChartLabs Stochastic RSIOne of our Favorite Indicators - The NeoChart Labs Stochastic RSI
Slowed down and smoothed out to hide the jerky movements of the crypto market.
StochRSI measures where the current RSI value sits relative to its recent high and low range. This provides more frequent signals and is designed to address the issue of the standard RSI remaining at extreme levels for too long. Best when used with 80 / 20
VCAI Stochastic RSI+VCAI Stoch RSI+ is a cleaned-up Stochastic RSI built with V-Core colours for faster, clearer momentum reads and more reliable OB/OS signals.
What it shows:
Purple %K line → bearish momentum strengthening
Yellow %D line → bullish momentum building and smoothing
Soft purple/yellow background bands → OB/OS exhaustion zones, not just raw 80/20 triggers
Midline at 50 → balance point where momentum shifts between bull- and bear-side control
Optional HTF mode → run Stoch RSI from any timeframe while viewing it on your current chart
How to read it:
Both lines rising out of OS → early bullish shift; pullbacks that hold direction favour continuation
Both lines falling from OB → early bearish shift; bounces into the purple OB zone can become fade setups
Lines stacked and moving together → strong, cleaner momentum
Lines crossing repeatedly → low-conviction, choppy conditions
OB/OS shading highlights exhaustion so you focus on moves with context, not every 80/20 tick
Why it’s different:
Classic Stoch RSI is hyper-sensitive and mostly noise.
VCAI Stoch RSI+ applies V-Core’s colour-driven regime logic, controlled OB/OS shading, and optional HTF smoothing so you see momentum structure instead of clutter — making it easier to judge when momentum is genuinely shifting and when it’s just another wiggle.

REMS - Deep SynergyThis is a more flexible version of the REMS Synergy indicator. Like other indicators in the REMS family, it builds upon the foundations assessing the relationships between RSI, EMAs, MACDs, and Stochastic RSI across multiple timeframes. Designed to help traders identify less frequent, but high probability entries across 2 time frames. Uses 3 levels of confluence indicators for both long and short moves.
Features 3 levels of confluence across 2 timeframes. All 3 levels allow filtering of any combination of REMS filters. Features more options and customization than previous REMS Synergy.
Includes VWAP and 4 EMAs as optional visual representations.
Includes 'Enhanced Candles' than can colour code candlesticks for better visual identification. (off by default)
Originally designed with 5 minute and 2 minute timeframes in mind, and pairs well with REMS First Strike and/or REMS Snap Shot indicators.
This version features no hard-coded inputs and allows for more freedom than previous version. With the added flexibility comes the ability for the indicator to be more easily stacked.

Adaptive ATR% Grid + SuperTrend + OrderFlipDescription:
This indicator combines multiple technical analysis tools to identify key price levels and trading signals:
ATR% Grid – automatic plotting of support and resistance levels based on current price and volatility (ATR). Useful for identifying potential targets and entry/exit zones.
SuperTrend – a classic trend indicator with an adaptive ATR multiplier that adjusts based on average volatility.
OrderFlip – identifies price reversal points relative to a moving average with ATR-based sensitivity, optionally filtered by OBV and DMI.
MTF Confirmation – multi-timeframe trend verification using EMA to reduce false signals.
Signal Labels – "LONG" and "SHORT" labels appear on the chart with an offset from the price for better visibility.
JSON Alerts – ready-to-use format for automated alerts, including price, SuperTrend direction, Fair Zone, and ATR%.
Features:
Fully compatible with Pine Script v6
Lines and signals are fixed on the chart, do not shift with new bars
Configurable grid, ATR, SuperTrend, and filter parameters
Works with MTF analysis and classic indicators (OBV/DMI)
Usage:
Best used with additional indicators and risk management strategies. ATR% Grid is ideal for both positional trading and intraday setups.
перевод на русский
Описание:
Этот индикатор объединяет несколько методов технического анализа для выявления ключевых уровней цены и сигналов на покупку/продажу:
Сетка ATR% (ATR% Grid) – автоматическое построение уровней поддержки и сопротивления на основе текущей цены и волатильности (ATR). Позволяет видеть потенциальные цели и зоны входа/выхода.
SuperTrend – классический трендовый индикатор с адаптивным множителем ATR, который корректируется на основе средней волатильности.
OrderFlip – определение моментов разворота цены относительно скользящей средней с учетом ATR, с возможностью фильтрации по OBV и DMI.
MTF-подтверждение – проверка направления тренда на нескольких таймфреймах с помощью EMA, чтобы снизить ложные сигналы.
Сигнальные метки – на графике появляются "LONG" и "SHORT" с отступом от цены для наглядности.
JSON Alerts – готовый формат для автоматических уведомлений, включающий цену, направление SuperTrend, Fair Zone и ATR%.
Особенности:
Поддержка Pine Script v6
Линии и сигналы закреплены на графике, не двигаются при обновлении свечей
Настраиваемые параметры сетки, ATR, SuperTrend и фильтров
Совместимость с MTF-анализом и классическими индикаторами OBV/DMI
Рекомендации:
Используйте в сочетании с другими индикаторами и стратегиями управления риском. Сетка ATR% отлично подходит для позиционной торговли и интрадей.
ATR% Grid – automatic plotting of support and resistance levels based on current price and volatility (ATR). Useful for identifying potential targets and entry/exit zones.
SuperTrend – a classic trend indicator with an adaptive ATR multiplier that adjusts based on average volatility.

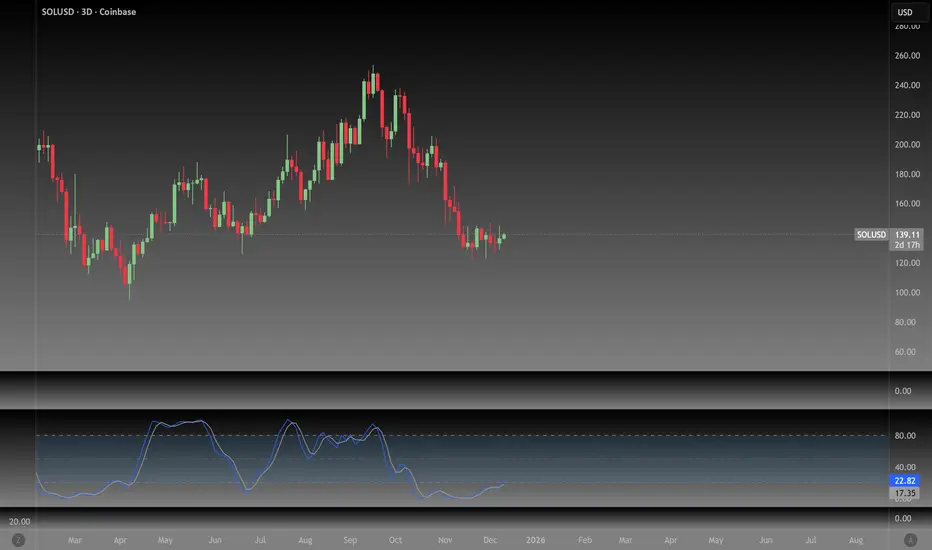
Stochastic BTC OptimizedEnhanced Stochastic for Bitcoin (BTC) – Optimized for Daily Timeframe
This enhanced Stochastic oscillator is specifically fine-tuned for BTC/USD on the 1D timeframe, leveraging historical data from Bitstamp (2011–2025) to minimize false signals and maximize reliability in Bitcoin's volatile swings.
Unlike the classic Stochastic (14, 3, 3), this version uses optimized parameters:
- K Period = 21 – smoother reaction, better suited for BTC’s macro cycles
- D Period = 3, Smooth K = 3 – reduces noise while preserving responsiveness
- Overbought = 85, Oversold = 15 – accounts for BTC’s tendency to trend strongly within extreme zones without immediate reversal
✅ Smart Signal Logic:
Buy/sell signals appear only when %K crosses %D inside the oversold (≤15) or overbought (≥85) zones, and only the first signal is shown to avoid whipsaws.
Visual Enhancements:
- Thick lines when %K/%D are in overbought/oversold zones
- Green/red background highlights on valid signals
- Optional up/down arrows for clear entry visualization
- Customizable colors, line widths, and transparency
🔒 No alerts included – clean, focused on price action and momentum.
💡 Pro Tip: For even higher accuracy, use this indicator in combination with a long-term trend filter (e.g., EMA 200). The oscillator excels in ranging or retracement phases but should not be used alone in strong parabolic moves.
Based on Mozilla Public License v2.0 – feel free to use, modify, and share. Perfect for swing traders and long-term Bitcoin analysts seeking high-probability reversal zones.
перевод на русский
Улучшенный Stochastic для Bitcoin (BTC) — оптимизирован для дневного таймфрейма
Этот улучшенный осциллятор Stochastic специально настроен под BTC/USD на дневном графике, с учётом исторических данных Bitstamp (2011–2025), чтобы минимизировать ложные сигналы и повысить надёжность в условиях высокой волатильности биткоина.
В отличие от классического Stochastic (14, 3, 3), эта версия использует оптимизированные параметры:
- Период K = 21 — более плавная реакция, лучше соответствует макроциклам BTC
- Период D = 3, Сглаживание K = 3 — снижает шум, сохраняя отзывчивость
- Уровень перекупленности = 85, перепроданности = 15 — учитывает склонность BTC к сильным трендам в экстремальных зонах без немедленного разворота
✅ Интеллектуальная логика сигналов:
Покупка/продажа отображается только при пересечении %K и %D внутри зоны перепроданности (≤15) или перекупленности (≥85), и только первый сигнал фиксируется, чтобы избежать «хлыстов».
Улучшенная визуализация:
- Жирные линии, когда %K/%D находятся в экстремальных зонах
- Зелёный/красный фон при появлении сигналов
- Опциональные стрелки для чёткого отображения точек входа
- Настройка цветов, толщины линий и прозрачности
🔒 Без алертов — чистый инструмент, сфокусированный на цене и импульсе.
💡 Совет профессионала: для ещё большей точности используйте этот индикатор вместе с трендовым фильтром (например, EMA 200). Осциллятор лучше всего работает в фазах консолидации или отката, но не стоит применять его в одиночку во время сильных параболических движений.
На основе Mozilla Public License v2.0 — свободно используйте, модифицируйте и делитесь. Идеален для свинг-трейдеров и аналитиков Bitcoin, ищущих зоны с высокой вероятностью разворота.

Stochastic Hash Strat [Hash Capital Research]# Stochastic Hash Strategy by Hash Capital Research
## 🎯 What Is This Strategy?
The **Stochastic Slow Strategy** is a momentum-based trading system that identifies oversold and overbought market conditions to capture mean-reversion opportunities. Think of it as a "buy low, sell high" approach with smart mathematical filters that remove emotion from your trading decisions.
Unlike fast-moving indicators that generate excessive noise, this strategy uses **smoothed stochastic oscillators** to identify only the highest-probability setups when momentum truly shifts.
---
## 💡 Why This Strategy Works
Most traders fail because they:
- **Chase prices** after big moves (buying high, selling low)
- **Overtrade** in choppy, directionless markets
- **Exit too early** or hold losses too long
This strategy solves all three problems:
1. **Entry Discipline**: Only trades when the stochastic oscillator crosses in extreme zones (oversold for longs, overbought for shorts)
2. **Cooldown Filter**: Prevents revenge trading by forcing a waiting period after each trade
3. **Fixed Risk/Reward**: Pre-defined stop-loss and take-profit levels ensure consistent risk management
**The Math Behind It**: The stochastic oscillator measures where the current price sits relative to its recent high-low range. When it's below 25, the market is oversold (time to buy). When above 70, it's overbought (time to sell). The crossover with its moving average confirms momentum is shifting.
---
## 📊 Best Markets & Timeframes
### ⭐ OPTIMAL PERFORMANCE:
**Crude Oil (WTI) - 12H Timeframe**
- **Why it works**: Oil markets have predictable volatility patterns and respect technical levels
**AAVE/USD - 4H to 12H Timeframe**
- **Why it works**: DeFi tokens exhibit strong momentum cycles with clear extremes
### ✅ Also Works Well On:
- **BTC/USD** (12H, Daily) - Lower frequency but high win rate
- **ETH/USD** (8H, 12H) - Balanced volatility and liquidity
- **Gold (XAU/USD)** (Daily) - Classic mean-reversion asset
- **EUR/USD** (4H, 8H) - Lower volatility, requires patience
### ❌ Avoid Using On:
- Timeframes below 4H (too much noise)
- Low-liquidity altcoins (wide spreads kill performance)
- Strongly trending markets without pullbacks (Bitcoin in 2021)
- News-driven instruments during major events
---
## 🎛️ Understanding The Settings
### Core Stochastic Parameters
**Stochastic Length (Default: 16)**
- Controls the lookback period for price comparison
- Lower = faster reactions, more signals (10-14 for volatile markets)
- Higher = smoother signals, fewer trades (16-21 for stable markets)
- **Pro tip**: Use 10 for crypto 4H, 16 for commodities 12H
**Overbought Level (Default: 70)**
- Threshold for short entries
- Lower values (65-70) = more trades, earlier entries
- Higher values (75-80) = fewer but higher-conviction trades
- **Sweet spot**: 70 works for most assets
**Oversold Level (Default: 25)**
- Threshold for long entries
- Higher values (25-30) = more trades, earlier entries
- Lower values (15-20) = fewer but stronger bounce setups
- **Sweet spot**: 20-25 depending on market conditions
**Smooth K & Smooth D (Default: 7 & 3)**
- Additional smoothing to filter out whipsaws
- K=7 makes the indicator slower and more reliable
- D=3 is the signal line that confirms the trend
- **Don't change these unless you know what you're doing**
---
### Risk Management
**Stop Loss % (Default: 2.2%)**
- Automatically exits losing trades
- Should be 1.5x to 2x your average market volatility
- Too tight = death by a thousand cuts
- Too wide = uncontrolled losses
- **Calibration**: Check ATR indicator and set SL slightly above it
**Take Profit % (Default: 7%)**
- Automatically exits winning trades
- Should be 2.5x to 3x your stop loss (reward-to-risk ratio)
- This default gives 7% / 2.2% = 3.18:1 R:R
- **The golden rule**: Never have R:R below 2:1
---
### Trade Filters
**Bar Cooldown Filter (Default: ON, 3 bars)**
- **What it does**: Forces you to wait X bars after closing a trade before entering a new one
- **Why it matters**: Prevents emotional revenge trading and overtrading in choppy markets
- **Settings guide**:
- 3 bars = Standard (good for most cases)
- 5-7 bars = Conservative (oil, slow-moving assets)
- 1-2 bars = Aggressive (only for experienced traders)
**Exit on Opposite Extreme (Default: ON)**
- Closes your long when stochastic hits overbought (and vice versa)
- Acts as an early profit-taking mechanism
- **Leave this ON** unless you're testing other exit strategies
**Divergence Filter (Default: OFF)**
- Looks for price/momentum divergences for additional confirmation
- **When to enable**: Trending markets where you want fewer but higher-quality trades
- **Keep OFF for**: Mean-reverting markets (oil, forex, most of the time)
---
## 🚀 Quick Start Guide
### Step 1: Set Up in TradingView
1. Open TradingView and navigate to your chart
2. Click "Pine Editor" at the bottom
3. Copy and paste the strategy code
4. Click "Add to Chart"
5. The strategy will appear in a separate pane below your price chart
### Step 2: Choose Your Market
**If you're trading Crude Oil:**
- Timeframe: 12H
- Keep all default settings
- Watch for signals during London/NY overlap (8am-11am EST)
**If you're trading AAVE or crypto:**
- Timeframe: 4H or 12H
- Consider these adjustments:
- Stochastic Length: 10-14 (faster)
- Oversold: 20 (more aggressive)
- Take Profit: 8-10% (higher targets)
### Step 3: Wait for Your First Signal
**LONG Entry** (Green circle appears):
- Stochastic crosses up below oversold level (25)
- Price likely near recent lows
- System places limit order at take profit and stop loss
**SHORT Entry** (Red circle appears):
- Stochastic crosses down above overbought level (70)
- Price likely near recent highs
- System places limit order at take profit and stop loss
**EXIT** (Orange circle):
- Position closes either at stop, target, or opposite extreme
- Cooldown period begins
### Step 4: Let It Run
The biggest mistake? **Interfering with the system.**
- Don't close trades early because you're scared
- Don't skip signals because you "have a feeling"
- Don't increase position size after a big win
- Don't revenge trade after a loss
**Follow the system or don't use it at all.**
---
### Important Risks:
1. **Drawdown Pain**: You WILL experience losing streaks of 5-7 trades. This is mathematically normal.
2. **Whipsaw Markets**: Choppy, range-bound conditions can trigger multiple small losses.
3. **Gap Risk**: Overnight gaps can cause your actual fill to be worse than the stop loss.
4. **Slippage**: Real execution prices differ from backtested prices (factor in 0.1-0.2% slippage).
---
## 🔧 Optimization Guide
### When to Adjust Settings:
**Market Volatility Increased?**
- Widen stop loss by 0.5-1%
- Increase take profit proportionally
- Consider increasing cooldown to 5-7 bars
**Getting Too Few Signals?**
- Decrease stochastic length to 10-12
- Increase oversold to 30, decrease overbought to 65
- Reduce cooldown to 2 bars
**Getting Too Many Losses?**
- Increase stochastic length to 18-21 (slower, smoother)
- Enable divergence filter
- Increase cooldown to 5+ bars
- Verify you're on the right timeframe
### A/B Testing Method:
1. **Run default settings for 50 trades** on your chosen market
2. Document: Win rate, profit factor, max drawdown, emotional tolerance
3. **Change ONE variable** (e.g., oversold from 25 to 20)
4. Run another 50 trades
5. Compare results
6. Keep the better version
**Never change multiple settings at once** or you won't know what worked.
---
## 📚 Educational Resources
### Key Concepts to Learn:
**Stochastic Oscillator**
- Developed by George Lane in the 1950s
- Measures momentum by comparing closing price to price range
- Formula: %K = (Close - Low) / (High - Low) × 100
- Similar to RSI but more sensitive to price movements
**Mean Reversion vs. Trend Following**
- This is a **mean reversion** strategy (price returns to average)
- Works best in ranging markets with defined support/resistance
- Fails in strong trending markets (2017 Bitcoin, 2020 Tech stocks)
- Complement with trend filters for better results
**Risk:Reward Ratio**
- The cornerstone of profitable trading
- Winning 40% of trades with 3:1 R:R = profitable
- Winning 60% of trades with 1:1 R:R = breakeven (after fees)
- **This strategy aims for 45% win rate with 2.5-3:1 R:R**
### Recommended Reading:
- *"Trading Systems and Methods"* by Perry Kaufman (Chapter on Oscillators)
- *"Mean Reversion Trading Systems"* by Howard Bandy
- *"The New Trading for a Living"* by Dr. Alexander Elder
---
## 🛠️ Troubleshooting
### "I'm not seeing any signals!"
**Check:**
- Is your timeframe 4H or higher?
- Is the stochastic actually reaching extreme levels (check if your asset is stuck in middle range)?
- Is cooldown still active from a previous trade?
- Are you on a low-liquidity pair?
**Solution**: Switch to a more volatile asset or lower the overbought/oversold thresholds.
---
### "The strategy keeps losing money!"
**Check:**
- What's your win rate? (Below 35% is concerning)
- What's your profit factor? (Below 0.8 means serious issues)
- Are you trading during major news events?
- Is the market in a strong trend?
**Solution**:
1. Verify you're using recommended markets/timeframes
2. Increase cooldown period to avoid choppy markets
3. Reduce position size to 5% while you diagnose
4. Consider switching to daily timeframe for less noise
---
### "My stop losses keep getting hit!"
**Check:**
- Is your stop loss tighter than the average ATR?
- Are you trading during high-volatility sessions?
- Is slippage eating into your buffer?
**Solution**:
1. Calculate the 14-period ATR
2. Set stop loss to 1.5x the ATR value
3. Avoid trading right after market open or major news
4. Factor in 0.2% slippage for crypto, 0.1% for oil
---
## 💪 Pro Tips from the Trenches
### Psychological Discipline
**The Three Deadly Sins:**
1. **Skipping signals** - "This one doesn't feel right"
2. **Early exits** - "I'll just take profit here to be safe"
3. **Revenge trading** - "I need to make back that loss NOW"
**The Solution:** Treat your strategy like a business system. Would McDonald's skip making fries because the cashier "doesn't feel like it today"? No. Systems work because of consistency.
---
### Position Management
**Scaling In/Out** (Advanced)
- Enter 50% position at signal
- Add 50% if stochastic reaches 10 (oversold) or 90 (overbought)
- Exit 50% at 1.5x take profit, let the rest run
**This is NOT for beginners.** Master the basic system first.
---
### Market Awareness
**Oil Traders:**
- OPEC meetings = volatility spikes (avoid or widen stops)
- US inventory reports (Wed 10:30am EST) = avoid trading 2 hours before/after
- Summer driving season = different patterns than winter
**Crypto Traders:**
- Monday-Tuesday = typically lower volatility (fewer signals)
- Thursday-Sunday = higher volatility (more signals)
- Avoid trading during exchange maintenance windows
---
## ⚖️ Legal Disclaimer
This trading strategy is provided for **educational purposes only**.
- Past performance does not guarantee future results
- Trading involves substantial risk of loss
- Only trade with capital you can afford to lose
- No one associated with this strategy is a licensed financial advisor
- You are solely responsible for your trading decisions
**By using this strategy, you acknowledge that you understand and accept these risks.**
---
## 🙏 Acknowledgments
Strategy development inspired by:
- George Lane's original Stochastic Oscillator work
- Modern quantitative trading research
- Community feedback from hundreds of backtests
Built with ❤️ for retail traders who want systematic, disciplined approaches to the markets.
---
**Good luck, stay disciplined, and trade the system, not your emotions.**

Range Oascilator + LessDivergences + MACD+StochRSIRange Oscillator + EMA Filter
Calculates a custom oscillator based on the highest high and lowest low over a chosen period.
Generates BUY signals when the oscillator crosses up from the oversold zone and price is above the EMA.
Generates SELL signals when the oscillator crosses down from the overbought zone and price is below the EMA.
MACD (3‑10‑16 EMA Settings)
Uses fast EMA = 3, slow EMA = 10, signal EMA = 16.
Detects bullish and bearish crossovers.
These crossovers only trigger a single unified buy/sell signal if they coincide with Stochastic RSI being in oversold (for buy) or overbought (for sell) zones.
Stochastic RSI
Standard calculation with %K and %D smoothing.
Defines oversold (<20) and overbought (>80) zones.
Used both for divergence detection and as a filter for MACD signals.
Divergence Detection
RSI Divergence: Price makes a lower low but RSI makes a higher low (bullish), or price makes a higher high but RSI makes a lower high (bearish).
MACD Histogram Divergence: Price makes a lower low but MACD histogram makes a higher low (bullish), or price makes a higher high but MACD histogram makes a lower high (bearish).
Stochastic RSI Divergence: Similar logic applied to %K line.
Divergences are flagged only once per pivot to avoid repetitive signals.
Visuals
EMA plotted on chart.
BUY/SELL signals shown as triangles above/below bars.
Divergences shown as labels (e.g., “RSI BullDiv”, “MACD BearDiv”).
Unified MACD+Stoch RSI signals shown in distinct colors (lime for buy, orange for sell).

MACD + StochasticMACD + Stochastic 14 Scenarios - Complete Signal Analysis
Combines MACD and Stochastic Oscillator to identify 14 different market scenarios based on crossover timing and indicator positioning.
🎯 Signal Strength Classification:
• STRONG (⭐⭐⭐⭐⭐): Both indicators cross together - highest confidence
• MODERATE (⭐⭐⭐⭐): One crosses while other confirms - good confidence
• WEAK (⭐⭐): Conflicting signals - low confidence
📊 Visual Features:
✓ Color-coded shapes on chart (triangles, circles, X marks)
✓ Scenario labels (1-16, excluding 12 & 14)
✓ Real-time info table showing current status
✓ Customizable signal display (show/hide by strength)
✓ Built-in alerts for all signal types
Perfect for swing traders and position traders looking for high-probability entries with dual indicator confirmation. Use on daily
timeframe for best results.
Includes toggleable display options for strong, moderate, and weak signals.

Hyper Strength Index | QuantLapse🧠 Hyper Strength Index (HSI) | QuantLapse
Overview:
The Hyper Strength Index (HSI) is a composite momentum oscillator designed to unify multiple strength measures into a single, adaptive framework. It combines the Relative Strength Index (RSI), Chande Momentum Oscillator (CMO), Money Flow Index (MFI), and Stochastic RSI to deliver a refined, multidimensional view of market momentum and overbought/oversold conditions.
Unlike traditional oscillators that rely on a single formula, the HSI averages four distinct momentum perspectives — price velocity, directional conviction, volume participation, and stochastic behavior — offering traders a more balanced and noise-resistant reading of market strength.
⚙️ Calculation Logic:
The Hyper Strength Index is computed as the normalized average of:
📈 RSI — classic measure of relative momentum.
💪 CMO — captures directional bias and intensity of moves.
💵 MFI — integrates volume and money flow pressure.
🔄 Stochastic RSI (K-line) — identifies momentum extremes and short-term turning points.
This fusion creates a smoother, more comprehensive signal, mitigating the weaknesses of any single oscillator.
🎯 Interpretation:
Overbought Zone (Default: > 75):
Indicates potential exhaustion of bullish momentum — a cooling phase or reversal may follow.
Oversold Zone (Default: < 7):
Suggests bearish exhaustion — a rebound or accumulation phase may emerge.
Neutral Zone (Between 7 and 75):
Represents balanced market conditions or trend continuation phases.
Visual cues highlight key conditions:
🔺 Red Highlights — Overbought regions or downward inflection points.
🔻 Green Highlights — Oversold regions or upward inflection points.
Neutral zones are shaded with subtle gray backgrounds for clarity.
💡 Key Features:
🔹 Multi-factor strength analysis (RSI + CMO + MFI + StochRSI).
🔹 Adaptive overbought/oversold detection.
🔹 Visual alerts via colored backgrounds and bar markers.
🔹 Customizable smoothing and length parameters for fine-tuning sensitivity.
🔹 Intuitive visualization ideal for both short-term scalping and swing trading setups.
🧭 Usage Notes:
Works best as a momentum confirmation tool — pair with trend filters like EMA, SuperTrend, or ADX.
In trending markets, use crossovers from extreme zones as potential continuation or exhaustion signals.
In ranging markets, exploit overbought/oversold reversals for high-probability mean reversion trades.
📘 Summary:
The Hyper Strength Index | QuantLapse distills multiple dimensions of market strength into a single, cohesive oscillator. By merging price, volume, and directional momentum, it provides traders with a more robust, responsive, and context-aware perspective on market dynamics — a next-generation evolution beyond the limitations of RSI or CMO alone.

REMS Synergy OverlayThis 3rd generation REMS indicator builds upon the foundations assessing the relationships between RSI, EMAs, MACDs, and Stochastic RSI across multiple timeframes. Designed to help traders identify less frequent, but high probability entries across 2 time frames. Uses 3 levels of confluence indicators for both long and short moves.
Confluence Level 1 (Highest Conviction):
Evaluates selected criteria across both timeframes. All selected criteria must be in confluence to trigger signal.
Confluence Level 2 (Moderate Conviction):
Selected criteria can be selected by each timeframe individually. All selected criteria must be in confluence to trigger signal.
Confluence Level 3 (Lower/supportive confluence):
Of the selected criteria, this level can evaluate a set number of conditions that must be met. Number of conditions is user-defined.
Includes VWAP and 4 EMAs as optional visual representations.
Includes 'Enhanced Candles' than can colour code candlesticks for better visual identification. (off by default)
Originally designed with 5 minute and 2 minute timeframes in mind, and pairs well with REMS First Strike and/or REMS Snap Shot indicators.
Values coded below:
RSI
-Primary: Length = 14, Smoothing = 20 (via SMA)
-Secondary: Length = 7, Smoothing = 20 (via SMA)
Stochastic RSI
Primary:
-RSI Length = 14
-Stochastic Length = 8
-%K = 3, %D = 3
Secondary:
-RSI Length = 7
-Stochastic Length = 7
-%K = 3, %D = 2
MACD - applied to both timeframes
-Fast = 12, Slow = 26, Signal = 9

AI Bot Regime Feed (v6) — stableThis indicator generates real-time, structured JSON alerts for external trading bots or automation systems.
It combines multiple technical layers to identify market regimes and high-probability buy/sell events, and sends them to any webhook endpoint (e.g., a FastAPI or Zapier listener).

Stoch + RSI DashboardIndicator Description
MTF Stochastic + RSI Dashboard FLEX with STRONG Alerts
A compact, multi-timeframe dashboard that shows Stochastic %K/%D, RSI and signal states across user-defined timeframes. Columns can be toggled on/off to keep the panel as small as you need. Signal texts and colors are fully customizable. The table can be placed in any chart corner, and the background color & opacity are adjustable for perfect readability.
What it shows
• For each selected timeframe: %K, %D, a signal cell (Bullish/Bearish/Strong), RSI value, and RSI state (Overbought/Oversold/Neutral).
• Timeframes are displayed as friendly labels (e.g., 60 → 1h, W → 1w, 3D → 3d).
Signals & logic
• Bullish/Bearish when %K and %D show a sufficient gap (or an optional confirmed cross).
• Strong Bullish when both %K and %D are below the “Strong Bullish max” threshold.
• Strong Bearish when both %K and %D are above the “Strong Bearish min” threshold.
• Optional confirmation: RSI < 30 for Strong Bullish, RSI > 70 for Strong Bearish.
Alerts
• Global alerts for any selected timeframes when a STRONG BULLISH or STRONG BEARISH event occurs.
Key options
• Column visibility toggles (TF, %K, %D, Signal, RSI, RSI Status).
• Custom signal texts & colors.
• Dashboard position: top-left / top-right / bottom-left / bottom-right.
• Table background color + opacity (0 = opaque, 100 = fully transparent).
• Sensitivity (minimum %K–%D gap) and optional “cross-only” mode.
• Customizable timeframes for display and for alerts.
Default settings
• Stochastic: K=5, D=3, SmoothK=3
• RSI length: 14
• Decimals: 1
• Strong Bullish max: 20
• Strong Bearish min: 80
• Default TFs & alerts: 3m, 15m, 1h, 3h, 6h, 12h, 1d, 3d, 1w

3X Sniper BotThe 3X Sniper Bot is built for traders who demand clarity, precision, and confidence in their decision-making. This tool isn’t just another crossover script—it’s a full multi-confirmation system that helps you spot momentum shifts, identify high-probability entries, and filter out the noise.
🔥 Why traders love it:
Triple confirmation engine: Only fires when multiple conditions align, reducing false signals.
Strong vs. Regular vs. Possible setups: Get nuanced alerts that distinguish between high-conviction moves and early opportunities.
Both Buy & Sell coverage: Stay prepared in any market environment.
Smart flexibility: Works across strict or sequenced signal modes, giving you control over how conservative or aggressive you want to trade.
Visual clarity: Clean chart markers and optional regime shading keep your screen easy to read at a glance.
Alert-ready: Set and forget—never miss a move with real-time TradingView alerts.
This indicator was designed to make complex multi-factor analysis simple, giving traders a clear visual edge without clutter or guesswork. Whether you scalp intraday or swing multi-day, the 3X Sniper Bot adapts to your style.

Cardwell RSI by TQ📌 Cardwell RSI – Enhanced Relative Strength Index
This indicator is based on Andrew Cardwell’s RSI methodology , extending the classic RSI with tools to better identify bullish/bearish ranges and trend dynamics.
In uptrends, RSI tends to hold between 40–80 (Cardwell bullish range).
In downtrends, RSI tends to stay between 20–60 (Cardwell bearish range).
Key Features :
Standard RSI with configurable length & source
Fast (9) & Slow (45) RSI Moving Averages (toggleable)
Cardwell Core Levels (80 / 60 / 40 / 20) – enabled by default
Base Bands (70 / 50 / 30) in dotted style
Optional custom levels (up to 3)
Alerts for MA crosses and level crosses
Data Window metrics: RSI vs Fast/Slow MA differences
How to Use :
Monitor RSI behavior inside Cardwell’s bullish (40–80) and bearish (20–60) ranges
Watch RSI crossovers with Fast (9) and Slow (45) MAs to confirm momentum or trend shifts
Use levels and alerts as confluence with your trading strategy
Default Settings :
RSI Length: 14
MA Type: WMA
Fast MA: 9 (hidden by default)
Slow MA: 45 (hidden by default)
Cardwell Levels (80/60/40/20): ON
Base Bands (70/50/30): ON

Signalgo VSignalgo V: Technical Overview and Unique Aspects
Signalgo V is a technical indicator for TradingView that integrates multiple layers of analysis: moving averages, MACD, Bollinger Bands and RSI to deliver buy and sell signals. Below is an informational breakdown of how the indicator functions, its input parameters, signal logic, exit methodology, and how it stands apart from traditional moving average (MA) tools, without disclosing specifics that allow for code duplication.
How Signalgo V Works
1. Multi-Layered Technical Synthesis
Signalgo V processes several technical studies simultaneously:
Fast/Slow Moving Averages: Uses either EMA or SMA (user-selected) with adjustable periods. These are central to initial trend detection through crossovers.
MACD Filter: MACD line vs. signal line cross-check ensures trend direction is supported by both momentum and MA structure.
RSI Confirmation: The RSI is monitored to verify that signals are not excessively overbought or oversold, tuning the system to changing momentum regimes.
Bollinger Bands Context: Entry signals are only considered when price action is beyond the Bollinger Bands envelope, which further filters for unusually strong movements.
These strict, multi-indicator entry criteria are designed to ensure only the most robust signals are surfaced, each is contingent on the presence of aligned trend, momentum and volatility.
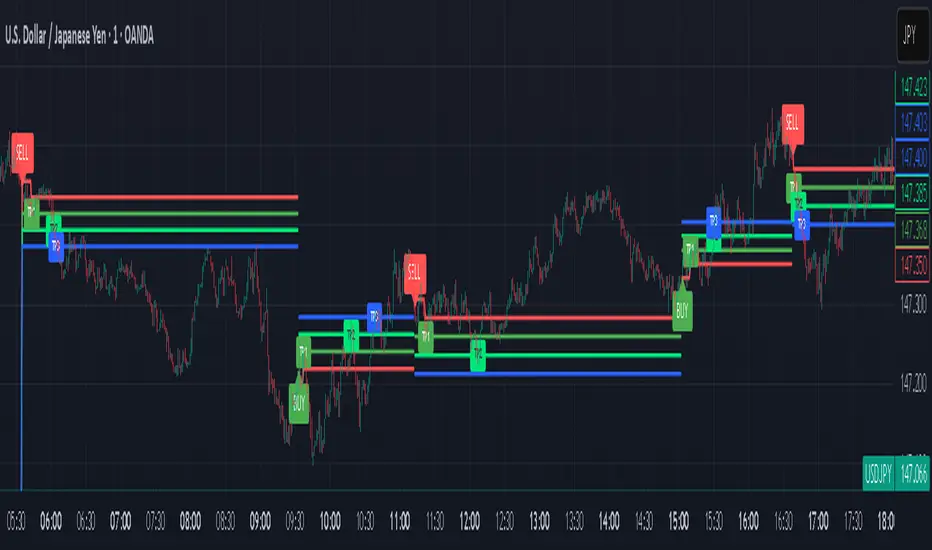
2. Exit Methodology
Take-Profit Levels: After entering a trade, the strategy automatically sets three predefined profit targets (TP1, TP2, TP3). If the price reaches any of these targets, the system marks it, helping you lock in profits at different stages.
Stop-Loss System: Simultaneously, a stop-loss (SL) value is set, protecting you from significant losses if the market moves against your position.
Dynamic Adjustment: When the first profit target (TP1) is hit, the system can automatically move the stop-loss to your entry price. This means your worst-case outcome is break-even from that point, reducing downside risk.
Trailing Stop-Loss: After TP1 is reached, a dynamic trailing stop can activate. This allows the stop-loss to follow the price as it moves in your favor, aiming to capture more profit if the trend continues, while still protecting your gains if the price reverses.
Visual Markers: The system plots all important exit levels (profit targets, stop-loss, trailing stop) directly on the chart. Optional labels also appear whenever a target or stop-loss is hit, making it easy to see progress.
Visual cues (labels) are plotted directly on the bar where a buy or sell signal triggers, clarifying entry points and aiding manual exit/risk management decisions.
Input Parameters
rsiLen: Lookback period for RSI calculation.
rsiOB and rsiOS: Overbought/oversold thresholds, adaptive to the indicator’s multi-layered logic.
maFastLen and maSlowLen: Periods for fast and slow MAs.
maType: EMA or SMA selectable for both MAs.
bbLen: Length for Bollinger Bands mean calculation.
bbMult: Standard deviation multiplier for BB width.
macdFast, macdSlow, macdSig: Standard MACD parameterization for nuanced momentum oversight.
What Separates Signalgo V from Traditional Moving Average Indicators
Composite Signal Architecture: Where traditional MA systems generate signals solely on MA crossovers, Signalgo V requires layered, cross-confirmational logic across trend (MAs), momentum (MACD), volatility (Bollinger Bands), and market strength (RSI).
Adaptive Volatility Context: MA signals only “count” when price is meaningfully breaking out of its volatility envelope, filtering out most unremarkable crosses that plague basic MA strategies.
Integrated Multi-Factor Filters: Strict compliance with all layers of signal logic is enforced. A marked improvement over MA strategies that lack secondary or tertiary confirmation.
Non-Redundant Event Limiting: Each entry is labeled as a unique event. The indicator does not repeat signals on subsequent bars unless all entry conditions are freshly met.
Trading Strategy Application
Trend Identification: By requiring concurrence among MA, MACD, RSI, and BB, this tool identifies only those trends with robust, multifactor support.
Breakout and Momentum Entry: Signals are bias-toward trades that initiate at likely breakout points (outside BB range), combined with fresh momentum and trend alignment.
Manual Discretion for Exits: The design is to empower traders with high-confidence entries and leave risk management or partial profit-taking adaptive to trader style, using visual cues from all component indicators.
Alert Generation: Each buy/sell event optionally triggers an alert, supporting systematic monitoring without constant chart watching.
Mutanabby_AI | Ultimate Algo | Remastered+Overview
The Mutanabby_AI Ultimate Algo Remastered+ represents a sophisticated trend-following system that combines Supertrend analysis with multiple moving average confirmations. This comprehensive indicator is designed specifically for identifying high-probability trend continuation and reversal opportunities across various market conditions.
Core Algorithm Components
**Supertrend Foundation**: The primary signal generation relies on a customizable Supertrend indicator with adjustable sensitivity (1-20 range). This adaptive trend-following tool uses Average True Range calculations to establish dynamic support and resistance levels that respond to market volatility.
**SMA Confirmation Matrix**: Multiple Simple Moving Averages (SMA 4, 5, 9, 13) provide layered confirmation for signal strength. The algorithm distinguishes between regular signals and "Strong" signals based on SMA 4 vs SMA 5 relationship, offering traders different conviction levels for position sizing.
**Trend Ribbon Visualization**: SMA 21 and SMA 34 create a visual trend ribbon that changes color based on their relationship. Green ribbon indicates bullish momentum while red signals bearish conditions, providing immediate visual trend context.
**RSI-Based Candle Coloring**: Advanced 61-tier RSI system colors candles with gradient precision from deep red (RSI ≤20) through purple transitions to bright green (RSI ≥79). This visual enhancement helps traders instantly assess momentum strength and overbought/oversold conditions.
Signal Generation Logic
**Buy Signal Criteria**:
- Price crosses above Supertrend line
- Close price must be above SMA 9 (trend confirmation)
- Signal strength determined by SMA 4 vs SMA 5 relationship
- "Strong Buy" when SMA 4 ≥ SMA 5
- Regular "Buy" when SMA 4 < SMA 5
**Sell Signal Criteria**:
- Price crosses below Supertrend line
- Close price must be below SMA 9 (trend confirmation)
- Signal strength based on SMA relationship
- "Strong Sell" when SMA 4 ≤ SMA 5
- Regular "Sell" when SMA 4 > SMA 5
Advanced Risk Management System
**Automated TP/SL Calculation**: The indicator automatically calculates stop loss and take profit levels using ATR-based measurements. Risk percentage and ATR length are fully customizable, allowing traders to adapt to different market conditions and personal risk tolerance.
**Multiple Take Profit Targets**:
- 1:1 Risk-Reward ratio for conservative profit taking
- 2:1 Risk-Reward for balanced trade management
- 3:1 Risk-Reward for maximum profit potential
**Visual Risk Display**: All risk management levels appear as both labels and optional trend lines on the chart. Customizable line styles (solid, dashed, dotted) and positioning ensure clear visualization without chart clutter.
**Dynamic Level Updates**: Risk levels automatically recalculate with each new signal, maintaining current market relevance throughout position lifecycles.
Visual Enhancement Features
**Customizable Display Options**: Toggle trend ribbon, TP/SL levels, and risk lines independently. Decimal precision adjustments (1-8 decimal places) accommodate different instrument price formats and personal preferences.
**Professional Label System**: Clean, informative labels show entry points, stop losses, and take profit targets with precise price levels. Labels automatically position themselves for optimal chart readability.
**Color-Coded Momentum**: The gradient RSI candle coloring system provides instant visual feedback on momentum strength, helping traders assess market energy and potential reversal zones.
Implementation Strategy
**Timeframe Optimization**: The algorithm performs effectively across multiple timeframes, with higher timeframes (4H, Daily) providing more reliable signals for swing trading. Lower timeframes work well for day trading with appropriate risk adjustments.
**Sensitivity Adjustment**: Lower sensitivity values (1-5) generate fewer but higher-quality signals, ideal for conservative approaches. Higher sensitivity (15-20) increases signal frequency for active trading styles.
**Risk Management Integration**: Use the automated risk calculations as baseline parameters, adjusting risk percentage based on account size and market conditions. The 1:1, 2:1, 3:1 targets enable systematic profit-taking strategies.
Market Application
**Trend Following Excellence**: Primary strength lies in capturing significant trend movements through the Supertrend foundation with SMA confirmation. The dual-layer approach reduces false signals common in single-indicator systems.
**Momentum Assessment**: RSI-based candle coloring provides immediate momentum context, helping traders assess signal strength and potential continuation probability.
**Range Detection**: The trend ribbon helps identify ranging conditions when SMA 21 and SMA 34 converge, alerting traders to potential breakout opportunities.
Performance Optimization
**Signal Quality**: The requirement for both Supertrend crossover AND SMA 9 confirmation significantly improves signal reliability compared to basic trend-following approaches.
**Visual Clarity**: The comprehensive visual system enables rapid market assessment without complex calculations, ideal for traders managing multiple instruments.
**Adaptability**: Extensive customization options allow fine-tuning for specific markets, trading styles, and risk preferences while maintaining the core algorithm integrity.
## Non-Repainting Design
**Educational Note**: This indicator uses standard TradingView functions (Supertrend, SMA, RSI) with normal behavior patterns. Real-time updates on current candles are expected and standard across all technical indicators. Historical signals on closed candles remain fixed and unchanged, ensuring reliable backtesting and analysis.
**Signal Confirmation**: Final signals are confirmed only when candles close, following standard technical analysis principles. The algorithm provides clear distinction between developing signals and confirmed entries.
Technical Specifications
**Supertrend Parameters**: Default sensitivity of 4 with ATR length of 11 provides balanced signal generation. Sensitivity range from 1-20 allows adaptation to different market volatilities and trading preferences.
**Moving Average Configuration**: SMA periods of 8, 9, and 13 create multi-layered trend confirmation, while SMA 21 and 34 form the visual trend ribbon for broader market context.
**Risk Management**: ATR-based calculations with customizable risk percentage ensure dynamic adaptation to market volatility while maintaining consistent risk exposure principles.
Recommended Settings
**Conservative Approach**: Sensitivity 4-5, RSI length 14, higher timeframes (4H, Daily) for swing trading with maximum signal reliability.
**Active Trading**: Sensitivity 6-8, RSI length 8-10, intermediate timeframes (1H) for balanced signal frequency and quality.
**Scalping Setup**: Sensitivity 10-15, RSI length 5-8, lower timeframes (15-30min) with enhanced risk management protocols.
## Conclusion
The Mutanabby_AI Ultimate Algo Remastered+ combines proven trend-following principles with modern visual enhancements and comprehensive risk management. The algorithm's strength lies in its multi-layered confirmation approach and automated risk calculations, providing both novice and experienced traders with clear signals and systematic trade management.
Success with this system requires understanding the relationship between signal strength indicators and adapting sensitivity settings to match current market conditions. The comprehensive visual feedback system enables rapid decision-making while the automated risk management ensures consistent trade parameters.
Practice with different sensitivity settings and timeframes to optimize performance for your specific trading style and risk tolerance. The algorithm's systematic approach provides an excellent framework for disciplined trend-following strategies across various market environments.

Apex Edge - RSI Trend LinesThe Apex Edge - RSI Trend Lines indicator is a precision tool that automatically draws real-time trendlines on the RSI oscillator using confirmed pivot highs and lows. These dynamic trendlines track RSI structure in motion, helping you anticipate breakout zones, reversals, and hidden divergences.
Every time a new pivot forms, the indicator automatically re-draws the RSI trendline between the two most recent pivots — giving you an always-current view of momentum structure. You’ll instantly see when RSI begins compressing or expanding, long before price reacts.
Key Features: • Dynamic RSI trendlines drawn from the last 2 pivots
• Auto re-draws in real-time as new pivots form
• Optional "Full Extend" or "Pivot Only" modes
• Slope color-coded: green = support, red = resistance
• Built-in dotted RSI levels (30/70 default)
• Alert conditions for RSI trendline breakout signals
• Ideal for spotting divergence, compression, and early SMC confluence
This is not your average RSI — it’s a fully reactive momentum edge overlay designed to give you clarity, structure, and timing from within the oscillator itself. Perfect for traders using Smart Money Concepts, divergence setups, or algorithmic trend tracking.
⚔️ Built for precision. Built for edge. Built for Apex.

Stochastic Money Flow IndexThe Stochastic Money Flow Index (or Stochastic MFI ), is a variation of the classic Stochastic RSI that uses the Money Flow Index (MFI) rather than the Relative Strength Index (RSI) in its calculation.
While the RSI focuses solely on price momentum, the MFI is a volume-weighted indicator, meaning it incorporates both price and volume data.
The Stochastic MFI is intended to provide a more precise and sensitive reading of the MFI by measuring the level of the MFI relative to its range over a specific period.
Settings
Stochastic Settings
%K Length : The number of periods used to calculate the Stochastic. (Default: 14)
%K Smoothing : The SMA length used to 'smooth' the %K line. (Default: 3)
%D Smoothing : The SMA length used to 'smooth' the %D line. (Default: 1)
Money Flow Index Settings
MFI Length : The number of periods used to calculate the Money Flow Index. (Default: 14)
MFI Source : The source used to calculate the Money Flow Index. (Default: close)
Additional Settings
Show Overbought/Oversold Gradients? : Toggle the display of overbought/oversold gradients. (Default: true)

Stochastic SuperTrend [BigBeluga]🔵 OVERVIEW
A hybrid momentum-trend tool that combines Stochastic RSI with SuperTrend logic to deliver clean directional signals based on momentum turns.
Stochastic SuperTrend is a straightforward yet powerful oscillator overlay designed to highlight turning points in momentum with high clarity. It overlays a SuperTrend-style envelope onto the Stochastic RSI, generating intuitive up/down signals when a momentum shift occurs across the neutral 50 level. Built for traders who appreciate simplicity without sacrificing reliability.
🔵 CONCEPTS
Stochastic RSI: Measures momentum by applying stochastic calculations to the RSI curve instead of raw price.
SuperTrend Bands: Dynamic upper/lower bands are drawn around the smoothed Stoch RSI line using a user-defined multiplier.
Momentum Direction: Trend flips when the smoothed Stoch RSI crosses above/below the calculated bands.
Neutral Bias Filter: Directional arrows only appear when momentum turns above or below the central 50 level—adding confluence.
🔵 FEATURES
Trend Detection on Oscillator: Applies SuperTrend logic directly to the Stoch RSI curve.
Clean Entry Signals:
→ 🢁 arrow printed when trend flips bullish below 50 (bottom reversals).
→ 🢃 arrow printed when trend flips bearish above 50 (top reversals).
Custom Multiplier: Adjust sensitivity of SuperTrend band spacing around the oscillator.
Neutral Zone Highlight: Visual zone between 0–50 (green) and 50–100 (red) for quick momentum polarity reference.
Toggle SuperTrend Line: Option to show/hide the SuperTrend trail on the Stoch RSI.
🔵 HOW TO USE
Use 🢁 signals for potential bottom reversals when momentum flips bullish from oversold regions.
Use 🢃 signals for potential top reversals when momentum flips bearish from overbought areas.
Combine with price-based SuperTrend or support/resistance zones for confluence.
Suitable for scalping, swing trading, or momentum filtering across all timeframes.
🔵 CONCLUSION
Stochastic SuperTrend is a simple yet refined tool that captures clean momentum shifts with directional clarity. Whether you're identifying reversals, filtering entries, or spotting exhaustion in a trend, this oscillator overlay delivers just what you need— no clutter, just clean momentum structure.

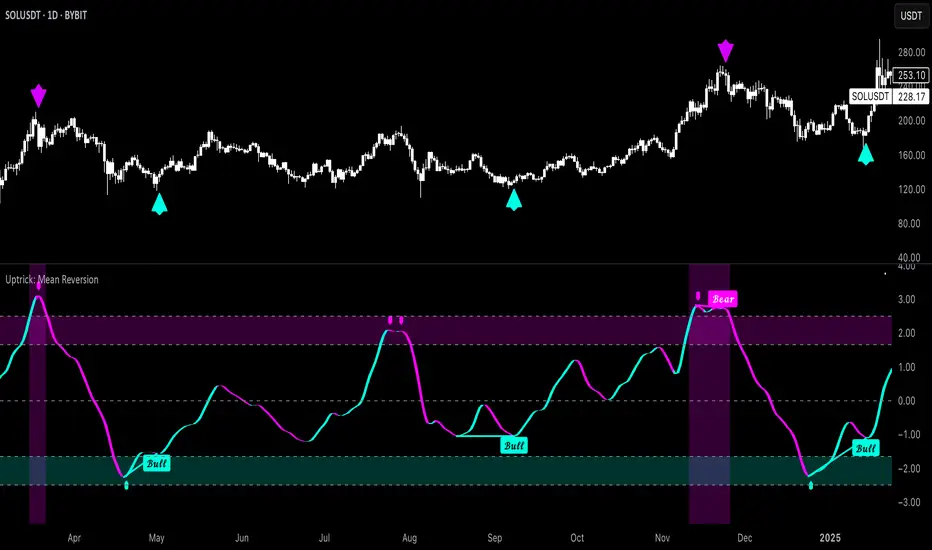
Uptrick: Mean ReversionOverview
Uptrick: Mean Reversion is a technical indicator designed to identify statistically significant reversal opportunities by monitoring market extremes. It presents a unified view of multiple analytical layers—momentum shifts, extreme zones, divergence patterns, and a multi-factor bias dashboard—within a single pane. By translating price momentum into a normalized framework, it highlights areas where prices are likely to revert to their average range.
Introduction
Uptrick: Mean Reversion relies on several core concepts:
Volatility normalization
The indicator rescales recent market momentum into a common scale so that extreme readings can be interpreted consistently across different assets and timeframes.
Mean reversion principle
Markets often oscillate around an average level. When values stray too far beyond typical ranges, a return toward the mean is likely. Uptrick: Mean Reversion detects when these extremes occur.
Momentum inflection
Sharp changes in momentum direction frequently presage turning points. The indicator watches for shifts from upward momentum to downward momentum (and vice versa) to help time entries and exits.
Divergence
When price trends and internal momentum readings move in opposite directions, it can signal weakening momentum and an impending reversal. Uptrick: Mean Reversion flags such divergence conditions directly on the indicator pane.
Multi-factor sentiment
No single metric tells the entire story. By combining several independent sentiment measures—price structure, momentum, oscillators, and external market context—Uptrick: Mean Reversion offers a more balanced view of overall market bias.
Purpose
Uptrick: Mean Reversion was created for traders who focus on countertrend opportunities rather than simply following established trends. Its main objectives are:
Spot extreme conditions
By normalizing momentum into a standardized scale, the indicator clearly marks when the market is in overbought or oversold territory. These conditions often align with points where a snapback toward average is more probable.
Provide reversal signals
Built-in logic detects when momentum shifts direction within extreme zones and displays clear buy or sell markers to guide countertrend entries and exits.
Highlight hidden divergences
Divergence between price and internal momentum can suggest underlying weakness or strength ahead of actual price moves. Uptrick: Mean Reversion plots these divergences directly, allowing traders to anticipate reversals earlier.
Offer contextual bias
A dynamic dashboard aggregates multiple independent indicators—based on recent price action, momentum readings, common oscillators, and broader market context—to produce a single sentiment label. This helps traders determine whether mean reversion signals align with or contradict overall market conditions.
Cater to lower timeframes
Mean reversion tends to occur more frequently and reliably on shorter timeframes (for example, 5-minute, 15-minute, or 1-hour charts). Uptrick: Mean Reversion is optimized for these nimble environments, where rapid reversals can be captured before a larger trend takes hold.
Originality and Uniqueness
Uptrick: Mean Reversion stands out for several reasons:
Proprietary normalization framework
Instead of relying on raw oscillator values, it transforms momentum into a standardized scale. This ensures that extreme readings carry consistent meaning across different assets and volatility regimes.
Inflection-based signals
The indicator waits for a clear shift in momentum direction within extreme zones before plotting reversal markers. This approach reduces false signals compared to methods that rely solely on fixed threshold crossings.
Embedded divergence logic
Divergence detection is handled entirely within the same pane. Rather than requiring a separate indicator window, Uptrick: Mean Reversion identifies instances where price and internal momentum readings do not align and signals those setups directly on the chart.
Adjustable sensitivity profiles
Traders can choose from predefined risk profiles—ranging from very conservative to very aggressive—to automatically adjust how extreme a reading must be before triggering a signal. This customization helps balance between capturing only the most significant reversals or generating more frequent, smaller opportunities.
Multi-factor bias dashboard
While many indicators focus on a single metric, Uptrick: Mean Reversion aggregates five distinct sentiment measures. By balancing price-based bias, momentum conditions, and broader market context, it offers a more nuanced view of when to take—or avoid—countertrend trades.
Why Indicators Were Merged
Proprietary momentum oscillator
A custom-built oscillator rescales recent price movement into a normalized range. This core component underpins all signal logic and divergence checks, allowing extreme readings to be identified consistently.
Inflection detection
By comparing recent momentum values over a configurable lookback interval, the indicator identifies clear shifts from rising to falling momentum (and vice versa). These inflection points serve as a prerequisite for reversal signals when combined with extreme conditions.
Divergence framework
Local peaks and troughs are identified within the normalized oscillator and compared to corresponding price highs and lows. When momentum peaks fail to follow price to new extremes (or vice versa), a divergence alert appears, suggesting weakening momentum ahead of a price turn.
Classic price bias
Recent bar structures are examined to infer whether the immediate past price action was predominantly bullish, bearish, or neutral. This provides one piece of the overall sentiment picture.
Smoothed oscillator bias
A secondary oscillator reading is smoothed and compared to a central midpoint to generate a simple bullish or bearish reading.
Range-based oscillator bias
A familiar range-bound oscillator is used to detect oversold or overbought readings, contributing to the sentiment score.
Classic momentum crossover bias
A traditional momentum check confirms whether momentum currently leans bullish or bearish.
External market trend bias
The indicator monitors a major currency’s short-term trend to gauge broader market risk appetite. A falling currency—often associated with higher risk tolerance—contributes a bullish bias point, while a rising currency adds a bearish point.
All these elements run concurrently. Each piece provides a “vote” toward an overall sentiment reading. At the same time, the proprietary momentum oscillator drives both extreme-zone detection and divergence identification. By merging these inputs, the final result is a single pane showing both precise reversal signals and a unified market bias.
How It Works
At runtime, the indicator proceeds through the following conceptual steps:
Read user inputs (risk profile, lookback index, visual mode, color scheme, background highlighting, bias table display, divergence toggles).
Fetch the latest price data.
Process recent price movement through a proprietary normalization engine to produce a single, standardized momentum reading for each bar.
Track momentum over a configurable lookback interval to detect shifts in direction.
Compare the current momentum reading to dynamically determined extreme thresholds (based on the chosen risk profile).
If momentum has flipped from down to up within an oversold area, display a discrete buy marker. If momentum flips from up to down within an overbought area, display a sell marker.
Identify local peaks and troughs in the proprietary momentum series and compare to price highs and lows over a configurable range. When divergence criteria are met, display bullish or bearish divergence labels
Evaluate five independent sentiment measures—price bar bias, smoothed oscillator bias, range oscillator bias, traditional momentum crossover bias, and an external market trend bias—and assign each a +1 (bullish), –1 (bearish), or 0 (neutral) vote.
Average the five votes to produce an overall sentiment score. If the average exceeds a positive threshold, label the bias as bullish; if it falls below a negative threshold, label it as bearish; otherwise label it neutral.
Update the on-screen bias table at regular intervals, showing each individual metric’s value and vote, as well as the combined sentiment label.
Apply color fills to highlight extreme zones in the background and draw horizontal guideline bands around those extremes.
In complex visual mode, draw a cloud-like band that instantly changes color when momentum shifts. In simple mode, plot only a clean line of the normalized reading in a contrasting color.
Expose alert triggers whenever a buy/sell signal, divergence confirmation, or bias flip occurs, for use in automated notifications.
Inputs
Here is how each input affects the indicator:
Trading Style (very conservative / conservative / neutral / aggressive / very aggressive)
Determines how sensitive the indicator is to extreme readings. Conservative settings require more pronounced market deviations before signaling a reversal; aggressive settings signal more frequently at smaller deviations.
Slope Detection Index (integer)
Controls how many bars back the indicator looks to compare momentum for inflection detection. Lower numbers respond more quickly but can be noisy; higher numbers smooth out short-term fluctuations.
Visual Mode (simple / complex)
Simple mode plots only the normalized momentum line, colored according to the chosen palette. Complex mode draws a candle-style block for each bar—showing the range of momentum movement within that bar—with colored fills that switch instantly when momentum direction changes.
Color Scheme (multiple themes)
Select from preset color palettes to style bullish vs. bearish elements (fills, lines, labels). Options include bright neon tones, classic contrasting pairs, dark-mode palettes, and more, ensuring signals stand out against any chart background.
Enable Background Highlighting (true / false)
When true, extreme overbought or oversold zones are shaded in a semi-transparent color behind the main pane. This helps traders “see” when the market is in a normalized extreme state without relying solely on lines or markers.
Show Helper Scale Lines (true / false)
When true, hidden horizontal lines force the vertical scale to include a fixed range of extreme values—even if the indicator rarely reaches them—so traders always know where the most extreme limits lie.
Enable Divergence Detection (true / false)
Toggles whether the script looks for divergences between price and the proprietary momentum reading. When enabled, bullish/bearish divergence markers appear automatically whenever defined conditions are met.
Pivot Lookback Left & Pivot Lookback Right (integers)
Define how many bars to the left and right the indicator examines when identifying a local peak or trough in the momentum reading. Adjust these to capture divergences on different swing lengths.
Minimum and Maximum Bars Between Pivots (integers)
Set the minimum and maximum number of bars allowed between two identified peaks or troughs for a valid divergence. This helps filter out insignificant or overly extended divergence patterns.
Show Bias Table (true / false)
When enabled, displays a small table in the upper-right corner summarizing five independent sentiment votes and the combined bias label. Disable to keep the pane focused on only the momentum series and signals.
Features
1. Extreme-zone highlighting
Overbought and oversold areas appear as colored backgrounds when the proprietary momentum reading crosses dynamically determined thresholds. This gives an immediate visual cue whenever the market moves into a highly extreme condition.
2. Discrete reversal markers
Whenever momentum shifts direction within an extreme zone, the indicator plots a concise “Buy” or “Sell” label directly on the normalized series. These signals combine both extreme-zone detection and inflection confirmation, reducing false triggers.
3. Dynamic divergence flags
Local peaks and troughs of the proprietary momentum reading are continuously compared to corresponding price points. Bullish divergence (momentum trough rising while price trough falls) and bearish divergence (momentum peak falling while price peak rises) are flagged with small labels and lines. These alerts help traders anticipate reversals before price charts show clear signals.
4. Multi-factor sentiment dashboard
Five independent “votes” are tallied each bar:
• Price bar bias (based on recent bar structure)
• Smoothed oscillator bias (based on a popular momentum oscillator)
• Range oscillator bias (based on an overbought/oversold oscillator)
• Traditional momentum crossover bias (whether momentum is above or below its own smoothing)
• External market trend bias (derived from a major currency index’s short-term trend)
Each vote is +1 (bullish), –1 (bearish), or 0 (neutral). The average of these votes produces an overall sentiment label (Bullish, Bearish, or Neutral). The table updates periodically, showing each metric’s value, its vote, and the combined bias.
5. Versatile visual modes
Simple mode: Plots a single normalized momentum line in a chosen color. Ideal for clean charts.
Complex mode: Renders each bar’s momentum range as a candle-like block, with filled bodies that immediately change color when momentum direction flips. Edge lines emphasize the high/low range of momentum for that bar. This mode makes subtle momentum shifts visually striking.
6. Configurable sensitivity profiles
Five risk profiles (very conservative → very aggressive) automatically adjust how extreme the momentum reading must be before signaling. Conservative traders can wait for only the most dramatic reversals, while aggressive traders can capture more frequent, smaller mean-reversion moves.
7. Customizable color palettes
Twenty distinct color themes let users match the indicator to any chart background. Each theme defines separate colors for bullish fills, bearish fills, the momentum series, and divergence labels. Options range from classic contrasting pairs to neon-style palettes to dark-mode complements.
8. Unified plotting interface
Instead of scattering multiple indicators in separate panes, Uptrick: Mean Reversion consolidates everything—normalized momentum, background shading, threshold bands, reversal labels, divergence flags, and bias table—into a single indicator pane. This reduces screen clutter and places all relevant information in one view.
9. Built-in alert triggers
Six alert conditions are exposed:
Mean reversion buy signal (momentum flips in oversold zone)
Mean reversion sell signal (momentum flips in overbought zone)
Bullish divergence confirmation
Bearish divergence confirmation
Bias flip to bullish (when combined sentiment shifts from non-bullish to bullish)
Bias flip to bearish (when combined sentiment shifts from non-bearish to bearish)
Traders can attach alerts to any of these conditions to receive real-time notifications.
10. Scale anchoring
By forcing invisible horizontal lines at fixed extreme levels, the indicator ensures that the vertical axis always includes those extremes—even if the normalized reading rarely reaches them. This constant frame of reference helps traders judge how significant current readings are.
Line features:
Conclusion
Uptrick: Mean Reversion offers a layered, all-in-one approach to spotting countertrend opportunities. By converting price movement into a proprietary normalized momentum scale, it highlights extreme overbought and oversold zones. Inflection detection within those extremes produces clear reversal markers. Embedded divergence logic calls out hidden momentum weaknesses. A five-factor sentiment dashboard helps gauge whether a reversal signal aligns with broader market context. Users can tailor sensitivity, visual presentation, and color schemes, making it equally suitable for minimalist or richly detailed chart layouts. Optimized for lower timeframes, Uptrick: Mean Reversion helps traders anticipate statistically significant mean reversion moves.
Disclaimer
This indicator is provided for informational purposes only. It does not guarantee any trading outcome. Trading carries inherent risks, including the potential loss of invested capital. Users should perform their own due diligence, apply proper risk management, and consult a financial professional if needed. Past performance does not ensure future results.
Momentum Long + Short Strategy (BTC 3H)Momentum Long + Short Strategy (BTC 3H)
🔍 How It Works, Step by Step
Detect the Trend (📈/📉)
Calculate two moving averages (100-period and 500-period), either EMA or SMA.
For longs, we require MA100 > MA500 (uptrend).
For shorts, we block entries if MA100 exceeds MA500 by more than a set percentage (to avoid fading a powerful uptrend).
Apply Momentum Filters (⚡️)
RSI Filter: Measures recent strength—only allow longs when RSI crosses above its smoothed average, and shorts when RSI dips below the oversold threshold.
ADX Filter: Gauges trend strength—ensures we only enter when a meaningful trend exists (optional).
ATR Filter: Confirms volatility—avoids choppy, low-volatility conditions by requiring ATR to exceed its smoothed value (optional).
Confirm Entry Conditions (✅)
Long Entry:
Price is above both MAs
Trend alignment & optional filters pass ✅
Short Entry:
Price is below both MAs and below the lower Bollinger Band
RSI is sufficiently oversold
Trend-blocker & ATR filter pass ✅
Position Sizing & Risk (💰)
Each trade uses 100 % of account equity by default.
One pyramid addition allowed, so you can scale in if the move continues.
Commission and slippage assumptions built in for realistic backtests.
Stops & Exits (🛑)
Long Stop-Loss: e.g. 3 % below entry.
Long Auto-Exit: If price falls back under the 500-period MA.
Short Stop-Loss: e.g. 3 % above entry.
Short Take-Profit: e.g. 4 % below entry.
🎨 Why It’s Powerful & Customizable
Modular Filters: Turn on/off RSI, ADX, ATR filters to suit different market regimes.
Adjustable Thresholds: Fine-tune stop-loss %, take-profit %, RSI lengths, MA gaps and more.
Multi-Timeframe Potential: Although coded for 3 h BTC, you can adapt it to stocks, forex or other cryptos—just recalibrate!
Backtest Fine-Tuned: Default settings were optimized via backtesting on historical BTC data—but they’re not guarantees of future performance.
⚠️ Warning & Disclaimer
This strategy is for educational purposes only and designed for a toy fund. Crypto markets are highly volatile—you can lose 100 % of your capital. It is not a predictive “holy grail” but a rules-based framework using past data. The parameters have been fine-tuned on historical data and are not valid for future trades without fresh calibration. Always practice with paper-trading first, use proper risk management, and do your own research before risking real money. 🚨🔒
Good luck exploring and experimenting! 🚀📊
