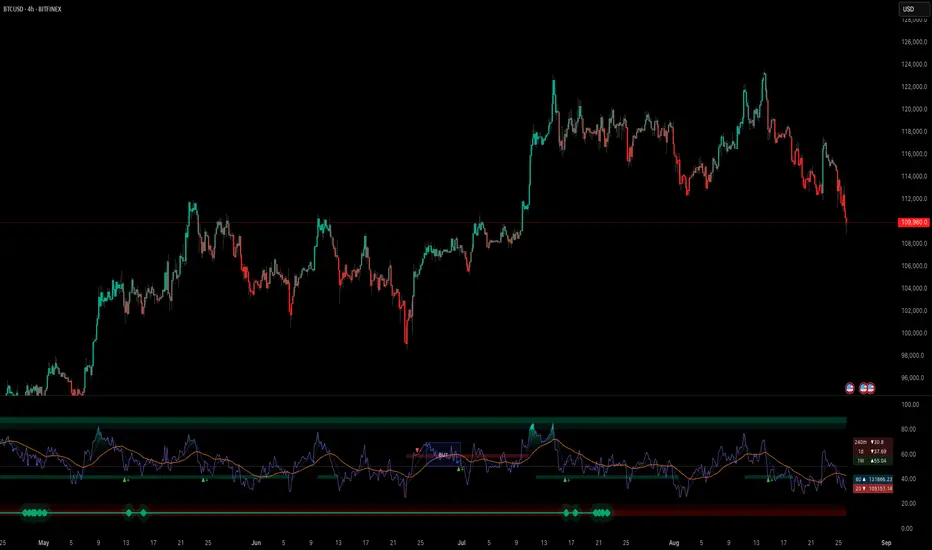
Waddah Attar Explosion V3 [NHK] -Bollinger - MACDWaddah Attar Explosion Version3 indicator to work in Forex and Crypto, This indicator oscillates above and below zero and the Bollinger band is plotted over the MACD Histogram to take quick decisions, Colors are changed for enhanced look. dead zone is plotted in a background area and option is provided to hide dead zone. One can easily detect sideways market movement using Bollinger band and volume. when volume is in between Bollinger band no trades are to be taken as volume is low and market moving in sideways
credits to: @shayankm and @LazyBear
Read the main description below...
- - - - - - - - - - - - - - - - - - - - - - - - - - - - - - - - - - - - - - -
This is a port of a famous MT4 indicator. This indicator uses MACD /BB to track trend direction and strength. Author suggests using this indicator on 30mins.
Explanation from the indicator developer:
"Various components of the indicator are:
Dead Zone Line: Works as a filter for weak signals. Do not trade when the up or down histogram is in between Dead Zone.
Histograms:
- Pink histogram shows the current down trend.
- Blue histogram shows the current up trend.
- Sienna line / Bollinger Band shows the explosion in price up or down.
Signal for ENTER_BUY: All the following conditions must be met.
- Blue histogram is raising.
- Blue histogram above Explosion line.
- Explosion line raising.
- Both Blue histogram and Explosion line above DeadZone line.
Signal for EXIT_BUY: Exit when Blue histogram crosses below Explosion line / Bollinger Band.
Signal for ENTER_SELL: All the following conditions must be met.
- Pink histogram is raising.
- Pink histogram above Explosion line.
- Explosion line raising.
- Both Pink histogram and Explosion line above DeadZone line.
Signal for EXIT_SELL: Exit when Pink histogram crosses below Explosion line.
All of the parameters are configurable via options page. You may have to tune it for your instrument.
Rsi-2

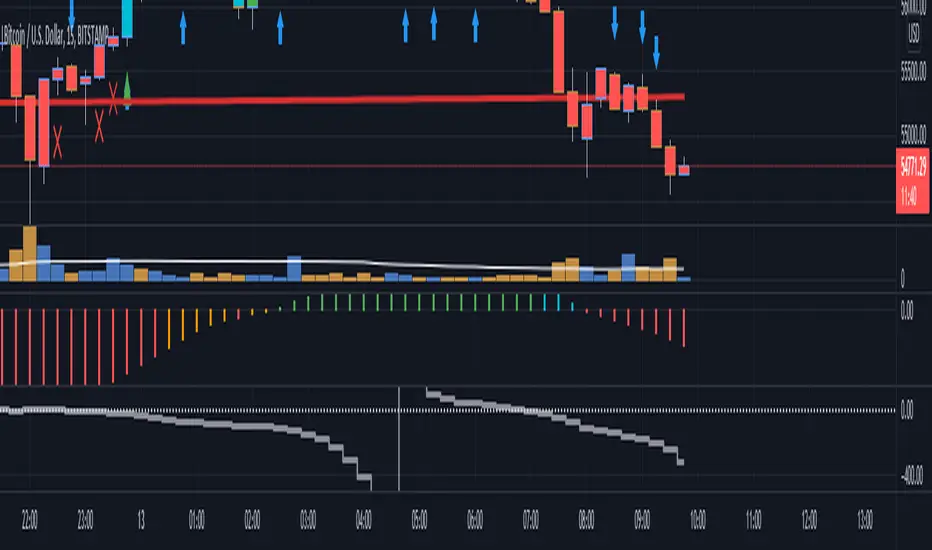
ENVELOPE RSI - Buy Sell SignalsThis indicator is mainly based on Overbought and Oversold . Indicator for short-term trading. This way you can get small but acceptable signals.
The main basis of the indicator is as follows:
To buy, the indicator is waiting for the instrument to be oversold from the RSI point of view. Then, if the chart crosses the bottom line of the Envelope indicator from the bottom to the top, a buy signal is issued.
For sell, the indicator waits for the instrument to be overbought from the RSI perspective. Then, if the chart crosses the top line of the Envelope indicator from top to bottom, a sell signal is issued.
The general basis is the consonance of the price and the RSI indicator .
The best settings I came up with myself:
Time frame: 15 minutes
Overbought: 80
Oversell: 25
RSI Length: 8
It can be done on different instruments. But always set your profit and loss limits.
(Profit to loss ratio in this indicator can be 1: 1.)
Disclaimer : This information and trading indicators and tools provided neither is, nor should be construed, as an offer, or a solicitation of an offer, to buy or sell securities. You shall be fully responsible for any investment decision you make, and such decisions will be based solely on your evaluation of your financial circumstances, investment objectives, risk tolerance, and liquidity needs.
I am not liable for any profit, financial improvement, losses or damages, monetary or other that may result from the application of information contained within this indicator. Individual traders must use their own due diligence in analyzing featured trading indicators, other trading tools, webinars and other educational materials to determine if they represent suitable and useable features and capabilities for the individual trader.

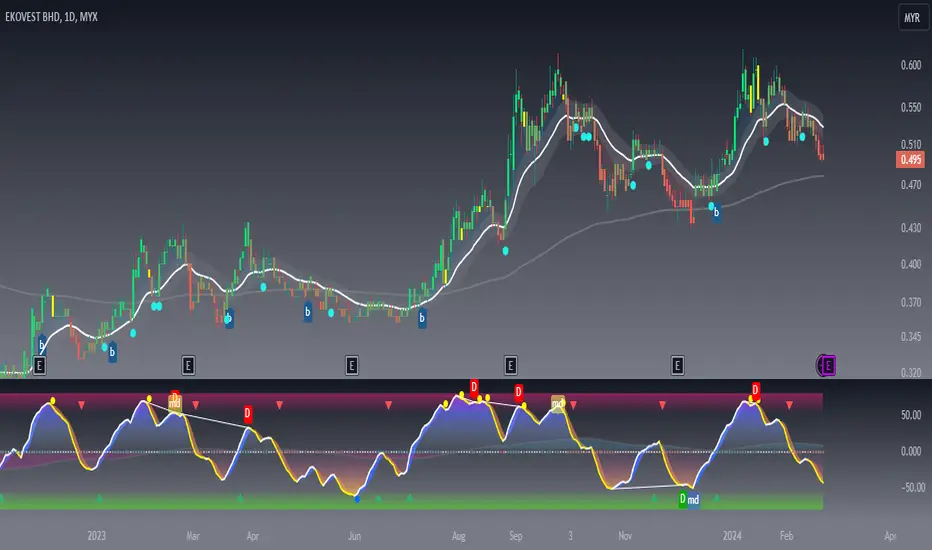
Bogdan Ciocoiu - CoordinatorDescription
The Coordinator is an indicator developed on the back of the RSI algorithm, modified substantially to form a cloud. In addition, the Coordinator uses EMA/SMA to compare the location of the RSI cloud with the chosen moving averages (EMA vs SMA).
This indicator is helpful as it confirms when a trader should enter a position or exit based on the proximity of the RSI cloud to the relevant MA.
Uniqueness
The Coordinator provides unique benefits, including:
It shows the strength of the RSI in the shape of the RSI cloud, using two sets of dimensions (one more long term and one more short-term oriented).
It indicates the positioning of the RSI cloud in conjunction with the relevant moving averages to help traders remain in positions for longer.
It shows the RSI 14 (useful when spotting divergences aligned with the price action).
Open-source
The Coordinator uses the following open-source scripts:
www.tradingview.com

RSI Swing v2 [Premium]The RSI signal is displayed with different color zones to reflect the value on the chart. This makes field evaluation more efficient.
RSI values of different time frames are displayed in the table, helping to evaluate the market more objectively.
A Retest Buy signal is given when the RSI value decreases from the area of more than 80 to 50.
Retest Sell signal is given when the RSI value increases from less than 20 to 50.
Retest Validation results are highlighted in bold for easy detection.
Settings:
* Length, source RSI
* Text size
* Type + Length MA
* RSI ADVANCE SETTINGS:
- Value RSI Range retest for Long trend
- Value RSI Range retest for Sell trend
This Indicator alert was created for the RSI Retest.
Recommendation: Should be used in combination with other Indicators to observe the market more effectively
Indicator of MagoIn this indicator you will find a combination of the indicators used by Mago Gobira. Being them EMA , RSI Levels...

HMAISR This indicator is very similar to the movements of the original rsi, but in some places it works faster.
This indicator is not perfect and does not work everywhere, this version is just my experiment.
Use this indicator at your own risk, it may be suitable for your trading as some areas that I have indicated have worked out perfectly, experiment if you find it interesting and remember that it can make a mistake at any time!
Here is another example of how you can use the indicator where I highlighted the green arrow up, notice how quickly the indicator reacted, note that it went faster for the simple moving average than the same RSI.

KINSKI Multi RSI DivergenceThis extremely useful indicator combines several RSI variants (can be displayed simultaneously or alone) with many setting options. The RSI variants can also be displayed as an extra histogram, which provides additional valuable information. Furthermore, it is possible to set smoothing types, volume and stochastic based calculations for each variant.
Relative Strength Index (RSI)
The Relative Strength Index ( RSI ) is a momentum indicator that measures the extent of recent price changes to analyse overbought or oversold conditions. RSI values range from 0 to 100. In general, RSI divergence means that the RSI indicator is moving in the opposite direction compared to the price. So while the price is moving, the RSI is telling us in advance that we can expect a change in direction.
RSX Indicator
The RSX is the noise-free version of the more familiar RSI oscillator. Normally, any indicator can be smoothed by applying a moving average. However, a major disadvantage of such a method is that there is a time lag between the indicator and the price. The RSX indicator tries to do this without signal delay.
Money Flow Indicator (MFI)
The MFI is essentially the RSI with the added aspect of volume . Because of its close similarity to the RSI , the MFI can be used in very similar ways.
RSI Laguerre
The RSI Laguerre works in the same way as the classic RSI , but is more sensitive to recent prices. When it crosses the signal line at the value of 0.15 from the bottom to the top, a buy signal is created, while overbought markets have values of 0.75 or higher
Detection of divergences
The detection of divergences in the RSI is one of the most important functions of this indicator. The reason is that an divergence is a more reliable signal than the overbought and oversold indicators themselves. You get overbought and oversold signals all the time. However, the divergence is a rare event.
In general, divergence means that the RSI indicator is moving in the opposite direction compared to the price. So while the price is moving, the RSI is telling us in advance that we can expect a change in direction.
Positive divergence
A positive divergence is when the price trend has lower lows and lower highs, while the indicator does the opposite - higher highs and higher lows. The price continues to fall while the RSI indicator begins to rise.
Negative divergence
Negative divergence is the opposite of positive divergence. It applies to uptrends where the price reaches higher highs and higher lows. However, the RSI shows lower highs and lower lows - the price goes up but the RSI goes down. The price closes with higher highs and higher lows, while the indicator shows the opposite - lower lows and lower highs, confirming a negative divergence. As a result, there is a sharp decline in the price.
Have fun using and trying out this flexible indicator!

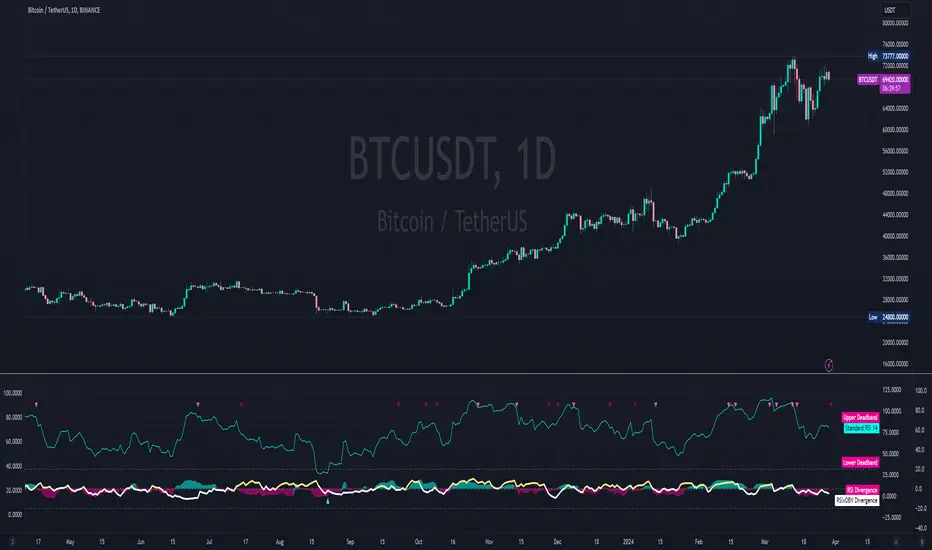
[UPRIGHT Trading] Top & Bottom Finder [Premium]Hello Traders,
Today I'm releasing an updated version of my previous Top & Bottom Finder (M.Right_Top & Bottom Finder 1.0).
The timing of this release couldn't be more perfect with everyone trying to 'find the bottom'. And the increased volatility that we've been seeing as of late.
Essentially, my indicator uses volatility and standard deviations among other things to assist you in finding the top or bottom of trends. You may also notice that it uses a lot of different strength indicators to provide an additional layer of complexity and confirmation.
Not just an RSI, but an RSI ema, smoothed OBV RSI's, and other volume RSI's. This is a truly unique and powerful tool for any Trader - whether you've just started or you've been trading for 20 years, I'm confident you will find value in the UPRIGHT Trading Top & Bottom Finder.
How to use it:
When it detects the trend Bottoming or Topping the histogram will change color. Bottom - Green/blue, Top - Red, (different shades of colors for different types of detection).
I've spent several hours tweaking the calculations and filters to enhance the accuracy, so this will be a noticeable upgrade from my original Top & Bottom Finder.
The length of the histogram bar can be an indication in itself, especially when it lines up close to one of the plotted lines and has noticeable direction change following this.
I've added a lot of text and pictures to help display it's capabilities, features, and customizability.
As always, it's fully customizable with alerts. Can toggle any thing on or off, and change the colors to suit your style.
3 Unique RSI's, different colors on the histogram will show different levels of detection. Some are more accurate in some timeframes than others. Bright Green and Bright Red are the most different from the rest.
I've jam-packed this indicator with Buy/Sell and Confirmation Signals and even background highlights (with colors that can mesh together). Feel free to find what works best for you.
RSI color indications and background highlights aid in confirmation. Also, as mentioned previously, sometimes a gray bar will land on a Fib and it will be a bottom signal.
The above chart should look like this
Good luck Traders,
Cheers,
Mike
(UPRIGHT Trading)

RSI with Divergences, Reverse Formulas, and Bull/Bear ZonesRegular RSI indicator that can underline divergences, turn green or red specifying user specified bull/bear zones, and with a label showing the price needed to turn bull/bear!
Specify the inputs:
+ RSI Length
+ Bull Threshold
+ Bear Threshold
+ Panel Position Offset
Also with toggle-able:
+ Bullish Divergence
+ Bearish Divergence
+ Hidden Bullish Divergence
+ Hidden Bearish Divergence
The zones included in the indicator are default and not meant to be used for all markets. The goal is to alter the bull/bear zones to find good breakout points and selloff points for your chosen security. Does not currently support automatic zone creation, or saving zones for each security (if that is even possible, may just need to create different layouts for each security).
Thanks!

Signal Table - AutoFib - SMA - EMA - RSI - ATR - VolWith this indicator you can add a table on top of your chart.
What's in this table?
On which graph you open this table, the indicator data at the selected time of that graph are written. In the image below, you can see the table in the upper right.
You can also see two EMAs above the chart in this indicator. You can adjust their length.
You can add automatic fibonacci retracement levels to the top of the chart. In this way, you can see the Fibonacci levels on the chart and determine the support resistance. If the price is above the Fibonacci level, it will appear green on the chart, and red if below. You will understand as you use it.
It turns red if the RSI is below 30 and green if it is above 70.
Likewise, if the price is above the moving averages you have set, it appears as green, and if it is below it, it appears as red.
You can hide and activate the EMA and Fibonacci levels above the chart.
For example, you can get the ETH chart while the BTC chart is open in front of you. I think you will understand everything clearly from the settings tab below. Please support me. I hope you will be satisfied using it.

RSI DINGUE - 3³ DivergenceThis is the updated version for PineScript V5
3x RSI indicator into 1. You can turn on or off all of them.
Each RSI has 2 individual Moving Averages that can also be changed to be "Full RSI" in the settings.
This makes 3x3 = 9 indicators on screen at the same time. (you can turn them on or off)
It has Bullish and Bearish divergence and hidden divergence as well.
Several visual options to show crosses between RSIs and or MAs fill in colors, background colors, midline. Overbought and Oversold levels with signals when entry and exit.
---------------------
In closing, no indicator can give perfect signals, you need to use them in conjunction with other information to make better decisions.
I hope you like my indicators and that they help your trading.
If you have any questions please ask.
Thank you.

MTF RSI + Average (Multi-Timeframe) [TH]Multi-Timeframe Relative Strength Index --- MTF RSI
Eliminates having to change time intervals to view a different Time Interval's RSI value (up to 5 time intervals possible through the settings).
The RSI values from Multiple Time Frames can be averaged together to show one single RSI.
A table overlay (info box) makes it easy to quickly identify RSI values on the multiple different time frames.

PBK Trend Band with EntryTrend band with background coloring of the trend.
Use 5, 15 for fast detection on EMAs
Additional arrows show under some favorable conditions.
This is work in progress, I release this version so that some good friend can make use of it.
GoldenCO Aie2 Use of GoldenCO Aie2
This market price movement trend analysis uses exponential moving average which is ema5/20/50. The purpose of using this EMA is to find out the effect of price changes that occur and the current trend of the market whether bullish or bearish.
It is suitable for short-term or long-term trading.
for short term trading, the trader uses ema5-ema20 and for long term trading the trader can use ema5-ema50 as analysis.
This indicator serves as a guide to traders in trading activities.
we hope that, by recognizing and knowing the trend of this price movement it can help traders in trading activities well and can reduce risk. May it benefit the trader.
DISCLAIMER : This is not Buy/Sell call, just sharing idea analysis for education. Trade at your own risk.
3 Seas RSI Wave OscillatorTraditional Triple RSI Oscillator combining a Fast, Normal, and Slow RSI to achieve high accuracy entry and exit strategies. This indicator is UNIQUE because it uses a mathematical filter to trim false signals from the RSI, thus creating a reliable RSI driven entry and exit indicator represented by red and green arrows. For additional functionality divergences are identified and live plotted. UNIQUELY Alongside the 0 axis an OBV function is charted relative to the RSI to allow OBV and RSI divergences to be observed on equal mathematical scales, this is exceedingly useful to observe relative strength at pools of liquidity. The three main configured RSI's are also plotted for traditional usage case but can be removed.
Green arrow indicates a Buy opportunity optimized for standard Dollar Cost Averaging strategies.
Red arrow indicates a Sell opportunity optimized for standard Dollar Cost Averaging strategies.
Not Financial Advice.
GODXBT OSCGodxbt Osc is Oscillator based on PRICE ACTION,VOLUME AND RSI (RELATIVE STRENGTH INDEX)
Allows you to understand the market trend based on price action
Includes guppy on RSI for better understanding of the trend
Blue trend on guppy suggests market is bullish
Red trend on guppy suggests market is bearish
Green triangle suggests price is about to go higher
Red triangle suggests price is about to go lower
Bar colours based on oscillator movements
Green bars are for bullish trend
Red bars are for bearish trend
No bar colors suggests trend is fading suggests take profits points
Dm for access

RSI + Support/Resistance Zones + EMAThis indicator enhances the RSI with support and resistance zones and an EMA.
RSI: a regular RSI (default: orange / 14 period)
EMA: an EMA on the RSI (default: light gray / 10 period)
RSI support/resistance zones
SR-Zones for bull markets: In a bull market the price tends to find resistance between 80 and 90 and support between 40 and 50 RSI.
SR-Zones for bear markets: In a bear market the price tends to find resistance between 55 and 65 and support between 20 and 30 RSI.
The concept of these support and resistance zones has been popularized by Constance Brown in her book Technical Analysis for the Trading Professional . The SR zones are described in the first chapter which is available in the preview section on Amazon.
RSI-EMA
The EMA on the RSI can also be used as support and resistance. For example, you can be use it for a simple strategy such as the following: In an uptrend after a significant correction during which the RSI has been below the EMA for some time, wait for the RSI to cross above the EMA to go long and exit (partially) after the RSI crossed down the EMA.
Hint: All visual elements (RSI, EMA, support zones) can be enabled/disabled and adjusted individually.
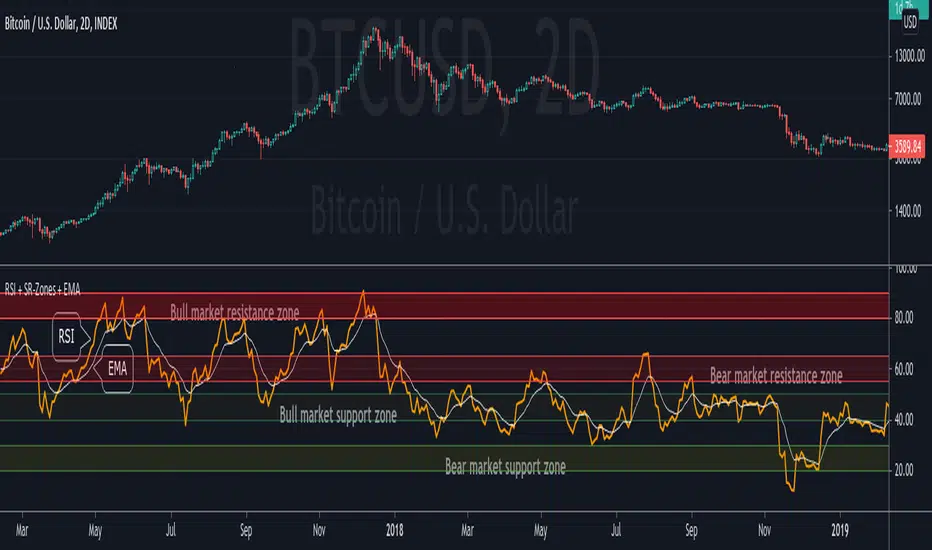
Chart OscillatorI present you the chart oscillator where an oscillator (Stoch or RSI) is plotted
on the chart itself (instead of below the chart)
It is inspired on an idea of @Kablamicus
Instead of having the lines between 0 and 100, here the '0-100' are
- lowest(low, len)
- highest(high, len)
An overbought/oversold and a middle line is derived from these lines
and the oscillator goes in between.
It resembles very much the 'normal' oscillator, with a few extra's:
- you can see the movement of the candles against the oscillator
- S/R levels of oscillator, 50 line, overbought/oversold line, 0-100 line
Stoch:
RSI:
Also a table is included with the Stoch/RSI values
Cheers!

IC Options °Turn the Dashboard on or off
°Turn the Signal Bars on or off
°Turn the Buy & Sell Signals on or off
°Turn the Fibonacci Retracement Tool on or off
The Dashboard information is best used for confirmation and informational purposes
-above 9 ema is bullish, below 9 ema is bearish trend
This script allows user input, you can add or remove built in dashboard, color bars(inform you of when the price action is above or below the midpoint of the Void Lines), long short signals(can be used to find optimal entries and exits for trades on any time frame. Smaller time frames are best for scalping. Longer time frames are best for longer swing trades. This paired with 9,21,34 ema can produced profitable trades!), auto Fibonacci retracement(allows you to plot perfect Fib Lines every time.)
-thanks for allow the following above being public domain from lemon:lemon:

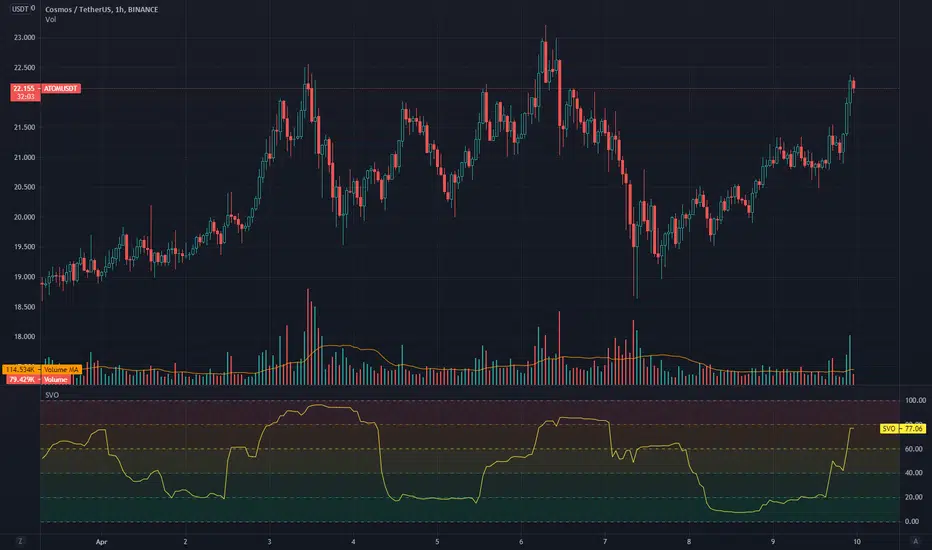
Simple Volume Oscillator (SVO), by @BlueJayBirdSimple Volume Oscillator, or SVO. I came up with this idea while studying Spread Volume Analysis (SVA). It uses the Trading View's built-in RSI function to simplify volume values for further interpretation.
// -------------------- ENGLISH, Inglés
How to Use:
- When there's little volume activity, expect the oscillator to be closer to the zero line.
- Wait for a probable sudden increment up to close 100 when volume enters into the market.
- It works pretty much as a volatility oscillator, but it eliminates the noise of the price, and the noise of the volume bars, always so vertical and linear, which sometimes are hard to understand at first glance.
- As any oscillator, it suffers from some lagging when compared to the price action, but for the most part is pretty accurate.
- Remember the cyclical nature of markets: If things are quite, something is coming.
- NOTE: The oscillator WILL NOT indicate market direction, that bias is up to the analyst to find out.
- Like. Follow. Comment.
// -------------------- SPANISH, Español
Cómo usar:
- Cuando hay poca actividad de volumen, el oscilador debería estar cercano a cero.
- Esperá por un posible incremento repentino hasta 100 cuando entre volumen en el mercado.
- Funciona de manera similar a un oscilador de volatilidad, pero elimina cualquier ruido del precio, y el ruido de las barras de volumen, siempre tan verticales y lineales, lo que las hace difícil de descifrar a simple vista.
- Como cualquier oscilador, sufre de un ligero retraso respecto de la acción del precio, pero por lo demás, es bastante preciso.
- Recordá la naturaleza cíclica de los mercados: Si las cosas están quietas, es porque algo está por suceder.
- NOTA: Este oscilador NO VA A decirte qué dirección va a seguir el precio; eso es algo que vas a tener que descubrir por tu cuenta.
- Like, seguí, comentá.
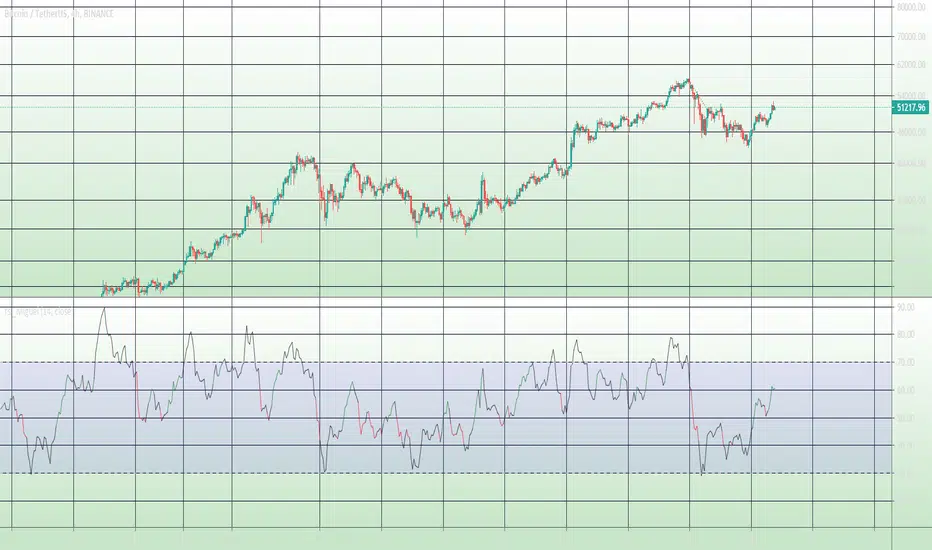
RSMI have published that script not like oscillator, which in fact it is, because tradingview doesn't support dual plots in overlay=true and overlay=false. So I have decided that to show filter is better idea. Yes, it decrease potential profit on long term, but for me personally, it is much better to understand the direction of the market movement and take potential trades more seriously. Also about this script: in general based on RSI and works pretty nice on 1H timeframe. Yes, theoretically it can work on both 4H and 1D timeframes, but for this you need to change the settings that are not displayed in the inputs (I did not add them, due to the fact that they can be confusing, because I decided to add a filter). And about filter - it is one of the variations of the SuperTrend. According to House Rules, I cannot insert links here, but only if you are interested in trying this work in auto trading, you can follow the link (located even lower) and find there an algorithm with the same name.

rsi_MiguelSlightly different RSI . It is shown the Ema RSI with leght 2 in order to clean some "noise" and become easier to read. It shows in green possible "buy moments" and in red possible "Sell moments". Those are calculared with a slower and a faster ema ( rsi ). It is the RSI that I use and hope it helps someone.
Profit Accumulator Relative Strength IndexHi Everyone
Thought I'd share this nice and simple RSI indicator with you which uses short and long length crossover to determine potential long and short trades. This indicator also has multiple timeframe functionality.
Please use this with other indicators or price action etc to confirm long and short trades.
Personally I like to see the crossover on the longer timeframe and close out on a lower timeframe (i.e. spot the entry on the 1hr charts and close my position based on the 15min)
If anyone would like alerts putting on here for crossover then just let me know.
Cheers
Mike
