TTM Apollo 11 RSIColor coded RSI to give a better indication of when to buy or sell based on the RSI level along with an included EMA signal to help describe the trend.
Rsi_divergence
Cyatophilum Golden X - RSI [INDICATOR] [ALERT SETUP]This indicator is a custom combo of Ema crosses, RSI divergences and Support/resistance, designed to make the most profit possible.
It is a pretty solid indicator for trading BTC in 4H.
There are two kind of buy signals : Green and Blue triangles, that are two great Buy/Long entries.
There are also two kind of sell signals: Red and Orange triangles, that are two great Sell/Short entries.
The indicator comes with automatic Alerts that trigger on Green and Blue triangles for a Buy Alert, or that trigger on Red and Orange triangles for a Sell Alert.
If you are interested in purchasing the indicator and want to try it, then please leave a comment.
A strategy version should follow on my profile soon.
-----------------------------------------------------------------------------------------
I am also available for PineScript Development and Reverse Engineering.
Join my discord:
discord.gg

RSI/MFI - MTF - Entry signals/Trend colored bars - JD@version=2
This indicator is designed to give early entry signals as well as to follow trend moves, according to different settings.
The indicator shows a histogram of the RSI ro MFI in relation to an ema of the RSI or MFI.
The histogram is then smoothed to give early reversal/entry signals.
The actual RSI/MFI line with oversold/overbought indication can be displayed or omitted, as preferred.
in addition to the RSI/MFI line or as an alternative to it, the background colour can be set to change folowing the RSI/MFI signals.
The timeframe can be chosen. Higher timeframes (eg. 3h) tend to give less false signals.
version 5.
added support for custom Multiple Time Frame selection.
added option for choice of RSI or MFI as base indicator.
added option for price bar coloring according to the indicator. (deselecting "borders" in the "style" tab is recommended)
price bar coloring can be adjusted for different strategies:
1. following the slope of the histogram (for faster entry/exit signals)
2. according to positive or negative histogram (for longer moves)
3. according to pos. or neg. RSI/MFI (for longer term trend holds)
4. uptrend: biased towards faster buy signals and slower sell signals to stay in the uptrend
5. downtrend: biased towards faster sell signals and slower buy signals to stay in the downtrend
A longer timeframe (eg. 3x) is recommended for following trend moves.
try different strategies to see what works better for RSI or MFI.
JD.

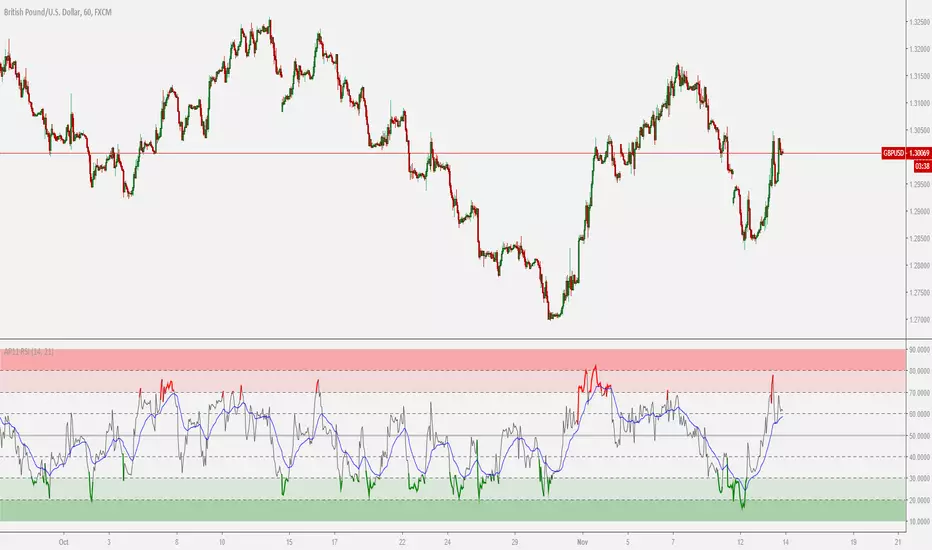
RSI Swing SignalThis indicator is a tool designed to be used with Steven Hart's RSI Exhaustion strategy. For more information google TheTradingChannel or look him up on YouTube :)
The default RSI settings for this strategy are:
RSI Overbought: 80
RSI Oversold: 20
Length: 7
When the RSI gets above 80, the line will turn red and the script will begin looking for a specific type of engulfing candle to go short. The same is true when the RSI gets below 20, but the line will turn green and look for longs. It is best used as a back-testing aid, but it can also be used to send emails or SMS alerts whenever the conditions are met. It can also be used as an alternative colored RSI indicator by removing the signals in the settings menu and changing the RSI parameters to whatever you normally use. This can aid in RSI divergence and overbought/sold strategies.
Entries:
The bright green and bright red lines represent the first type of engulfing candle.
The dark green and red lines represent the second type of engulfing candle.
Some pairs perform best with only one of these entries, while others work fine with both.
This is a counter-trend or consolidation strategy, and is best used in combination with trend-continuation or trend-following strategies. As always, make sure you back-test it before you use it to trade as it works better on some pairs than others.

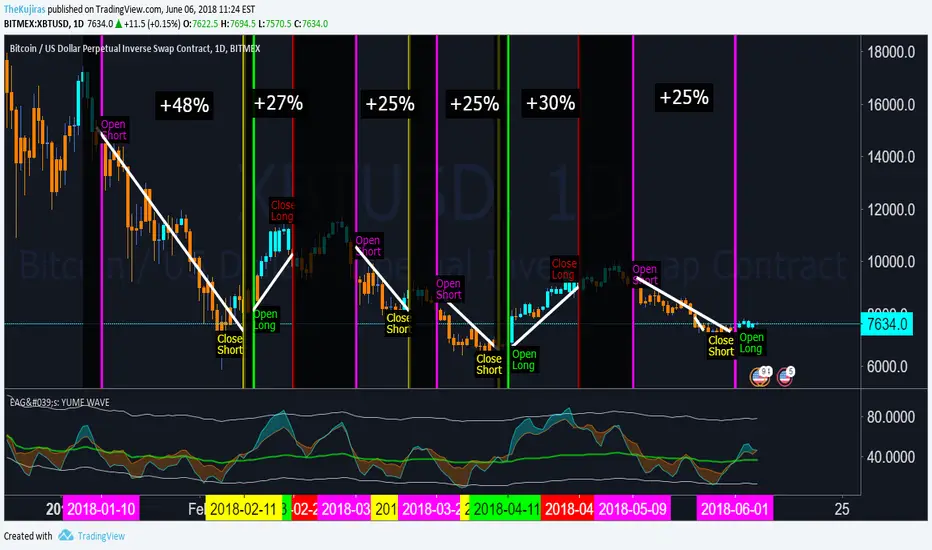
EdgeAnalysisGroup: Yume WaveDONATIONS APPRECIATED
--------------------------------
ETH: 0x862E6C54397Cf681887136472d5F16cCA22C80Fe
BTC: 16wnhEyNB5zx7ErwNi5KyszNeHhtjH2syx
ABOUT
-----------------
Yume (aqua line) is a modified high moving average of RSI
Akume (orange line) is a modified low moving average of RSI
Miaku line (green line) is a variable median line that determines market outlook
Nami is the wave (aka: cloud) that the Yume Akume lines create.
BAR COLORS are based on market sentiment using volume + price action to determine the overall health of the market and probable direction.
MODERATE RISK STRATEGY
-----------------
Bullish Long indicator:
Yume crossing above Akume over the Miaku Line (aqua wave twist)
Close Long Indicator:
Akume crosses above Yume over the Miaku Line (orange wave twist)
Bearish Short indicator:
Akume crossing above Yume under the Miaku Line (orange wave twist)
Close Short Indicator:
YUME crosses above Akume under the Miaku Line (aqua wave twist)
-----------------
DONATIONS APPRECIATED:
ETH: 0x862E6C54397Cf681887136472d5F16cCA22C80Fe
BTC: 16wnhEyNB5zx7ErwNi5KyszNeHhtjH2syx

RSI DivergenceHi!
Lately I had quite a few requests for an RSI divergence development, so I decided to make a publish version of such indicator. This is how it works:
It searches for peaks on the RSI indicator (not on the price!):
when the RSI values greater than two values before and after that value it's a peak
when the RSI values lesser than two values before and after that value it's a trough
NOTE: The peak/trough could be detected only after two new bars are formed!
The indicator remembers high/low price on the bar with the peak/trough. When the indicator value at the peak is lower than the indicator value at the previous peak and the low price at the current peak is higher than the low price at last peak then it's a hidden bullish. Vice versa for the trough.
So, this indicator can detect the next cases:
indicator fall + high rise = regular bearish
indicator rise + high fall = hidden bearish
indicator rise + low fall = regular bullish
indicator fall + low rise = hidden bullish
You can donate ETH (0xa961e3866f58c36aaef958714d4f75d9c081b8bc) if you want to thank me more than just a like or a comment.


RSI-Histo-Entry_JDThis indicator shows a histogram of the RSI in relation to an ema of the RSI.
The histogram is then smoothed to give early reversal/entry signals.
The actual RSI line with oversold/overbought indication can be displayed or omitted, as preferred.
In addiction to the RSI line or as an alternative to it, the background colour can be set to change folowing the RSI signals.
JD.

Gold/Silver 30m Only Strategy Buy/Sell SignalsIn my free time I felt like coding this strategy, and after backtesting it, it appears that the 30m time frame is the most profitable.
I only have been working on it for gold, but it should work similarly for silver as well.
This includes no pyramiding, and with pyramiding orders of 5, this strategy is upwards of 100% profitable.
Buy order - when price is above the 162 day EMA and RSI is less than 35
Sell order - when price is below the 162 day EMA and RSI is greater than 65
I will probably be adjusting it to increase the profitability and %success rate.

MagnetSimple Indicator designed by me to check tops and bottoms, also helps to ride the trend, Indicator Tries to Get back at zero.

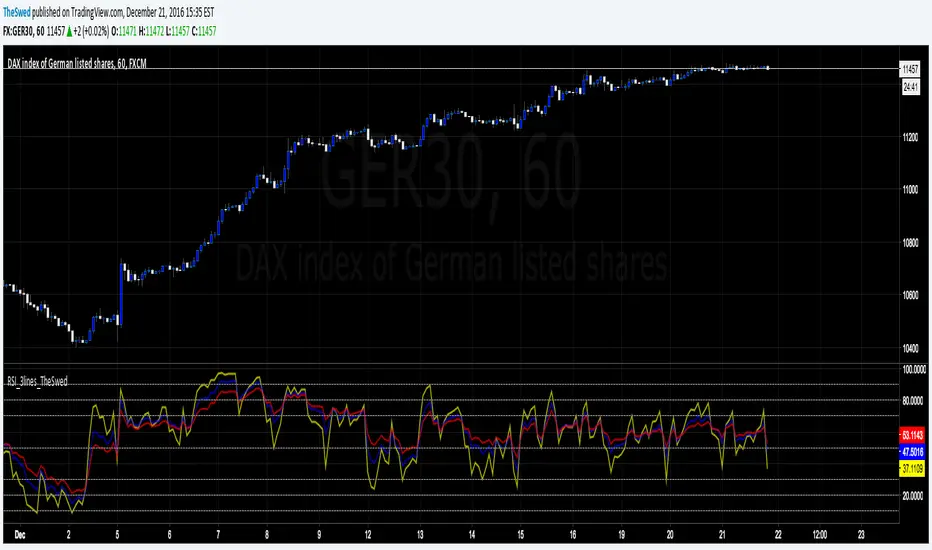
RSI_3lines_TheSwedRSI script with 3 lines. Also added lines: 90, 80, 20 and 10 to the script as I use this for trading.
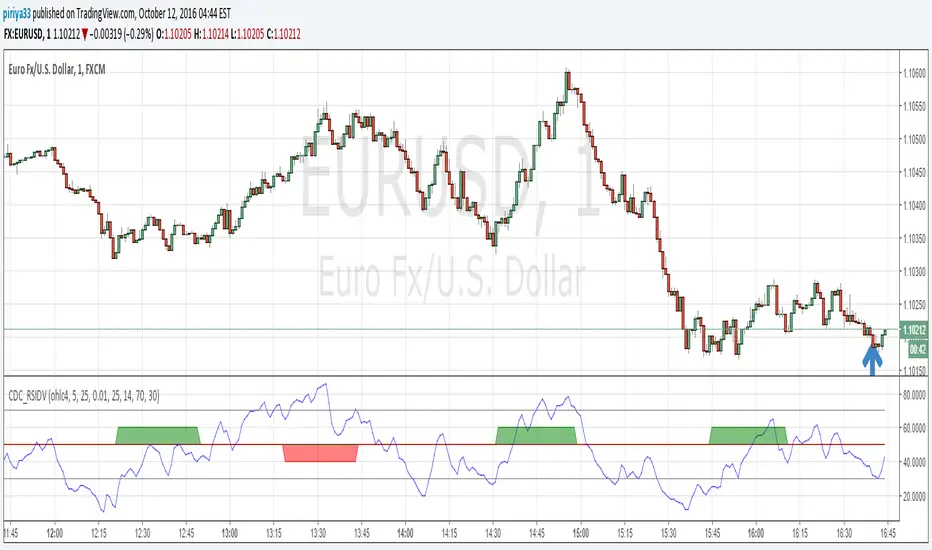
CDC RSI Divergence 15-10-2016An updated version of CDC RSI Divergence
The last version have fixed reversal amount to weed out false signal.
The reversal amount, however, needs to be calibrated to different chart.
The new one uses ATR instead, user can customize the ATR multiplier.
THIS IS NOT A TRADING SIGNAL SYSTEM
though it can be used in such a way it is not designed to.
The system helps identify Bullish and Bearish Divergence to help trader change their bias accordingly and should be used in conjunction with a trend following signal.
BULLISH DIVERGENCE is displayed with a green fill over 50 line.
BEARISH DIVERGENCE is displayed with a red fill under 50 line.
The indicator start on the bar where divergence is detected and persists for another 25 bars for easy regcognition.

CDC RSI DivergenceThis script alerts when a bullish or bearish divergence occurs.
The alert have minor repainting so do not use this as an entry / exit signal
but rather a guideline to be considered with other indicators. (MACD for example)
MACDouble & StochRSI w/ safeties and variable time interval v0.3UPDATE:
IMPORTANT!!! MAKE SURE "RECALCULATE AFTER ORDER FILLED" IS CHECKED. I will have it on by default in the future.
This is a continuation of my previous scripts of two MACD indicators with a Stochastic RSI indicator.
New features:
- Alternate MACD time interval
You can now set the time interval for the second MACD indicator to a different resolution than the displayed chart.
Uncheck the box and select the desired interval. For example, if your chart is set to 15min then first MACD will be set at 15 min and you can select 5 min for the second MACD.
- Alternate StoRSI time interval
You can (and should) set the StochRSI to a different time interval as well. StochRSI hasn't worked great with previous versions. Now you can set it to a different time resolution as well. I strongly recommend you set it at a higher (slower) resolution; for example if your chart is set at 15min then you should test setting the StochRSI at 30 or 45min.
- ' True" StochRSI logic
Trading logic for StochRSI is now a true StochRSI, instead of just reading "k" and ignoring "d", K now has to be greater than D to buy and less than to sell.
- Safeties
A primitive but low risk safety in the form of an uptrend/downtrend price safety. If current close+high isn't greater than the previous close and high then the buy order will not be executed. The same applies for sell orders.
- Cap on losses from short positions
A stop loss safety set to 9000 for exiting sell positions. This will need refinement in the future but this puts a cap on losses from any sell position. At an initial currency of 10,000 this translates to 90.00. If it is giving you problems simply delete line 78 from the source code.
Please feel free to ask any questions or send me suggestions. This is still very much a work in progress and I'll try to polish up the rough spots but it is fully functional. With a slower StochRSI and the safeties I have gotten it to consistently outperform the old 2x MACD strategy script---typically by 3-fold.

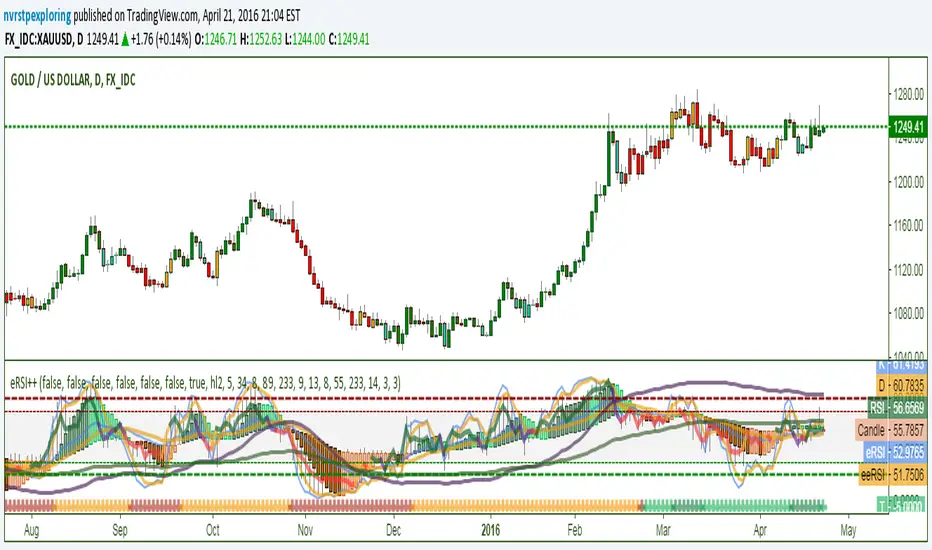
eRSI++Contains RSI; EMA of RSI; EMA of EMA of RSI; Stochastic Oscillator; 2 Inverse Fisher Transforms on RSI - IFRSI89 and IFRSI233 XOVER on higher timeframes from oversold/overbought is useful signal; RSI Trend/Divergence Candles with color variation based on multiple RSI length detection of trend decay; Chart candle overlay coloring based on RSI, eRSI, and eeRSI EMA55 & EMA233 Xover indicator on bottom for trend direction with color variations for counter trend movements.