BEST RSI Divergences Screener (Regular and Hidden)Hello traders
My way to fight this situation is to stay productive.
Hope some of my scripts will help you out as most of us are locked-down at home, hence have more time for trading - and preparing ourselves when the sun will shine on us again
I - Concept
This is an upgrade of this script which captured only the regular divergences
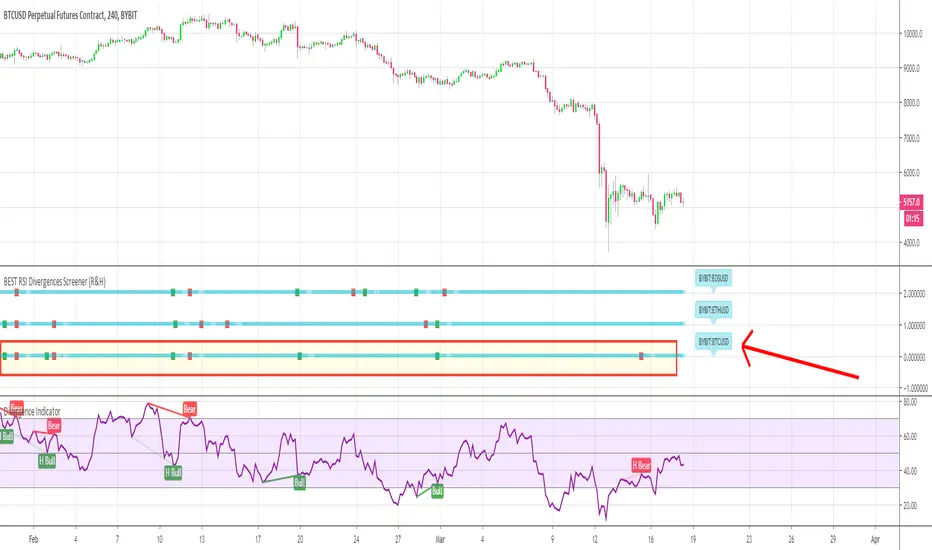
This screener detects whether the regular RSI divergences based on the TradingView Divergence built-in indicator (made by the gentleman @everget I believe)
With this screener, you can see in 1 view which of your favorite cryptos/stocks/forex pairs/etc. showing strong regular and hidden divergences
The gentlemen (and demoiselles) traders can play with the lookback/ranges inputs to adjust the divergences based on what they think is best of their trading/timeframe/instrument/life
On that script screenshot, I'm showing the BYBIT:BTCUSD part of the screener matching with the divergences on the chart
II - How did I set the screener
The visual signals are as follow:
- square: whenever a regular or hidden divergence is detected
Then the colors are:
- green when there is bullish divergence
- red when there is bearish divergence
🔔🔔 I also added the alerts for capturing those bullish/bearish divergences
III - Does it repaint?
It should not :)
Best regards
Dave
Rsi_divergence
BEST RSI Divergences ScreenerHello traders
I hope you're all hanging on at home with what's going on these days...
The good news is.... it gives us more time to trade ^^.... #positive #attitude
I - Concept
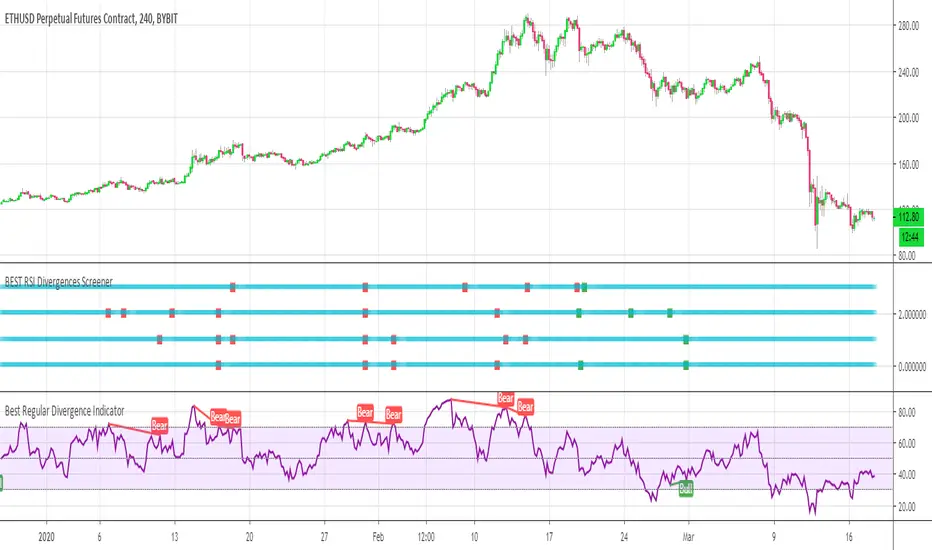
This screener detects whether the regular RSI divergences based on the TradingView Divergence built-in indicator (made by the gentleman @everget I believe)
With this screener, you can see in 1 view which of your favorite cryptos/stocks/forex pairs/etc. showing strong divergences
The gentlemen (and demoiselles) traders can play with the lookback/ranges inputs to adjust the divergences based on what they think is best of their trading/timeframe/instrument/life
On that script screenshot, I'm showing the BYBIT:BTCUSD part of the screener matching with the divergences on the chart
II - How did I set the screener
The visual signals are as follow:
- square: whenever a divergence is detected
Then the colors are:
- green when there is bullish regular divergence
- red when there is bearish regular divergence
Best regards
Dave
Icahns RSI DivergenceThis is an optimized version of a popular RSI Divergence Detector with a bar color scheme based on the RSI's direction
RSI Divergence is a potent tool in identifying shifts in market momentum or trend reversals. A RSI momentum divergence occurs when there's a disagreement between the direction of the price and the RSI . For example, in an uptrend, a divergence occurs when price makes a higher high, but the indicator makes a lower low (i.e. Standard Bearish Divergence).
This indicator confirms the divergence on the 2nd candle close after the divergence is printed.
I've found that RSI div signals a shift in momentum the best on the 1H and 4H time interval.
______________________________________________________
How to read the Indicator:
R = Regular
H = Hidden
Green divergences are bullish
Red Divergences are bearish
The candle colors are based on the current RSI value.
Light Blue: If RSI is above 70
Pink: If the RSI is below 30
Green: If the RSI is above 50 and below 70
Red: If the RSI is below 50 and above 30

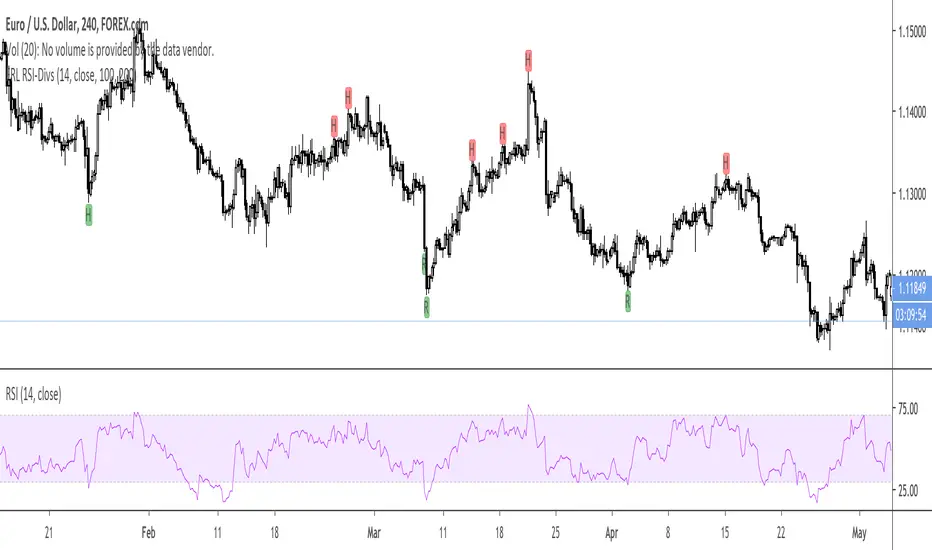
FRL RSI-DivsThis indicator highlights RSI divergences.
R green label: Regular Bullish Divergence.
H green label: Hidden Bullish Divergence.
R red label: Regular Bearish Divergence.
H red label: Hidden Bearish Divergence.
You can choose the range where the Divergences should be looked for.
Bars Back Min should not be too low to avoid too many false positives.
I found that using a Min of 100 and a Max of 200 was giving decent results.
When a Divergence is found and printed, the value shown in the upper left corner is the number of bars back where the Divergence has been found, so you can check the validity.
(JS) Ultimate RSISo my goal here was to combine all of my RSI ideas into a single indicator in order to make kind of a "Swiss Army Knife" version of the Relative Strength Index ...
------------------------------------------------------------------------------------------------------------------------------------------------------------------------------------------------------------------------------------------------------------------
So, let's begin with the first RSI indicator I made, which is the RSIDVW (Divergence/Volume Weighted);
To rephrase my original post, the "divergence/volume weighted" portion is meant to expand upon the current RSI format by adding more variables into the equation.
The standard RSI is based off one value that you select (open, close, OHLC4, HLC3, etc.) while this version takes three variables into account.
The default setting is to have RSI normal without anything added to it (Divergence Weight = 0)
1st - it takes the standard variable that RSI normally uses.
2nd - it factors RSI divergence by taking the RSI change % and price change % to form a ratio. Using this ratio, I duplicated the RSI formula and created a divergence RS to be factored in with the standard price RS .
3rd - it takes Relative Volume and amplifies/weakens the move based upon volume confirmation. (So if Relative Volume for a price bar is 1.0, the RSI plot would be the same as it normally would)
So to explain the parameters
- Relative Volume Length: This uses the RV length you specify to determine spikes in volume (or lack of volume ), which then is added into the formula to influence the strength of the RSI move
- RV x Divergence: This is how I calculated the original formula, but you can leave this unchecked to turn Relative Volume off, or apply elsewhere.
- RV x RS: There's two sides, Divergence RS and Standard RS - these check marks allow you to select which part you prefer to be multiplied by Relative Volume .
Checking neither turns off Relative Volume , while checking both amplifies its effects by placing it on both sides of the equation.
-Divergence Weight: This controls how much the DVW portion of the formula influences the RSI plot. As I referred to earlier, default is 0 making RSI normal. The Scale is 0-2, so 1.0 would be the same as 50%.
When I do have DVW on, I generally set it to 0.5
-SMA Divergence: To smooth, or not to smooth, that is the question. UJsing an SMA here is much smoother in my opinon, but leaving it unchecked runs it through an RMA the same way standard RSI is calculated.
-Show Fractal Channel: This allows you to see the whole fractal channel around the RSI (This portion of the code, compliments of the original Ricardo Santos fractal script)
------------------------------------------------------------------------------------------------------------------------------------------------------------------------------------------------------------------------------------------------------------------
The next portion of the script is adding a "Slow RSI"...
This is rather simple really, it allows you to add a second RSI plot so that you can watch for crossovers between fast and slow lines.
-Slow RSI: This turns on the second RSI Plot.
-Slow RSI Length: This determines the length of the second RSI Plot.
------------------------------------------------------------------------------------------------------------------------------------------------------------------------------------------------------------------------------------------------------------------
Pivot Point RSI was something a friend of mine requested I make which turned out pretty cool, I thought... It is also available in this indicator.
-Pivot Points: Selecting this enables the rest of the pivot point related parts of the script
If Pivot Points isn't selected, none of the following things will work
-Plot Pivot: Plots the pivot point .
-Plot S1/R1: Plots S1/R1.
-Plot S2/R2: Plots S2/R2.
-Plot S3/R3: Plots S3/R3.
-Plot S4/R4: Plots S4/R4.
-Plot S5/R5: Plots S5/R5.
-Plot Halfway Points: Plots a line between each pivot .
-Show Pivot Labels: Shows the proper label for each pivot .
When using intraday charts, from a 15 minute interval or less the pivots are calculated based on a single days worth of price action, above that the distance expands.
Here are the current resolutions Pivot Points will work with:
Minutes - 1 , 2, 3, 5, 10, 13, 15, 20, 30, 39, 78, 130, 195
Hours - 1, 2, 3, 4, 5, 6
Daily
Weekly
Currently not available on seconds or monthly
------------------------------------------------------------------------------------------------------------------------------------------------------------------------------------------------------------------------------------------------------------------
Background Colors
Background Colors: I have six color schemes I created for this which can be toggled here (they can be edited).
Gray Background for Dark Mode: Having this on looks much better when using dark mode on your charts.
------------------------------------------------------------------------------------------------------------------------------------------------------------------------------------------------------------------------------------------------------------------
Now finally the last portion, Fibonacci Levels
-Fibonacci Levels: This is off, by default, which then uses the standard levels on RSI (30-50-70). When turned on, it removes these and marks fib levels from 0.146 through 0.886.
------------------------------------------------------------------------------------------------------------------------------------------------------------------------------------------------------------------------------------------------------------------
So the quick rundown:
Ultimate RSI contains "divergence/volume weighted" modifications, a slow RSI plot, pivot points , and Fibonacci levels all while auto-plotting divergence and having the trend illustrated in the background colors.
RSI has always been my "go to" indicator, so I hope you all enjoy this as much as I do!

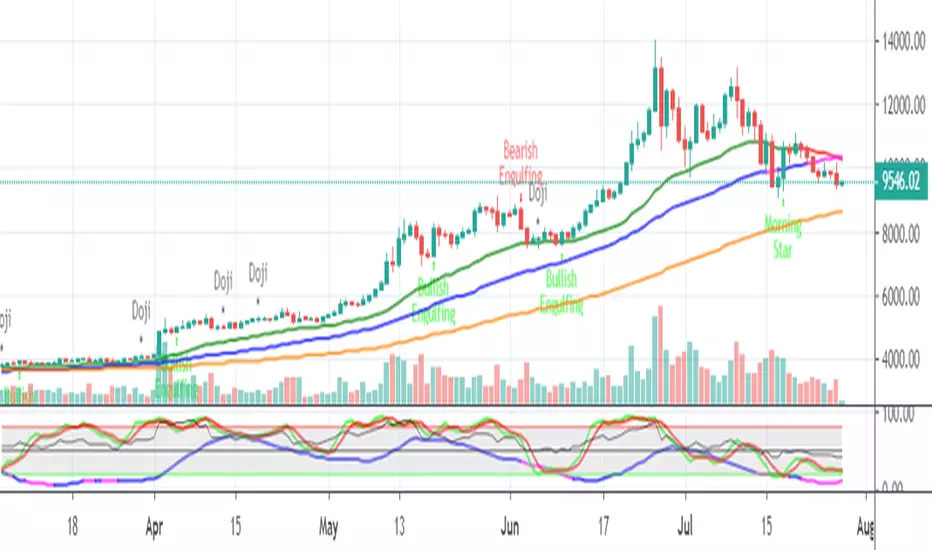
Ultimate Gemstone‘’Ultimate Gemstone = best indicator to accurately predict price movement based on momentum’’
This indicator is combination of multiple indicators (RSI, Stoch, GM, Moving averages & CCI) works on all the trading assets and time frames. Accurately predicts top and bottoms ( tested on all major crypto's, stocks and forex).
Comes with 6 different presets with different calculations giving additional flexibility to the user.
"Instructions How To Use"
This indicator is based on four different moving lines depicting momentum; first line (Aqua) is a fast trend line, which reacts rapidly to existing price action, second line (Purple) is slower and takes more price action into account, while third line (Yellow) is the slowest and depicts overall trend. Additionally, CCI/EMA moving line with changing color's (red/green) acts as a another trend confirmation tool.
The three moving lines acts as support and resistance depending on there location to each other. Non-moving parts include fibonacci support and resistance (68.2 & 38.2) areas of the oscillator. Different caution (Red, Green dots & background flashes) settings based on GM indicator to help identify perfect buying and selling opportunities. Additionally, the oscillator has oversold, overbought, bullish and bearish control zones similar to RSI/Stoch oscillators. Similar to RSI/Stoch divergences and trendlines do also work on this oscillator. Other ways to use is Aqua line crossovers with the Purple line, giving hard buy/sell signals and Aqua(fast) line turning (angle change) indicating momentum is reversing.
Example 1: When faster moving line gets pulled into the medium and slower line (especially in the overbought territory of the oscillator) gives you indication to be prepared as most likely the price will go down. Perfectly called Bitcoin top in 2017.
Example 2: BTC bottom in dec2018 and start of new trend in feb2019
Example 3 BTC Top in june2019
Example 4 works across all time frames, Recent BTC price action from 6500 to 7700.
Example 5 LINKBTC daily

Adaptive RSI by PuzzleAdaptive RSI
RSI with a twist. The values are calculated differently depending upon whether the RSI is above or below the centre point. I have found this gives:
More pronounced divergences which are easier to spot and more accurate at predicting local top and bottoms
More accurate indications of overbought/oversold conditions.

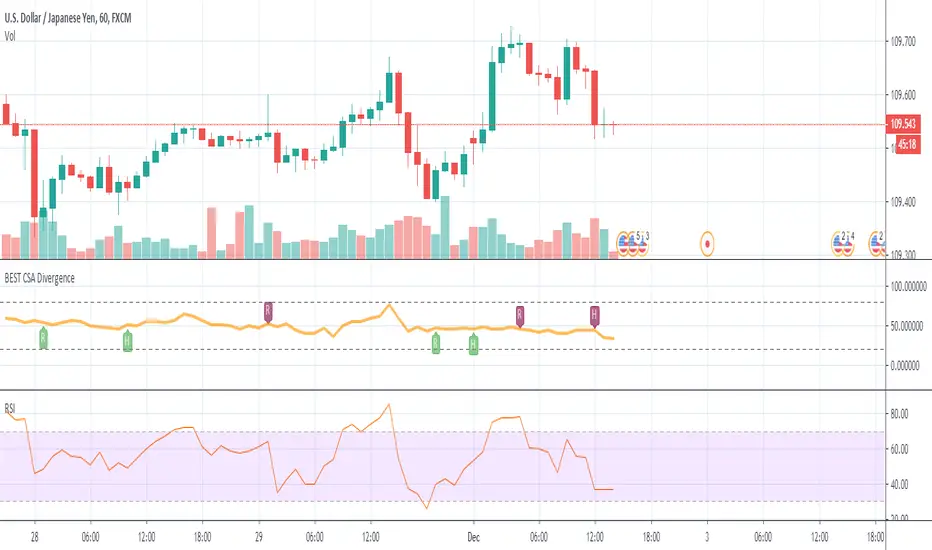
BEST Currency Strength Indicator DivergenceHello traders
Hope you had a great Thanksgiving
Now it's my turn to give and all I ask in return is you to be thankful (did I get the "Thanksgiving" thing right?)
The Currency Strength Indicator plots an average of the selected FX pairs in the indicator.
Someone asked me if I could develop an alternative of that script adding a divergence component.
The script evaluates the divergences between the average of the selected RSI(FOREX pairs) and the RSI(FOREX pair) displayed on the chart.
This version includes new features such as:
- the RSI length can now be selected
- we can select the 6 pairs used for the divergence calculations
All the BEST my aspiring traders and quants
See you tomorrow for another script
Dave
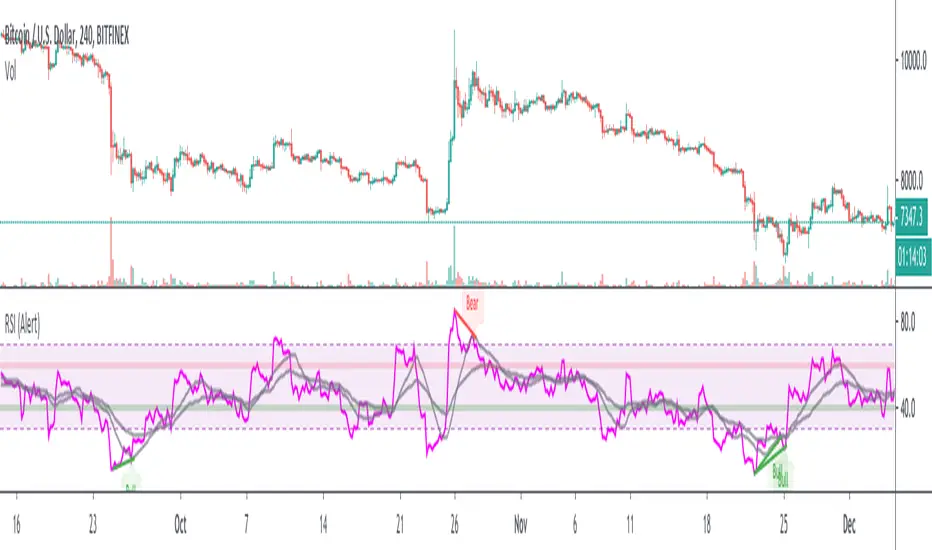
RSI w/ MAs & Divergences (Alert)This script fires off real-time RSI Divergence alerts.
To best use the RSI Divergence indicators, adjust the following settings accordingly.
• RSI Bullish Divergence Under: 20 – 45 (lower for larger volatility and more bearish markets)
• RSI Bearish Divergence Above: 55 – 80 (higher for larger volatility and more bullish markets)
Key Notes:
1. Set "Once Per Bar" instead of "Once Per Bar Close" alert.
The strategy already uses prior bar close (instead of current bar close) for calculation. This ensures that the signals will stay as they are after fired off, even when the current bar price is still changing.
2. It's OKAY to see the "alert may trigger differently than expected" warning.
Reason why you are seeing this warning is because we used a function called valuewhen() in our strategy. This function does not look at the entire history of data and has several limitations. For instance, on a 30min resolution, at the end of 2018, the function will be able to find past occurrences of BTC exceeding 16k. However, the function won't be able to find such occurrences at the end of 2019. Since our strategy is only concerned with very recent events, these limitations will not impact our results or cause repainting. You can find out more about this in the TradingView Wiki .
RSI w/ MAs & DivergencesTo best use the RSI Divergence indicators, adjust the following settings accordingly.
• RSI Bullish Divergence Under: 20 – 45 (lower for larger volatility and more bearish markets)
• RSI Bearish Divergence Above: 55 – 80 (higher for larger volatility and more bullish markets)
THIS SCRIPT DOES NOT REPAINT AND IS COMPLETELY FREE.

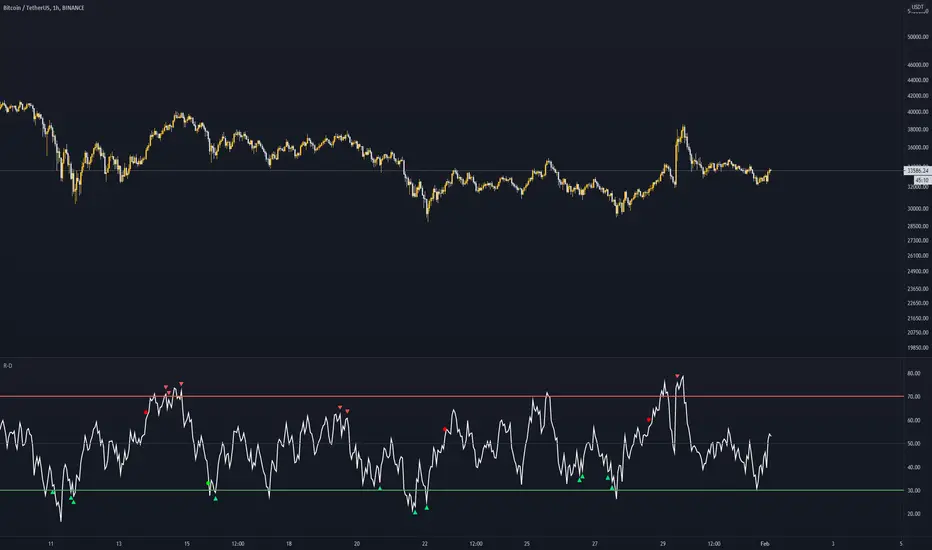
RSI DIVRSI divergence Detector
What is Divergence :
The word divergence itself means to separate and that is exactly what we are looking for today. Typically RSI will follow price as the EURUSD declines so will the indicator. Divergence occurs when price splits from the indicator and they begin heading in two different directions.
How to use :
Use the H Plot means Hidden divergence condition
Use the R Plot means Regular divergence condition
Red R above bar = Regular Bearish
Green R below bar = Bullish
Blue H Below bar = Hidden Bullish
Orange H above bar = Hidden Bearish

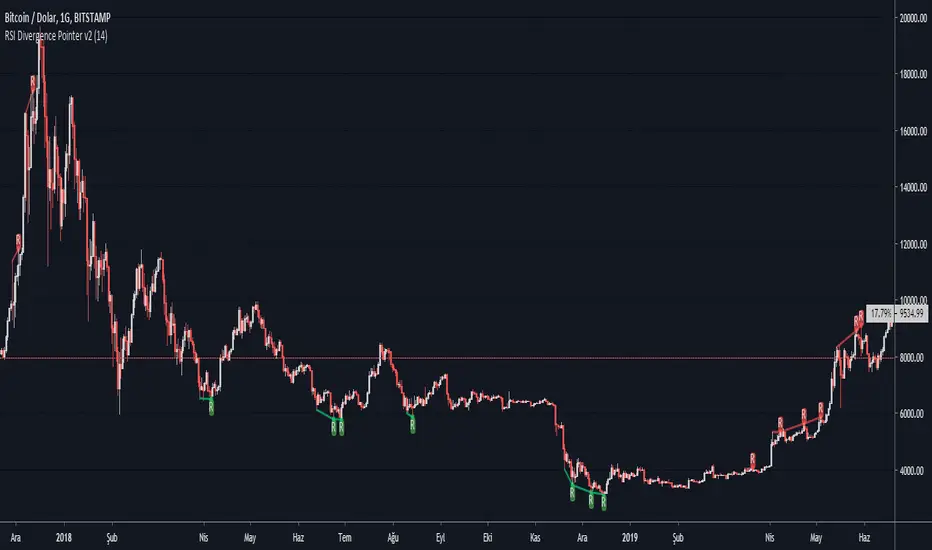
RSI Divergence Pointer v2This script points regular and optionally hidden types of bullish and bearish RSI divergences on the chart by drawing the divergence lines and optionally labels.
Hidden divergence is disabled by default, it can be enabled over settings window.
There is an option to display the price channel additionally.
Added alerts for 4 types of divergences
Titles and messages are the same:
"Regular Bearish Divergence"
"Regular Bullish Divergence"
"Hidden Bearish Divergence"
"Hidden Bullish Divergence"
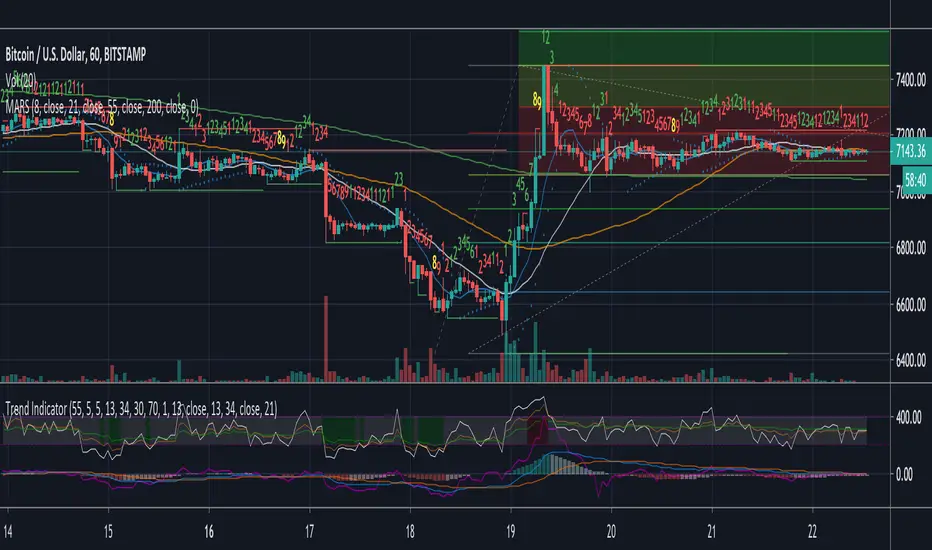
Trend Indicator
A Simple indicator combining 3 of the most popular Oscillators RSI, MacD and Momentum to help see reversals or the continuation of a trend. Designed with the COINBASE:BTCUSD chart in mind but there's not reason it shouldn't work on any other asset.
The indicator has two main parts:
- The gray area at the top between the purple dotted lines is 3 RSI's in one (5, 13, 34) These have been moved up from the RSI's original position to avoid cluttering the MacD and make the lines easier to read. Just like with the regular RSI the lower dotted line indicates oversold and the top dotted line indicates an overbought condition.
To identify this more easily the background changes to green when the middle (13 period) RSI is oversold and red when it's overbought.
*Note* On some very small timeframes the position may need to be adjusted in order to make them easier to see.
This section of the indicator is designed to give early warning signs of markets reversing by the faster white line with confirmation from the orange and green lines.
- The bottom section of the indicator has two parts. The first is a modified MacD which is slightly longer term than the original. This is to act as confirmation or entry/take profit points on divergence or if either of the lines within the MacD crossover or the histogram goes from one color to the other. The histogram is also helpful for trend-following as it lets you gauge if the momentum is gaining or losing strength.
The last part of the indicator is simply a momentum line to indicate in which direction the momentum is heading. It's designed as a confirmation of the other indicators and shouldn't be used on it's own.
All individual indicators that make up the trend indicator have been tweaked slightly to use numbers from the fibonacci sequence rather than the originals.
This indicator is best used in combination with volume and moving averages.
- Look for reversals on low volume near a moving average or key historical point.
- Look for breakouts on high volume if the oscillators line up.
Liens Standar Rsi - Divergence Rsi Divergence
This script is signaling
Bearish Divergence
Bullish Divergence
Hidden Bearish Divergence
Hidden Bullish Divergence
Alerts for all conditions.
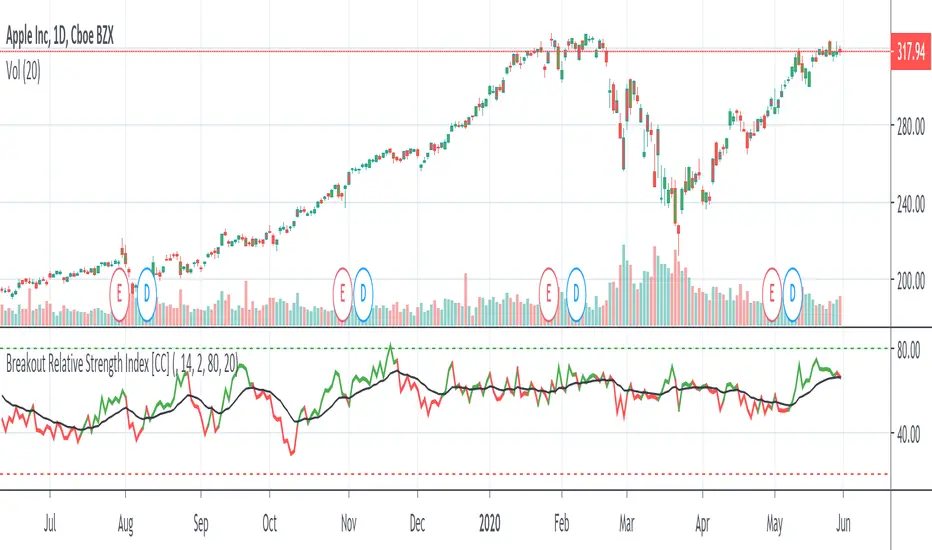
Breakout Relative Strength IndexIt isn't easy to determine if the price of a stock is about to break out. Here’s one way you can determine the relative strength of a breakout, enabling you to act early and realize higher profits.
This indicator was originally developed by Howard Wang Stocks & Commodities V. 33:09 (60–62)
BOSS Relative Strength MeterTHE BEST FOREX, STOCKS, COMMODITIES , AND CRYPTO INDICATORS FOR TRADINGVIEW.COM
The relative strength meter (RSM) is a momentum indicator that measures the magnitude of recent price changes to evaluate overbought or oversold conditions in the price of a stock or other asset.
The RSM is displayed as a color coded meter.
GREEN: Bullish Uptrend
RED: Bearish Downtrend
YELLOW: Disbursement
Highlights:
Add to any chart or time frame
Prints on the current bar in real time
DOES NOT repaint several bars after the fact
Freedom to Tune
User can change colors
Available Here: bosscripts.com
7_Day Trial: bosscripts.com

[SignalFI] RSI Prime
SignalFI RSI Prime is meant to work in unison with AO Prime.
Futures updates to follow.

MFI and RSI wih (R/H Divergence)Hello Friends,
* RSI + MFI + (Regular/Hidden) Divergence + Bullish/Bearish background colors.
* you can edit your options from indicator settings.

Hull RSI
This is an RSI that is smoothed with a faster Hull Moving Average. The upper pink and bottom teal lines represent the 95th and 5th percentiles of Hull RSI values over a window of user-defined length.
The two percentile bands function identically to the traditional upper and lower bounds used in the standard RSI setup. Buy signals are plotted as the vertical green background highlights and sell signals are the red highlights. Buy signal is generated when RSI is below the lower teal line and then crosses above it. Sell signals occur when Hull RSI was previously above the upper pink line and then crosses back under.

RSI Divergence with candle coloringHey there
This is a script requested by a friend
It's based on the RSI Divergence script from Ricardos Santos :
This version will color the candles instead of drawing an extra panel below the main chart
I set this script on Invite-only cause it's only for a friend to be used.
However, if interested, hit me up and I'll add you
Enjoy
Dave

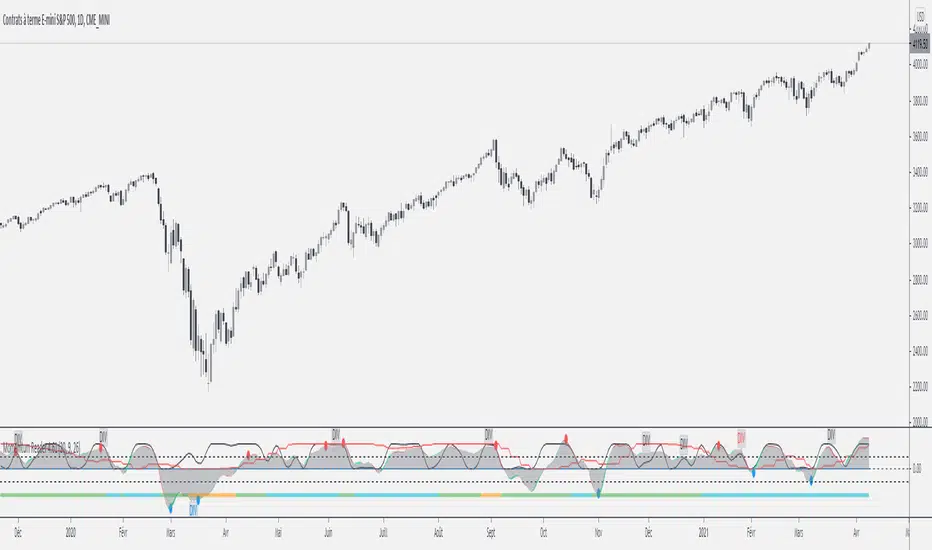
MOMEMTUM READER ULTIMATEMomemtum Reader is the complement of Market Reader it will help you to find market Top and Bottom.
(JS) Pivot Point RSILet me start by saying I really enjoyed putting this together - and also that it initially wasn't my idea, a friend of mine suggested it to me earlier today and I was intrigued by the concept.
So this is exactly what it sounds like - Pivot Points RSI.
I plan on adding the R4S4 and R5S5 in the future, though it only goes to 3 at the moment.
However I did include halfway points between existing pivots.
This RSI calculates prior closes + highs + lows based on the intraday (or week, or month, depending on chart resolution) indicator values, then takes that info and creates pivots on the RSI to plot potential RSI support and resistance. This is a pretty great concept and I plan on putting it to use in the future myself.
Includes 3 color schemes.
