Swing Structure Scanner [LuxAlgo]The Swing Structure Scanner Indicator is a dashboard type indicator which displays a Consolidated "High/Low-Only" view of swing structure, with the capability to retrieve and display swing points from up to 6 different tickers and timeframes at once.
🔶 USAGE
This indicator displays swing structure data from up to 6 unique tickers or timeframes; Each graph represents the current swing structure retrieved from the requested chart/s.
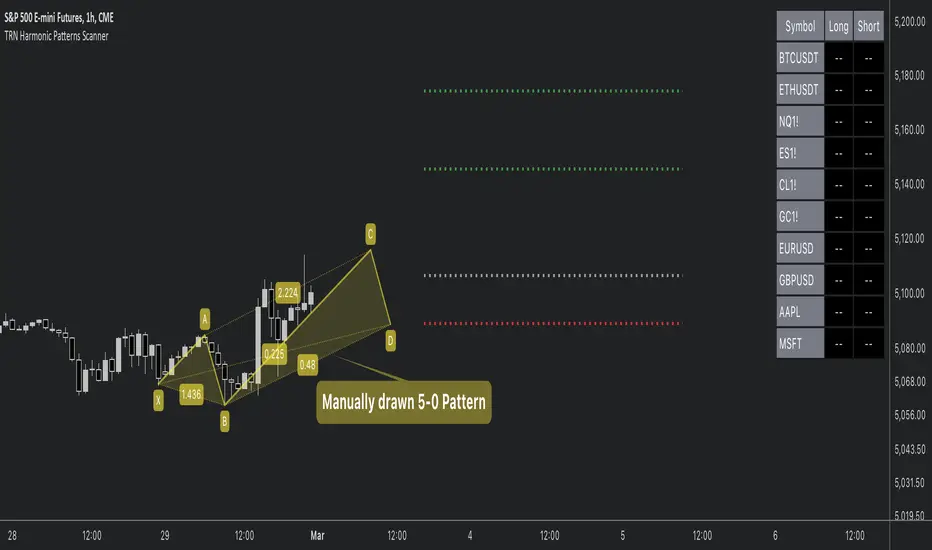
Each swing graph displays the current live swing point positioning relative to the previous swing points. By analyzing the different formations, patterns can more easily be recognized and found across multiple tickers or timeframes at once.
This indicator serves as a nifty tool for confluence recognition, whether that's confluence throughout market tickers, or confluence through higher timeframes on the same ticker.
Alternatively, viewing the relative positioning of each swing point to each other, should give a clearer idea when higher lows or lower highs are formed. This can potentially indicate a newly forming trend, as well as serving as a warning to watch for breakouts.
The swing length can be changed to align with each individual's strategy, as well as a display look back can be adjusted to show more or less swing points at one time.
The display is fairly customizable, it is not fixed to 6 symbols at all times and can be minimized to only display the number of symbols needed; Additionally, the display can be set to vertical mode or horizontal(default) to utilize as needed.
Note: Hover over the swing point in the dashboard to get a readout of the exact price level of the swing point.
🔶 SETTINGS
Swing Length: Set the swing length for the structure calculations.
Swing Display Lookback: Sets the number of swing points (Pairs) to display in each Swing Graph display.
Symbols: Sets the Timeframe and Symbol for each Swing Graph.
Vertical Display: Display the Swing Graphs up and down, rather than side to side.
Scaling Factor: Scales the entire indicator up or down, to fit your needs.
Indicatore Pine Script®