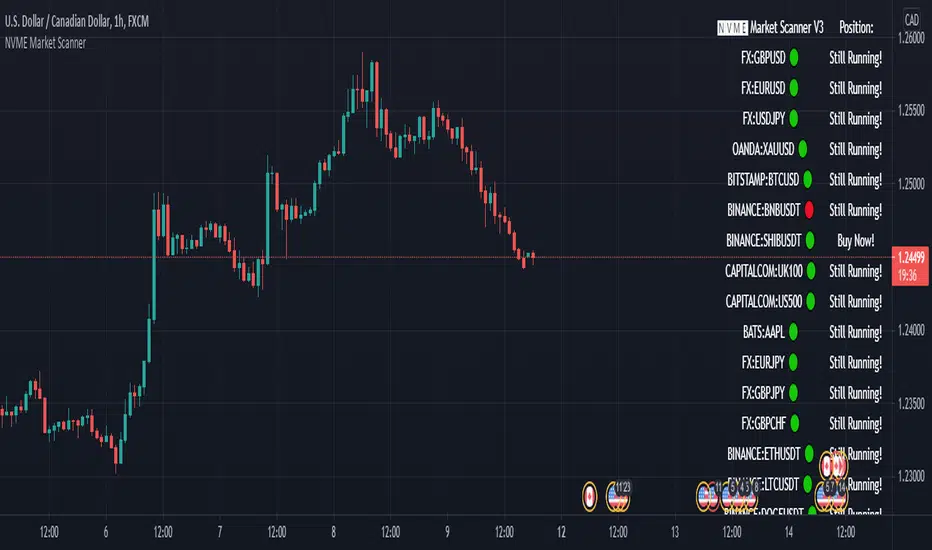
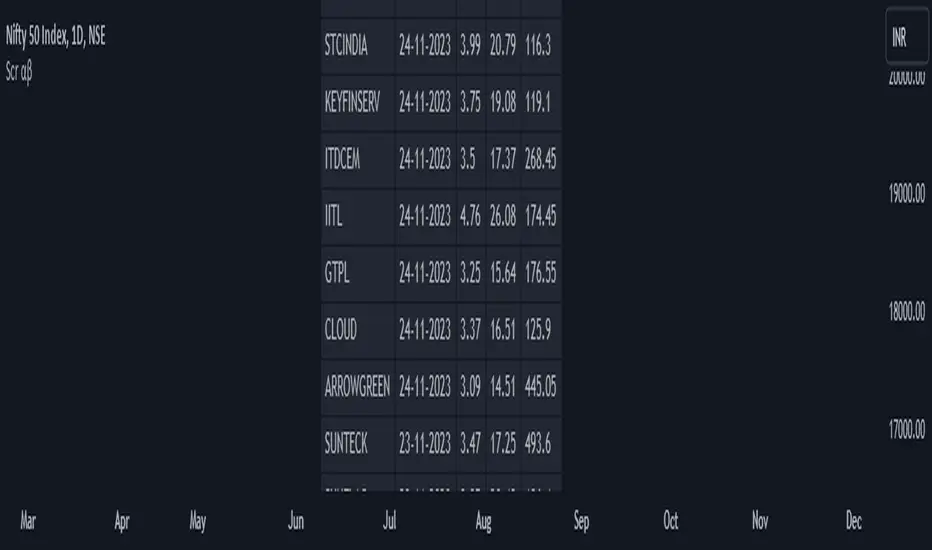
Screener Green?Based on the teachings of Rob Smith
Ability to change the timeframe and the symbols this indicator is scanning through in the input tab under settings of this indicator. Maximum symbols 40. All of the symbols need to entered. If any symbol field is left empty, the script might not work properly.
This is a simple screener which checks if the current candle is green/going up.
I add it 4 times and change the timeframes on each one to tell me if any of the symbols scanning through have FTFC(Full time frame continuity). If a symbol appears in all of the timeframes selected, it would have continuity in all those timeframe. Meaning going up in all of those timeframes.
I like to add a textbox manually on top of the labels when I change the timeframe to tell me which timeframe the indicator is scanning through.
Always double check in the settings of the indicator that the correct timeframe is selected.
First label is for all of the symbols the indicator is scanning.
Second label is the result of the scan. Text is bigger in this label than the first label to differentiate from the first label and for ease of use.
Please DM me on how to access this indicator.
Scanner
Bullish Piercing ScannerA piercing pattern is known in technical analysis to be a potential signal for a bullish reversal. The formation in its strictest form is rather rare, but tends to perform better the longer the downtrend in front of it. When technical studies such as RSI, Stochastic or MACD are showing a bullish divergence at the same time a piercing pattern appears, it strengthens the likelihood that this two-day pattern is meaningful.
This is a two-candle pattern. The previous candle must be bearish, the recent candle must open below the close of the previous candle, the recent candle must close above the middle of the previous candle. You can adjust the closing and opening gap between the two candles within this scanner's settings (price).
Kicker ScannerThe kicker pattern is deemed to be one of the most reliable reversal patterns and usually signifies a dramatic change in the fundamentals of the company in question.
It is a 2-candle pattern, whereby there is a significant gap between the body of the most recent candle and the previous candle.
A bullish kicker is one in which the most recent candle is bullish, and the previous candle is bearish.
A bearish kicker is one in which the most recent candle is bearish, and the previous candle is bullish.
I notice this works best for stocks, as there are many gaps in a stock chart. Currencies have few gaps, and thus few kickers.
From within the settings, you can set the minimum permitted gap between the two candles, specified in price, accurate to 6 decimal places; 0.000001.
Tweezer Scanner v1Some code for detecting tweezer candles, which are reversal patterns. You'll need to tweak the settings to be either less strict (more detections) or more strict (less detections). I found that if you follow the documentation for tweezers exactly, you will get very few detections. It is possible that this candlestick has become overused, so the original pattern itself has been lost to the noise of the market.
Settings:
1. Tweezer Max Body Height (Pips) - How tall can the body of the tweezer be, in pips (increase this pips to increase detections)
2. Tweezer Body Similarity (>%) - How similar should the body heights be, higher percentage is more similar (reduce this % to increase detections)
3. Tweezer Tail Similarity (>%) - How similar should the tail heights be, higher percentage is more similar (reduce this % to increase detections)
4. Tweezer Tail Proportion (<%) - How short should the opposite tail heights be, lower percentage is shorter and more similar to the documentation (increase this % to increase detections)
Marubozu Scanner v1Some code for detecting the very rare occurrences of the Marubozu candle. This candle occurs when the High = Close, and Low = Open, or vice versa. They are continuation candles, so if you see a bullish Marubozu during an uptrend its possible that the uptrend will continue.
Doji Scanner v1A scanner for detecting Doji Candles.
Adjust the maximum allowable height of a Doji Candle's body, depending on the currency pair or asset.
Detect Sequential Trading - Bot DetectorDetect Sequential Trading - Bot Detector.
This tool requires access to volume data .
There are many trading bots out there, that trade 24/7 .
The detector can be used to understand how the bots are configured - to push the market up or down .
Alerts can be set to fire whenever a bot pattern is detected .
They must be configured to run Once per Bar .
It works well with range charts (1R) .
It would work best on 1 second charts or tick charts (currently, TradingView's alert system doesn't work with second charts).
The alternative would be 1 minute charts .
It can be used on higher timeframes but may be less effective.
ADEDEJI_SPYDER_v.yThis indicator is a scanner and it works effectively for any digital market on tradingview.
This version scans a preset group of instruments on NASDAQ and NYSE for stocks that meet preset and built-in conditions favorable for potential positive price action movements. This can significantly and greatly reduce the time required to manually search the market looking for great setups.
The assets in this version's search list (and the exchange) are:
AAPL (NASDAQ)
ABMD (NASDAQ)
ACIA (NASDAQ)
ADBE (NASDAQ)
AMAT (NASDAQ)
AMD (NASDAQ)
AMZN (NASDAQ)
ATVI (NASDAQ)
BABA (NYSE)
BIDU (NASDAQ)
BLK (NYSE)
CAT (NYSE)
CMG (NYSE)
COST (NASDAQ)
DIS (NYSE)
FB (NASDAQ)
GOOG (NASDAQ)
JMIA (NYSE)
JPM (NYSE)
KO (NYSE)
MSFT (NASDAQ)
NFLX (NASDAQ)
NKE (NYSE)
TSLA (NASDAQ)
UBER (NYSE)
SPX (TVC)
How to use:
Simply add the indicator to your chart, wait for the scan/search to be complete and the result displayed. Go to any of the displayed pairs and as you normally would, time your entries with your preferred tools and TA.
Development/improvement is a continuous thing!
Disclaimer:
Past performance does not guarantee future results. This tool/indicator is for educational purposes. As always you should fully understand there are high risks involved when trading cryptocurrencies and other digital instruments.
ADEDEJI_SPYDER_v.xThis indicator is a scanner and it works effectively for any digital market on tradingview.
It scans a preset group of instruments for tickers that meet preset and built-in conditions favorable for potential positive price action movements. This can significantly and greatly reduce the time required to manually search the market looking for great setups.
The assets in the search list (and the exchange) are:
1. AUDNZD (FXCM)
2. AUDUSD (FXCM)
3. CADCHF (FXCM)
4. CADJPY (FXCM)
5. CHFJPY (FXCM)
6. EURAUD (FXCM)
7. EURCHF (FXCM)
8. EURGBP (FXCM)
9. EURJPY (FXCM)
10. EURNZD (FXCM)
11. EURUSD (FXCM)
12. GBPCHF (FXCM)
13. GBPJPY (FXCM)
14. GBPUSD (FXCM)
15. NZDJPY (FXCM)
16. NZDUSD (FXCM)
17. USDCAD (FXCM)
18. USDCHF (FXCM)
19. USDJPY (FXCM)
Including:
a. NATGASUSD (OANDA)
b. UKOIL (TVC)
c. XAUUSD (OANDA)
d. USOIL (TVC)
How to use:
Simply add the indicator to your chart, wait for the scan/search to be complete and the result displayed. Go to any of the displayed pairs and as you normally would, time your entries with your preferred tools and TA.
Development/improvement is a continuous thing!
Disclaimer:
Past performance does not guarantee future results. This tool/indicator is for educational purposes. As always you should fully understand there are high risks involved when trading cryptocurrencies and other digital instruments.
Adedeji_Spyder_v1.0This indicator is a scanner; it scans Bitmex and Binance markets for tickers that meet certain conditions favorable for potential positive price action movements. It significantly and greatly reduces the time required for you to scan the market looking for great setups so you can focus on your entires.
It works efficiently for majority of the most commonly used time-frames (15m, 30m, 45m, 1H, 2H, 3H, 4H, 6H, 12H, 18H, 1D, 2D, 3D and 1W).
Tool is best used in conjunction with my other scripts:
1. Cynotronic Divergence tool () or any other reliable momentum indicator
2. Adedeji_Edge ()
How to use:
Simply add the indicator to your chart, wait for the scan/search to be complete and the result displayed. Go to any of the pairs and as you normally would, time your entries by using Adedeji_Edge_v1.1
It's advised to keep a keen eye on demand and supply zones (draw relevant SUP, RES as well as dynamic trendlines on the charts) as targets and take profit zones. The suggested divergence tool gives reliable indication of areas where there is strength or weakness.
This tool scans only 40 tokens/coins made up of present (not futures) tickers from Bitmex and the current top volume coins/tokens from Binance. The list is not automatically generated; it will be updated regularly as such list is not static but dynamic.
Development/improvement is a continuous thing!
Disclaimer:
Past performance does not guarantee future results. This tool/indicator is for educational purposes. As always you should fully understand there are high risks involved when trading cryptocurrencies and other digital instruments.
BORSACA SCANNER SCREENER ANALYS EXPLORER DASHBOARDBORSACA SCANNER SCREENER ANALYS EXPLORER DASHBOARD
This is a signal scanner for your portfolio. You can add your stocks, fx, crypto and analys for buy and sell signal.
You can set up in settings trend strategy. And you can follow the Borsaca Trader indicator buy and sell signal.
You can watch 20 pair on one indicator. You can create more template and watch more a custom layout for signals :) Yeah
This is the best. Good luck.
Screener - Multi Timeframe [WYCKOFF ARSENAL]Screener - Multi Timeframe WYCKOFF ARSENAL
The general idea of The Wyckoff Method is that the trader can see the market as well-structured periods of Accumulation , Markup , Distribution and Markdown .
The price of an asset depends on its supply and demand .
There is more than one stock available for trading, and there is more than just Bitcoin on the Cryptocurrency market.
This means that one may choose to trade more than one asset and this perspective opens up a world of opportunities in which Supply and Demand are the masters.
For example, you have invested some money in a cryptocurrency, and you wait for it to Markup already.
But it is still in a long period of accumulation - it doesn't move much.
You should leave it and find another crypto that is moving.
To aid in the discovery of such opportunities, a Market Screener is available.
Method used: The Wyckoff Method of course.
The indicators used:
• Optimism Pessimism
• Force
• Technometer
• Momentum
The Wyckoff Arsenal Indicators can be used individually, and they are very useful when trading a single pair.
But the Market Screener can scan for opportunities in a wide range of pairs, or same asset but different trading platforms.
The indicators are based on volume, so the symbols must have volume data for the Screener to work.
Multiple indicator instances can be used to track a specific asset, like Bitcoin.
This way, all Bitcoin data available on TradingView could be used instead of data coming from a single trading platform.
Alerts: Overbought/Oversold conditions, Bollinger Bands crossings, Divergence detection.
WolfeWaves SCANNER V2 - Market Scanner for Wolfe Wave Pattern
HI BIG PLAYERS AROUND THE WORLD,
this script allow to find Wolfe Wave Pattern in any market at the same time. One indicator can scan 6 markets/symbols - what ever you choose. For more markets you have to take the indicator more then once in your chart (look on my posting chart above).
Parallel the indicator gives signals as soon as Wolfe Waves are near finish pattern on point 5. In the default settings, the signals are displayed with a blue background on the chart. The markets with Wolfe Waves can you then read on the label in your chart.
The timeframe you currently has open is also the timeframe where the market scanner analyze the other markets / symbols in the background.
WolfeWaves SCANNER V2 is offered for sale. More information can be found below in the signature.
However, anyone can test this indicator for once without any registration in a 3 day trial. You can request access with a simple message to me.
Another trial of 7 days is included in the offer on my website - before the first payment will done.
When testing, please check whether your system requirements are sufficient. The many labels require a lot of memory from your computer.
For more great indicators everyone is invited to follow me on TradingView.
Kind regards
NXT2017
BUY SIGNALS (R-V-B)BUY SIGNALS
Get free buy signals that help you make a choice to step in. This is meant to quickly book small profits between 0.75% and 1%. Keep a close eye on the BTC at all times, take a good look at the history of the coin to see how the buy signals went. Good luck!
This module does not give you a guarantee that you will always make a profit, so it can also happen that it is not always successful. possibly also analyze the coin, be careful at all times. Happy trading!
TTM Squeeze Scanner This script scans for TTM Squeezes for the crypto symbols included in the body of the script. The timeframe for the squeeze scan is controlled within the input not the chart.
This script is a merge of @Nico.Muselle's TTM Squeeze script and @QuantNomad's custom screener script. Thanks to both of them!
Sifo's Binary StrategyBinary Strategy with signals, it uses more than 10 indicators in JUST 1. It has 3 different signals, the more signals you have, a better trade it is. You can also set alerts with it.
Inbox for price
-In the markets nothing is a 100% accurate.
CMC Top 5 RSI ScannerScan the RSI for the top 5 cryptos now!
No need to switch between charts anymore. You just need to activate this script and you will have a global view of the current RSI status for your favorite coins. Feel free to edit the source code yourself to add / remove more coins to the scan list.
The transparency will change if the RSI go over the overbuy / oversell zone (default 80/20)
Also, you should display the label names and values on the chart (click on the gear settings at the bottom of your chart > Select "Labels" > Select "Indicator Name label" & "Indicator Last Value Label")
Enjoy!
Profitable SMA CrossoverWhat is this tool?
This tool is a performance scanner of the crossover trading system that is based on the two simple moving averages (SMA). It uses a decision tree-based algorithm under the hood to find and plot the most profitable periods of the SMA combination.
It analyzes the range of periods between 4 to 45 and backtests each combination across the entire history of an instrument. If the more profitable periods were detected the indicator will switch periods of the moving averages immediately.
This is an add-on for the Ingenious SMA Crossover but can be used standalone.
Alerts
It has an alert that notifies when the more profitable periods were detected.
NOTE : It does not change what has already been plotted.
Good luck!
Tweezer ScannerThis indicator highlights the tweezer tops and tweezer bottoms on the chart it is applied on.
Per the definition, a tweezer top is a candlestick pattern in which the first candle is bullish, the second one is bearish and they have the same high. Other traders define a tweezer top using the close of the first candle and the open of the second one, but the indicator currently supports only comparison based on the high of these candles. Future updates might contain support for the alternative definition of a tweezer top, if requested.
Per the definition, a tweezer bottom is a candlestick pattern in which the first candle is bearish, the second one is bullish and they have the same low. Other traders define a tweezer bottom using the close of the first candle and the open of the second one, but the indicator currently supports only comparison based on the low of these candles. Future updates might contain support for the alternative definition of a tweezer bottom, if requested.
By default, the indicator requires that the tweezer top is also a pivot high, and the tweezer bottom is also a pivot low. These options can be disabled in the Settings panel of the indicator. The indicator scans for a customizable number of candles to the left and to the right of the potential pivot.
The plot line contains both upward and downward spikes, depending on the type of tweezers the indicator finds. It is useful when the chart is zoomed out and the colored candles cannot be easily seen.
Bollinger Band Open Gap Alert V1This is the bare bones of what I'm trying to achieve through pine script. The purpose of the script is to:
1. On a 15m chart, calculate and plot upper & lower Bollinger bands and simple moving average of 20 periods. (DONE)
2. On a new day, when the first 15m candle of a session forms, I want to check if a) the low of the new candle is outside the upper Bollinger band (also known as an open gap up) or b) if the high of the candle is the outside the lower Bollinger band (also known as open gap down). In other words, I want to know if the Bollinger Bands are not touching the new candle's wicks/shadows. (DONE)
3. Alert me if the above happens. (DONE)
4. Run the indicator through an entire watch list. I'm not sure if that's possible, yet. (HELP)
For the above job, this is what I could come up with. I need guidance for the last step . And any suggestions for corrections or improvements would be greatly appreciated!
PA Patterns Multi CRYPTOThis is the version for cryptocurrencies of my scanner for forex majors
The scope of this script is to work as a scanner of pin bars and engulfing candles of the crypto market.
Best to use with time frames Daily and 4h, lower timeframes gives too many results and may be noisy without trend filter.
Next improvement will be:
- To display in a better way the results, but actually you have to zoom in and out if some results are overlapping.
As the other one, this has alerts and trend filter.
If you like it, please leave a comment and follow me.
Thank you.