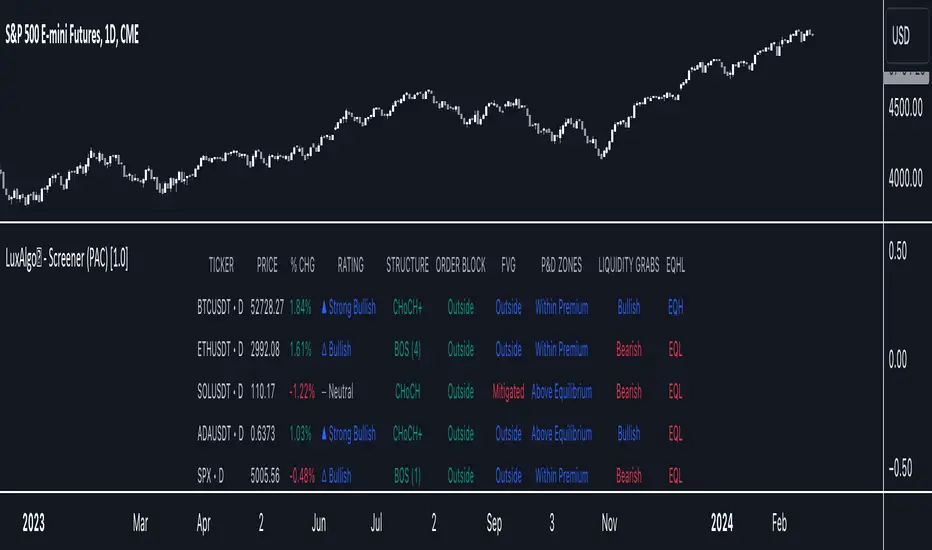
LuxAlgo® - Screener (PAC)The LuxAlgo® - Screener (PAC) is a complete tool allowing users to check returned information from the Price Action Concepts™ toolkit's features for various user selected tickers and timeframes.
Users can customize the returned information by the screener, as well as filtering out displayed tickers based on custom user set rules.
🔶 FEATURES
Users can place the location of the screener everywhere they want, multiple locations are supported, you can even have it on your chart by drag and dropping the screener to your chart, allowing you to analyze them alongside your favorite indicators.
Keeping track of various tickers is crucial to have a deeper understanding of the overall market activity.
Our screener let you quickly access your preferred information in a convenient way thanks to the described features below:
Screening of the main Price Action Concepts™ features on up to 10 user selected tickers and timeframes.
Ticker filtering based on custom user set rules.
Ticker sorting based on ascending/descending user selected data returned by the screener.
The LuxAlgo® - Screener (PAC) returns the following information:
Current price
Current volume
Current price percent change (% CHG)
Current price change (CHG)
Current rating
Most recent market structure
Most recent Order Block type and relative position to price
Order Block buy volume
Order Block sell volume
Order Block total volume
Most recent user set imbalance type status. Options include screening for FVG, Inverse FVG, Double FVG, Volume Imbalance and Opening Gap
Price position relative to Premium/Discount zones
Most recent liquidity grab
Most recent equal high/low
🔹 Rating
Users can quickly check the overall sentiment based on the screeners returned information by looking at the Rating column. Tickers can be rated as follows:
▲ Strong Bullish (more than 80% of the returned information is bullish)
△ Bullish (60% to 80% of the returned information is bullish)
― Neutral (40% to 60% of the returned information is bullish)
▽ Bearish (20% to 60% of the returned information is bullish)
▼ Strong Bearish (less than 20% of the returned information is bullish)
This can be a quick way to asses the confluence between all the returned information on the screener for a specific ticker.
🔹 Filtering
Thanks to the integrated filtering capabilities of the LuxAlgo® - Screener (PAC) you will be able to keep track of the information from tickers that return specific information you want to see.
For example do you want to only see the information from up trending tickers? Nothing easier, all you need is to select the up trending related options (▲ Strong Bullish or △ Bullish) in the rating dropdown menu.
However, you don't have to stop at 1 filtering condition, create more complex ones that fits your trading style for the tickers you truly want to look at!
🔹 Sorting
As traders we want to quickly spot the tickers with most volume, most volatility, with the strongest uptrend or downtrend.
The LuxAlgo® - Screener (PAC) lets you do that by sorting supported information in an ascending or descending order, letting you access the most relevant information faster.
Screener
LuxAlgo® - Screener (S&O)The LuxAlgo® - Screener (S&O) is a complete tool allowing users to check returned information from Signals & Overlays™ features for various user selected tickers and timeframes.
Users can customize the returned information by the screener, as well as filtering out displayed tickers based on custom user set rules.
🔶 FEATURES
Users can place the location of the screener everywhere they want, multiple locations are supported, you can even have it on your chart by drag and dropping the screener to your chart, allowing you to analyze them alongside your favorite indicators.
Keeping track of various tickers is crucial to have a deeper understanding of the overall market activity.
Our screener let you quickly access your preferred information in a convenient way thanks to the described features below:
Screening of the main Signals & Overlays™ features on up to 10 user selected tickers and timeframes.
Ticker filtering based on custom user set rules.
Ticker sorting based on ascending/descending user selected data returned by the screener.
The LuxAlgo® - Screener (S&O) returns the following information:
Current price
Current volume
Current price percent change (% CHG)
Current price change (CHG)
Current rating
Most recent signal
Number of Exits since most recent signals
Current Smart Trail status
Current Reversal Zones status
Current Trend Catcher status
Current Trend Tracer status
Current Neo Cloud status
Current Trend Strength value
Current Lux Volatility value
Current Squeeze Index value
Current Volume Sentiment value
🔹 Rating
Users can quickly check the overall sentiment based on the screeners returned information by looking at the Rating column. Tickers can be rated as follows:
▲ Strong Bullish (more than 80% of the returned information is bullish)
△ Bullish (60% to 80% of the returned information is bullish)
― Neutral (40% to 60% of the returned information is bullish)
▽ Bearish (20% to 60% of the returned information is bullish)
▼ Strong Bearish (less than 20% of the returned information is bullish)
This can be a quick way to asses the confluence between all the returned information on the screener for a specific ticker.
🔹 Filtering
Thanks to the integrated filtering capabilities of the LuxAlgo® - Screener (S&O) you will be able to keep track of the information from tickers that return specific information you want to see.
For example do you want to only see the information from up trending tickers? Nothing easier, all you need is to select the up trending related options (▲ Strong Bullish or △ Bullish) in the rating dropdown menu.
However you don't have to stop at 1 filtering condition, create more complex ones that fits your trading style for the tickers you truly want to look at!
🔹 Sorting
As traders we want to quickly spot the tickers with most volume, most volatility, with the strongest uptrend or downtrend.
The LuxAlgo® - Screener (S&O) lets you do that by sorting supported information in an ascending or descending order, letting you access the most relevant information faster.

Overbought / Oversold Screener## Introduction
**The Versatile RSI and Stochastic Multi-Symbol Screener**
**Unlock a wealth of trading opportunities with this customizable screener, designed to pinpoint potential overbought and oversold conditions across 17 symbols, with alert support!**
## Description
This screener is suitable for tracking multiple instruments continuously.
With the screener, you can see the instant RSI or Stochastic values of the instruments you are tracking, and easily catch the moments when they are overbought / oversold according to your settings.
The purpose of the screener is to facilitate the continuous tracking of multiple instruments. The user can track up to 17 different instruments in different time intervals. If they wish, they can set an alarm and learn overbought oversold according to the values they set for the time interval of the instruments they are tracking.**
Key Features:
Comprehensive Analysis:
Monitors RSI and Stochastic values for 17 symbols simultaneously.
Automatically includes the current chart's symbol for seamless integration.
Supports multiple timeframes to uncover trends across different time horizons.
Personalized Insights:
Adjust overbought and oversold thresholds to align with your trading strategy.
Sort results by symbol, RSI, or Stochastic values to prioritize your analysis.
Choose between Automatic, Dark, or Light mode for optimal viewing comfort.
Dynamic Visual Cues:
Instantly highlights oversold and overbought symbols based on threshold levels.
Timely Alerts:
Stay informed of potential trading opportunities with alerts for multiple oversold or overbought symbols.
## Settings
### Display
**Timeframe**
The screener displays the values according to the selected timeframe. The default timeframe is "Chart". For example, if the timeframe is set to "15m" here, the screener will show the RSI and stochastic values for the 15-minute chart.
** Theme **
This setting is for changing the theme of the screener. You can set the theme to "Automatic", "Dark", or "Light", with "Automatic" being the default value. When the "Automatic" theme is selected, the screener appearance will also be automatically updated when you enable or disable dark mode from the TradingView settings.
** Position **
This option is for setting the position of the table on the chart. The default setting is "middle right". The available options are (top, middle, bottom)-(left, center, right).
** Sort By **
This option is for changing the sorting order of the table. The default setting is "RSI Descending". The available options are (Symbol, RSI, Stoch)-(Ascending, Descending).
It is important to note that the overbought and oversold coloring of the symbols may also change when the sorting order is changed. If RSI is selected as the sorting order, the symbols will be colored according to the overbought and oversold threshold values specified for RSI. Similarly, if Stoch is selected as the sorting order, the symbols will be colored according to the overbought and oversold threshold values specified for Stoch.
From this perspective, you can also think of the sorting order as a change in the main indicator.
### RSI / Stochastic
This area is for selecting the parameters of the RSI and stochastic indicators. You can adjust the values for "length", "overbought", and "oversold" for both indicators according to your needs. The screener will perform all RSI and stochastic calculations according to these settings. All coloring in the table will also be according to the overbought and oversold values in these settings.
### Symbols
The symbols to be tracked in the table are selected from here. Up to 16 symbols can be selected from here. Since the symbol in the chart is automatically added to the table, there will always be at least 1 symbol in the table. Note that the symbol in the chart is shown in the table with "(C)". For example, if SPX is open in the chart, it is shown as SPX(C) in the table.
## Alerts
The screener is capable of notifying you with an alarm if multiple symbols are overbought or oversold according to the values you specify along with the desired timeframe. This way, you can instantly learn if multiple symbols are overbought or oversold with one alarm, saving you time.

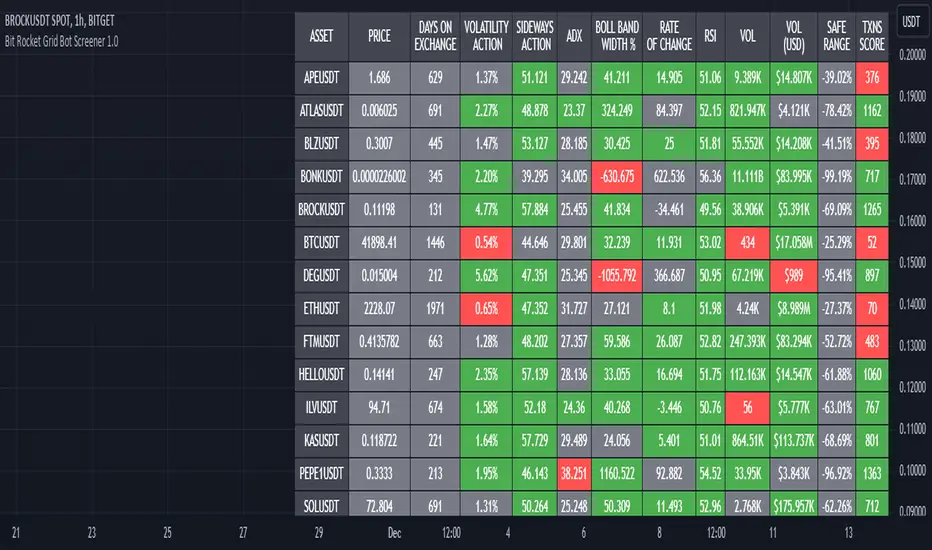
Bit Rocket Grid Bot Screener 1.0DESCRIPTION
A grid bot is an automated trading bot that is designed to execute buy and sell orders based on a pre-defined grid of prices. Grid bots operate within a specified price range, placing trades at set intervals above and below the current market price. The key idea behind a grid bot is to take advantage of price fluctuations and market volatility, not looking for trends or breakouts.
The optimal trading pair for a grid bot is one that exhibits frequent oscillations within a predictable range while demonstrating a slight upward trend. In simpler terms, it's a pair that consistently fluctuates within the same range.
The Grid Bot Screener serves as a valuable tool for identifying the most suitable trading pairs, by showing the indicators that matter the most for sideways Grid Bot trading. Most screeners look for trends, breakouts and use indicators that are used for assisting the trader with when to buy and sell. This indicator assists in the selection of pairs that are likely to yield the best results for high volatility sideways trading.
USAGE
This screener looks at volatility, sideways action, ADX, and other indicators that are most helpful when determining the amount and potential volatility, sideways action, and transactions for up to twenty pairs at a time.
Each indicator has a threshold that the user can set themselves, this way the user is in control when comparing or hunting for the optimal pairs.
User selects up to twenty pairs, sets thresholds if different than defaults, then sets length (how far back to look). Once this is set the user can quickly look and compare the results.
KEY INDICATORS
VOLATILITY ACTION - Percentage of Price Action Volatility; Temporal Volatility Trends; Elevated price action signifies accelerated price fluctuations, disregarding directional cues.
SIDEWAYS ACTION - The higher the value, the greater the horizontal movement; a robust trend, which is not our objective, provides no directional insight.
Values exceeding 45 indicate pronounced sideways activity, while lower values approaching zero signify a vigorous trend.
These values do not assist in determining the trend direction.
Higher values imply a more sideways orientation, whereas lower values indicate a more pronounced trend.
ADX - Does not indicate trend direction; instead measures trend strength.
An indicator for price range
Lower values signal a weak trend
Higher values denote a robust trend
Strategy: Look for values of 25 or lower which indicate a ranging or neutral trend.
TXNS SCORE – Transaction Activity.
TXNS indicator represents grid performance and serves as a direct measure of trading activity. TXNS accumulates the number of buy and sell actions, reflecting the user-defined grid percentage.
Elevated transaction numbers signify increased activity, leading to enhanced bot profitability.
NOTE: For an accurate representation of the actual number of transactions, use the Bit Rocket Transactions indicator on the 30min time frame.
CONFIRMATION INDICATORS
While the key indicators are generally reliable on their own, it's also valuable to assess how well the asset is performing and its historical trajectory. The confirmation indicators provide valuable insights into an asset's performance and direction, reinforcing the assessments made through the key indicators, again these indicators on their own are not enough they must be used in conjunction with the key indicators.
VOL - Trading Activity: For assets engaged in sideways trading, sufficient volume is necessary, but it doesn't need to be as high as you might expect.
VOL(USD) - USD-Based Activity: A high USD volume signifies strong market interest.
ROC - Rate of Change Percentage: This metric calculates the percentage change in price over a specified date range. Shows trend direction using price percentage.
• Avoid extremely high or extremely low values.
o Excessively high values may indicate overbought conditions with potential for a price correction.
o Very low values could imply waning interest and diminished asset value.
o Conversely, high values might indicate asset strength, while low values could suggest that the asset has reached a bottom and is unlikely to decrease further.
BOLLINGER BAND WIDTH PERCENT - Average MACD Percentage Width, percent is used with Bollinger bands to allow for comparison with other assets.
RSI - Buying and Selling Pressure Strength: When assessing RSI, look for a balance between buying and selling pressure while still maintaining high volatility and sideways strength. Key RSI levels to consider:
• 40-60: Neutral range, indicating equilibrium and stability.
• Above 70: Approaching overbought conditions.
• Below 30: Nearing oversold conditions.
These confirmation indicators provide valuable insights into an asset's performance and direction, reinforcing the assessments made through the key indicators.
ADDITIONAL INDICATORS
DAYS ON EXCHANGE – This metric reveals how long the crypto pair has been listed on the exchange. It serves multiple purposes, such as assessing the data's historical depth and indicating whether the crypto might be relatively new. Keep in mind that while the asset could exist for a while, it might not have been available on the exchange for an extended period.
PRICE – This merely states the current price, making it suitable for those focusing on price action, it is provided for informational value only.
SAFE RANGE – This percentage indicates the price movement range from the highest to the lowest within a specified data range. Use this to determine the upper and lower levels for setting up your grid range.
RSI Heatmap Screener [ChartPrime]The RSI Heatmap Screener is a versatile trading indicator designed to provide traders and investors with a deep understanding of their selected assets' market dynamics. It offers several key features to facilitate informed decision-making:
█ Custom Asset Selection:
The user can choose up to 30 assets that you want to analyze, allowing for a tailored experience.
█ Adjustable RSI Length:
Customize your analysis by adjusting the RSI length to align with your trading strategy.
█ RSI Heatmap:
The heatmap feature uses various colors to represent RSI values:
█ Color coding for labels:
Grey: Signifies a neutral RSI, indicating a balanced market.
Yellow: Suggests overbought conditions, advising caution.
Pale Red: Indicates mild overbought conditions in a strong area.
Bright Red: Represents strong overbought conditions, hinting at a potential downturn.
Pale Green: Signals mild oversold conditions with signs of recovery.
Dark Green: Denotes full oversold conditions, with potential for a bounce.
Purple: Highlights extremely oversold conditions, pointing to an opportunity for a relief bounce.
█ Levels:
Central Plot and Zones: The central plot displays the average RSI of the selected assets, offering an overview of market sentiment. Overbought and oversold zones in red and green provide clear reference points.
█ Hover Labels:
Hover over an asset to access details on various indicators like VWAP, Stochastic, SMA, TradingView ranking, and Volume Rating. Bullish and bearish indicators are marked with ticks and crosses, and a fire emoji denotes heavily overextended assets.
█ TradingView Ranking:
Utilize the TradingView ranking metric to assess an asset's performance and popularity.
Thank you to @tradingview for this ranking metric.
█ Volume Rating:
Gain insights into trading volumes for more informed decision-making.
█ Oscillator at the Bottom:
The RSI average for the entire market, presented in a normalized format, offers a broader market perspective. Green indicates a favorable buying area, while red suggests market overextension and potential short or sell opportunities.
█ Heatmap Visualization:
Historical RSI values for each selected asset are displayed. Red indicates overbought conditions, while green signals oversold conditions, helping you spot trends and potential turning points.
This screener is designed to make entering the market simpler and more comprehensive for all traders and investors.

Volume and Price Z-Score [Multi-Asset] - By LeviathanThis script offers in-depth Z-Score analytics on price and volume for 200 symbols. Utilizing visualizations such as scatter plots, histograms, and heatmaps, it enables traders to uncover potential trade opportunities, discern market dynamics, pinpoint outliers, delve into the relationship between price and volume, and much more.
A Z-Score is a statistical measurement indicating the number of standard deviations a data point deviates from the dataset's mean. Essentially, it provides insight into a value's relative position within a group of values (mean).
- A Z-Score of zero means the data point is exactly at the mean.
- A positive Z-Score indicates the data point is above the mean.
- A negative Z-Score indicates the data point is below the mean.
For instance, a Z-Score of 1 indicates that the data point is 1 standard deviation above the mean, while a Z-Score of -1 indicates that the data point is 1 standard deviation below the mean. In simple terms, the more extreme the Z-Score of a data point, the more “unusual” it is within a larger context.
If data is normally distributed, the following properties can be observed:
- About 68% of the data will lie within ±1 standard deviation (z-score between -1 and 1).
- About 95% will lie within ±2 standard deviations (z-score between -2 and 2).
- About 99.7% will lie within ±3 standard deviations (z-score between -3 and 3).
Datasets like price and volume (in this context) are most often not normally distributed. While the interpretation in terms of percentage of data lying within certain ranges of z-scores (like the ones mentioned above) won't hold, the z-score can still be a useful measure of how "unusual" a data point is relative to the mean.
The aim of this indicator is to offer a unique way of screening the market for trading opportunities by conveniently visualizing where current volume and price activity stands in relation to the average. It also offers features to observe the convergent/divergent relationships between asset’s price movement and volume, observe a single symbol’s activity compared to the wider market activity and much more.
Here is an overview of a few important settings.
Z-SCORE TYPE
◽️ Z-Score Type: Current Z-Score
Calculates the z-score by comparing current bar’s price and volume data to the mean (moving average with any custom length, default is 20 bars). This indicates how much the current bar’s price and volume data deviates from the average over the specified period. A positive z-score suggests that the current bar's price or volume is above the mean of the last 20 bars (or the custom length set by the user), while a negative z-score means it's below that mean.
Example: Consider an asset whose current price and volume both show deviations from their 20-bar averages. If the price's Z-Score is +1.5 and the volume's Z-Score is +2.0, it means the asset's price is 1.5 standard deviations above its average, and its trading volume is 2 standard deviations above its average. This might suggest a significant upward move with strong trading activity.
◽️ Z-Score Type: Average Z-Score
Calculates the custom-length average of symbol's z-score. Think of it as a smoothed version of the Current Z-Score. Instead of just looking at the z-score calculated on the latest bar, it considers the average behavior over the last few bars. By doing this, it helps reduce sudden jumps and gives a clearer, steadier view of the market.
Example: Instead of a single bar, imagine the average price and volume of an asset over the last 5 bars. If the price's 5-bar average Z-Score is +1.0 and the volume's is +1.5, it tells us that, over these recent bars, both the price and volume have been consistently above their longer-term averages, indicating sustained increase.
◽️ Z-Score Type: Relative Z-Score
Calculates a relative z-score by comparing symbol’s current bar z-score to the mean (average z-score of all symbols in the group). This is essentially a z-score of a z-score, and it helps in understanding how a particular symbol's activity stands out not just in its own historical context, but also in relation to the broader set of symbols being analyzed. In other words, while the primary z-score tells you how unusual a bar's activity is for that specific symbol, the relative z-score informs you how that "unusualness" ranks when compared to the entire group's deviations. This can be particularly useful in identifying symbols that are outliers even among outliers, indicating exceptionally unique behaviors or opportunities.
Example: If one asset's price Z-Score is +2.5 and volume Z-Score is +3.0, but the group's average Z-Scores are +0.5 for price and +1.0 for volume, this asset’s Relative Z-Score would be high and therefore stand out. This means that asset's price and volume activities are notably high, not just by its own standards, but also when compared to other symbols in the group.
DISPLAY TYPE
◽️ Display Type: Scatter Plot
The Scatter Plot is a visual tool designed to represent values for two variables, in this case the Z-Scores of price and volume for multiple symbols. Each symbol has it's own dot with x and y coordinates:
X-Axis: Represents the Z-Score of price. A symbol further to the right indicates a higher positive deviation in its price from its average, while a symbol to the left indicates a negative deviation.
Y-Axis: Represents the Z-Score of volume. A symbol positioned higher up on the plot suggests a higher positive deviation in its trading volume from its average, while one lower down indicates a negative deviation.
Here are some guideline insights of plot positioning:
- Top-Right Quadrant (High Volume-High Price): Symbols in this quadrant indicate a scenario where both the trading volume and price are higher than their respective mean.
- Top-Left Quadrant (High Volume-Low Price): Symbols here reflect high trading volumes but prices lower than the mean.
- Bottom-Left Quadrant (Low Volume-Low Price): Assets in this quadrant have both low trading volume and price compared to their mean.
- Bottom-Right Quadrant (Low Volume-High Price): Symbols positioned here have prices that are higher than their mean, but the trading volume is low compared to the mean.
The plot also integrates a set of concentric squares which serve as visual guides:
- 1st Square (1SD): Encapsulates symbols that have Z-Scores within ±1 standard deviation for both price and volume. Symbols within this square are typically considered to be displaying normal behavior or within expected range.
- 2nd Square (2SD): Encapsulates those with Z-Scores within ±2 standard deviations. Symbols within this boundary, but outside the 1 SD square, indicate a moderate deviation from the norm.
- 3rd Square (3SD): Represents symbols with Z-Scores within ±3 standard deviations. Any symbol outside this square is deemed to be a significant outlier, exhibiting extreme behavior in terms of either its price, its volume, or both.
By assessing the position of symbols relative to these squares, traders can swiftly identify which assets are behaving typically and which are showing unusual activity. This visualization simplifies the process of spotting potential outliers or unique trading opportunities within the market. The farther a symbol is from the center, the more it deviates from its typical behavior.
◽️ Display Type: Columns
In this visualization, z-scores are represented using columns, where each symbol is presented horizontally. Each symbol has two distinct nodes:
- Left Node: Represents the z-score of volume.
- Right Node: Represents the z-score of price.
The height of these nodes can vary along the y-axis between -4 and 4, based on the z-score value:
- Large Positive Columns: Signify a high or positive z-score, indicating that the price or volume is significantly above its average.
- Large Negative Columns: Represent a low or negative z-score, suggesting that the price or volume is considerably below its average.
- Short Columns Near 0: Indicate that the price or volume is close to its mean, showcasing minimal deviation.
This columnar representation provides a clear, intuitive view of how each symbol's price and volume deviate from their respective averages.
◽️ Display Type: Circles
In this visualization style, z-scores are depicted using circles. Each symbol is horizontally aligned and represented by:
- Solid Circle: Represents the z-score of price.
- Transparent Circle: Represents the z-score of volume.
The vertical position of these circles on the y-axis ranges between -4 and 4, reflecting the z-score value:
- Circles Near the Top: Indicate a high or positive z-score, suggesting the price or volume is well above its average.
- Circles Near the Bottom: Represent a low or negative z-score, pointing to the price or volume being notably below its average.
- Circles Around the Midline (0): Highlight that the price or volume is close to its mean, with minimal deviation.
◽️ Display Type: Delta Columns
There's also an option to utilize Z-Score Delta Columns. For each symbol, a single column is presented, depicting the difference between the z-score of price and the z-score of volume.
The z-score delta essentially captures the disparity between how much the price and volume deviate from their respective mean:
- Positive Delta: Indicates that the z-score of price is greater than the z-score of volume. This suggests that the price has deviated more from its average than the volume has from its own average. Such a scenario could point to price movements being more significant or pronounced compared to the changes in volume.
- Negative Delta: Represents that the z-score of volume is higher than the z-score of price. This might mean that there are substantial volume changes, yet the price hasn't moved as dramatically. This can be indicative of potential build-up in trading interest without an equivalent impact on price.
- Delta Close to 0: Means that the z-scores for price and volume are almost equal, indicating their deviations from the average are in sync.
◽️ Display Type: Z-Volume/Z-Price Heatmap
This visualization offers a heatmap either for volume z-scores or price z-scores across all symbols. Here's how it's presented:
Each symbol is allocated its own horizontal row. Within this row, bar-by-bar data is displayed using a color gradient to represent the z-score values. The heatmap employs a user-defined gradient scale, where a chosen "cold" color represents low z-scores and a chosen "hot" color signifies high z-scores. As the z-score increases or decreases, the colors transition smoothly along this gradient, providing an intuitive visual indication of the z-score's magnitude.
- Cold Colors: Indicate values significantly below the mean (negative z-score)
- Mild Colors: Represent values close to the mean, suggesting minimal deviation.
- Hot Colors: Indicate values significantly above the mean (positive z-score)
This heatmap format provides a rapid, visually impactful means to discern how each symbol's price or volume is behaving relative to its average. The color-coded rows allow you to quickly spot outliers.
VOLUME TYPE
The "Volume Type" input allows you to choose the nature of volume data that will be factored into the volume z-score calculation. The interpretation of indicator’s data changes based on this input. You can opt between:
- Volume (Regular Volume): This is the classic measure of trading volume, which represents the volume traded in a given time period - bar.
- OBV (On-Balance Volume): OBV is a momentum indicator that accumulates volume on up bars and subtracts it on down bars, making it a cumulative indicator that sort of measures buying and selling pressure.
Interpretation Implications:
- For Volume Type: Regular Volume:
Positive Z-Score: Indicates that the trading volume is above its average, meaning there's unusually high trading activity .
Negative Z-Score: Suggests that the trading volume is below its average, signifying unusually low trading activity.
- For Volume Type: OBV:
Positive Z-Score: Signifies that “buying pressure” is above its average.
Negative Z-Score: Signifies that “selling pressure” is above its average.
When comparing Z-Score of OBV to Z-Score of price, we can observe several scenarios. If Z-Price and Z-Volume are convergent (have similar z-scores), we can say that the directional price movement is supported by volume. If Z-Price and Z-Volume are divergent (have very different z-scores or one of them being zero), it suggests a potential misalignment between price movement and volume support, which might hint at possible reversals or weakness.

Crypto Daily WatchList And Screener [M]
Hi, this is a watchlist and screener indicator designed for traders in the field of cryptocurrencies who want to monitor developments in other currency pairs and indices.
The indicator consists of two tables. One of them is the table containing indices such as BTC dominance, total, total2, which allows you to track market developments and changes. In this table, you will find price information, daily change, stochastic, and trend information.
The other table includes cryptocurrencies like BTC/USDT, ETH/USDT, DOT/USDT, and more. In this table, you will see real-time prices, daily volume, daily change, stochastic, the correlation coefficient between the pair and Bitcoin, and the trend value calculated based on MACD.
The "Customize" section in the settings enables you to personalize the appearance of the tables according to your preferences.

[Pivots Consolidation Breakout Screener] with Alerts (TSO) This is a pivots consolidation screener indicator, with ability to choose up to 12 different symbols/instruments with alert to be notified when consolidation happens on either one with the new pivots formation (new R3(inner resistance) pivot formed below previous one and new S3(inner support) pivot formed above previous one). Once the alert on a certain symbol/instrument is received - there is an ability to set a Breakout alert for the consolidated symbol/instrument.
This is a very powerful strategy, which doesn't happen often, but when happens - it often causes big moves after a breakout!
NOTE: Every calculation is done on a confirmed closed candle bar state, so the indicator will never repaint!
===========================================================================
Explanation of all the Features/Inputs/Settings
---------------------------------------------------------------------------
>>> On the very top, please read the important NOTES/TIPs.
>>> Next section is where the desired symbols can be turned on/checked to be screened for consolidation - the selected/checked symbols at creation of a 'Any alert() function call' alert will alert on any of the selected/checked symbols. Also, once consolidation forms, until next pivots formation - it will show it on the "Consolidation Stats" table. Once alerted on a specific symbol for consolidation - manual alert - 'Consolidation BREAKOUT' - can be created (MUST be done on the actual symbol chart, Right-Click > Add Alert) to be notified when actual breakout takes place.
>>> Pivots Settings section is where a manual timeframe/length can be set for the pivots as by Default it uses "Daily" timeframe. So, if want to experiment with more signals, but less accurate - a smaller timeframe can be set for Pivots Timeframe with smaller chart timeframe.
>>> Final section is simply the "Consolidation Stats" table location.
===========================================================================
Adding Alerts in TradngView
---------------------------------------------------------------------------
1) Consolidation alert(s) for the selected/checked symbols
- Select/check/find the desired symbols/instruments (when selecting symbols, make sure - they are from correct BROKER/SOURCE as pricing may differ between different brokers, causing confusion (under 1 broker/source, the symbol will be consolidated, under another it will not...))
-Right-click anywhere on any TradingView chart
-Click on Add alert
-Condition: Select this indicator by it’s name
-Immediately below, change it to "alert() function calls only"
-Expiration: Open-ended (that may require higher tier TradingView account, otherwise the alert will need to be occasionally re-triggered)
-Alert name: Whatever you desire
-Hit “Create”
-Note: If you change ANY Settings within the indicator – you must DELETE the current alert and create a new one per steps above, otherwise it will continue triggering alerts per old Settings!
* Once alert triggers, don't get confused, as it will show "Alert on SYMBOL", the SYMBOL will be where you created the major alert for all the symbols within the screener list! Within the alert, on the bottom, it will say: "EURUSD: Camarilla Pivots R3S3 Consolidation ALERT!" - this is where the correct symbol is for which the alert for consolidation was triggered!
---------------------------------------------------------------------------
2) Consolidation BREAKOUT alert(s)
-Right-click anywhere on any TradingView chart
-For the actual symbol (which got consolidated), open the chart (make sure timeframe is the same as with which "Consolidation alert(s)" were created prior), then Right-Click on the chart > Add Alert
-Click on Add alert
-Condition: Select this indicator by it’s name
-Immediately below, change it to "Consolidation BREAKOUT1"
-Expiration: Open-ended (that may require higher tier TradingView account, otherwise the alert will need to be occasionally re-triggered)
-Alert name: Whatever you desire
-Hit “Create”
* It will alert when a breakout occurs in any direction - once you open the chart for the symbol/instrument for which alert has occurred - you can immediately see into which direction the breakout occured, it will be marked on the chart with green/red triangle.
===========================================================================
If you have any questions or issues with the indicator, please message me directly via TradingView.
---------------------------------------------------------------------------
Good Luck! (NOTE: Trading is very risky, past performance is not necessarily indicative of future results, so please trade responsibly!)

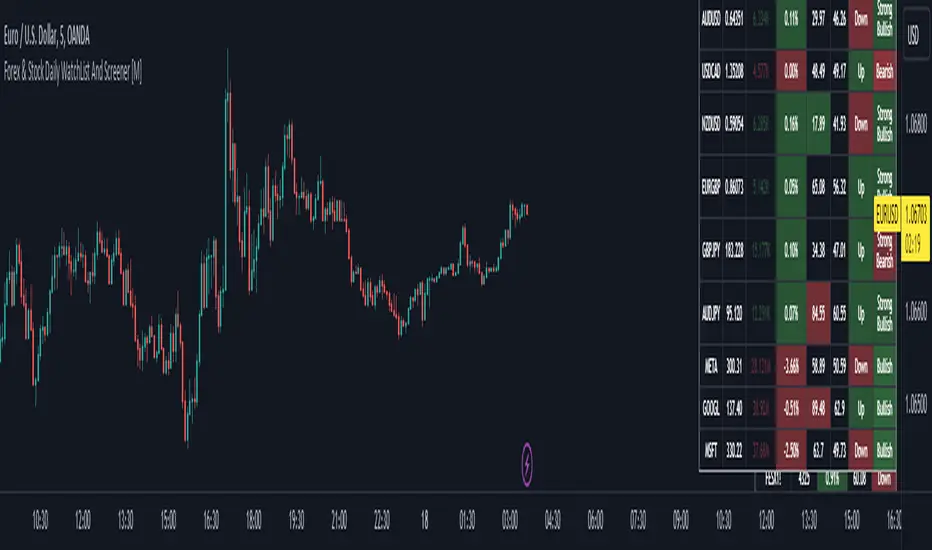
Forex & Stock Daily WatchList And Screener [M]Hi, this is a watchlist and screener indicator for Forex and Stocks.
This indicator is designed for traders who trade in the forex markets and monitor developments in indices and other currency pairs.
It includes information on 14 indices such as the volatility index, Baltic dry index, etc. You can customize the indices as you wish. The indices table contains the index's price (or points), daily change, stochastic value, and trend direction.
The second table is designed for trading forex and stock currency pairs.
In this table, you will find information such as price, volume, change, stochastic, RSI, trend direction, and MACD result for all traded pairs. You can customize all the currency pairs in this table as you wish, and you can also tailor the oscillator settings to your preferences.
In the settings section, you can use checkboxes to hide the pairs in both tables.
The "Customize" section in the settings allows you to personalize the table appearances according to your preferences.
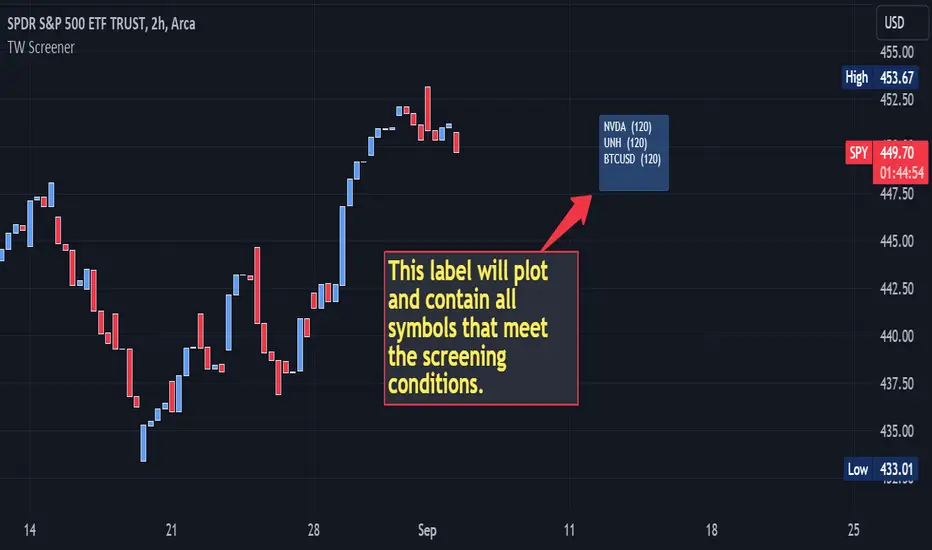
Multi-Symbol Indicator Screener w/ Alert [TradingWhale]This screener allows to screen multiple (up to 40) symbols for a condition defined by the user, including some other indicator plot values (not all of them) and their relation to other indicator plot values (data sources) or to absolute values defined in the condition.
It plots a label and adds the symbols and chart time frames to the label for those symbols that meet the screening condition. There are some examples further below.
The indicator / screener is designed to use other indicators as a data source, where possible.
On the label the symbols represent stock symbols. The numbers represent the chart time frame in which the condition was screened. (30) = 30 minutes, (120) = 120 minutes, (D) = 1 day, (3D) = 3 days, (W) = 1 week, and so forth.
Requirements:
- the indicators you want to use as source data need to be on the same chart as the screener, but not in the same pane.
- It will not work for all 3rd-party indicators.
The script provides the specific capabilities detailed below:
1. Data inputs:
- add up to 40 symbols to be screened
- check field for each symbol allow the user to enable/disable screening for each symbol individually
- ability to add up to two (2) external source data that can be compared to each other, where possible, by a logical operator or compared to an absolute value
- a check field to select whether the logical operation takes places between Source #1 and Source #2 or between Source # 1 and an absolute value.
- users can also define how far from the last bar the label is plotted on the chart
2. Operations available, whenever possible based on source data:
- "crossing"
- "cross up"
- "cross down"
- "rejected from resistance (Source #1) in the last bar", which means "High was above Source #1 (resistance level) in the last completed bar and 'close' (current price of the symbol) is now below Source #1" (resistance level).
- "rejected from resistance (Source #1) in the last 2 bars", which means "High was above Source #1 (resistance level) in one of the last two (2) completed bars and 'close' (current price of the symbol) is now below Source #1" (resistance level).
- "rejected from support (Source #1) in the last bar" --- similar to above except with Lows and rejection from support level
- "rejected from support (Source #1) in the last 2 bars" --- similar to above except with Lows and rejection from support level
- "greater than"
- "less than"
- "is up"
- "is down"
- "is up %"
- "is down %"
Screening examples could be:
- Source #1 "crossed up" Source #2
- Source #1 is "greater than" 20
3. Output:
a. Label
The label can be modified in terms of colors and position (how many bars away from the last bar)
b. Alerts
- Get alerted if one or more symbols meet the condition.
- To set up the alert visit the alerts setup screen in TV and select this screener.
How To Input CSV List Of Symbol Data Used For ScreenerExample of how to input multiple symbols at once using a CSV list of ticker IDs. The input list is extracted into individual ticker IDs which are then each used within an example screener function that calculates their rate of change. The results for each of the rate of changes are then plotted.
For code brevity this example only demonstrates using up to 4 symbols, but the logic is annotated to show how it can easily be expanded for use with up to 40 ticker IDs.
The CSV list used for input may contain spaces or no spaces after each comma separator, but whichever format (space or no space) is used must be used consistently throughout the list. If the list contains any invalid symbols the script will display a red exclamation mark that when clicked will display those invalid symbols.
If more than 4 ticker IDs are input then only the first 4 are used. If less than 4 ticker IDs are used then the unused screener calls will return `float(na)`. In the published chart the input list is using only 3 ticker IDs so there are only 3 plots shown instead of 4.
NOTICE: This is an example script and not meant to be used as an actual strategy. By using this script or any portion thereof, you acknowledge that you have read and understood that this is for research purposes only and I am not responsible for any financial losses you may incur by using this script!

Multi-Asset Performance [Spaghetti] - By LeviathanThis indicator visualizes the cumulative percentage changes or returns of 30 symbols over a given period and offers a unique set of tools and data analytics for deeper insight into the performance of different assets.
Multi Asset Performance indicator (also called “Spaghetti”) makes it easy to monitor the changes in Price, Open Interest, and On Balance Volume across multiple assets simultaneously, distinguish assets that are overperforming or underperforming, observe the relative strength of different assets or currencies, use it as a tool for identifying mean reversion opportunities and even for constructing pairs trading strategies, detect "risk-on" or "risk-off" periods, evaluate statistical relationships between assets through metrics like correlation and beta, construct hedging strategies, trade rotations and much more.
Start by selecting a time period (e.g., 1 DAY) to set the interval for when data is reset. This will provide insight into how price, open interest, and on-balance volume change over your chosen period. In the settings, asset selection is fully customizable, allowing you to create three groups of up to 30 tickers each. These tickers can be displayed in a variety of styles and colors. Additional script settings offer a range of options, including smoothing values with a Simple Moving Average (SMA), highlighting the top or bottom performers, plotting the group mean, applying heatmap/gradient coloring, generating a table with calculations like beta, correlation, and RSI, creating a profile to show asset distribution around the mean, and much more.
One of the most important script tools is the screener table, which can display:
🔸 Percentage Change (Represents the return or the percentage increase or decrease in Price/OI/OBV over the current selected period)
🔸 Beta (Represents the sensitivity or responsiveness of asset's returns to the returns of a benchmark/mean. A beta of 1 means the asset moves in tandem with the market. A beta greater than 1 indicates the asset is more volatile than the market, while a beta less than 1 indicates the asset is less volatile. For example, a beta of 1.5 means the asset typically moves 150% as much as the benchmark. If the benchmark goes up 1%, the asset is expected to go up 1.5%, and vice versa.)
🔸 Correlation (Describes the strength and direction of a linear relationship between the asset and the mean. Correlation coefficients range from -1 to +1. A correlation of +1 means that two variables are perfectly positively correlated; as one goes up, the other will go up in exact proportion. A correlation of -1 means they are perfectly negatively correlated; as one goes up, the other will go down in exact proportion. A correlation of 0 means that there is no linear relationship between the variables. For example, a correlation of 0.5 between Asset A and Asset B would suggest that when Asset A moves, Asset B tends to move in the same direction, but not perfectly in tandem.)
🔸 RSI (Measures the speed and change of price movements and is used to identify overbought or oversold conditions of each asset. The RSI ranges from 0 to 100 and is typically used with a time period of 14. Generally, an RSI above 70 indicates that an asset may be overbought, while RSI below 30 signals that an asset may be oversold.)
⚙️ Settings Overview:
◽️ Period
Periodic inputs (e.g. daily, monthly, etc.) determine when the values are reset to zero and begin accumulating again until the period is over. This visualizes the net change in the data over each period. The input "Visible Range" is auto-adjustable as it starts the accumulation at the leftmost bar on your chart, displaying the net change in your chart's visible range. There's also the "Timestamp" option, which allows you to select a specific point in time from where the values are accumulated. The timestamp anchor can be dragged to a desired bar via Tradingview's interactive option. Timestamp is particularly useful when looking for outperformers/underperformers after a market-wide move. The input positioned next to the period selection determines the timeframe on which the data is based. It's best to leave it at default (Chart Timeframe) unless you want to check the higher timeframe structure of the data.
◽️ Data
The first input in this section determines the data that will be displayed. You can choose between Price, OI, and OBV. The second input lets you select which one out of the three asset groups should be displayed. The symbols in the asset group can be modified in the bottom section of the indicator settings.
◽️ Appearance
You can choose to plot the data in the form of lines, circles, areas, and columns. The colors can be selected by choosing one of the six pre-prepared color palettes.
◽️ Labeling
This input allows you to show/hide the labels and select their appearance and size. You can choose between Label (colored pointed label), Label and Line (colored pointed label with a line that connects it to the plot), or Text Label (colored text).
◽️ Smoothing
If selected, this option will smooth the values using a Simple Moving Average (SMA) with a custom length. This is used to reduce noise and improve the visibility of plotted data.
◽️ Highlight
If selected, this option will highlight the top and bottom N (custom number) plots, while shading the others. This makes the symbols with extreme values stand out from the rest.
◽️ Group Mean
This input allows you to select the data that will be considered as the group mean. You can choose between Group Average (the average value of all assets in the group) or First Ticker (the value of the ticker that is positioned first on the group's list). The mean is then used in calculations such as correlation (as the second variable) and beta (as a benchmark). You can also choose to plot the mean by clicking on the checkbox.
◽️ Profile
If selected, the script will generate a vertical volume profile-like display with 10 zones/nodes, visualizing the distribution of assets below and above the mean. This makes it easy to see how many or what percentage of assets are outperforming or underperforming the mean.
◽️ Gradient
If selected, this option will color the plots with a gradient based on the proximity of the value to the upper extreme, zero, and lower extreme.
◽️ Table
This section includes several settings for the table's appearance and the data displayed in it. The "Reference Length" input determines the number of bars back that are used for calculating correlation and beta, while "RSI Length" determines the length used for calculating the Relative Strength Index. You can choose the data that should be displayed in the table by using the checkboxes.
◽️ Asset Groups
This section allows you to modify the symbols that have been selected to be a part of the 3 asset groups. If you want to change a symbol, you can simply click on the field and type the ticker of another one. You can also show/hide a specific asset by using the checkbox next to the field.

EMA Screener with Day BreakoutsThe present script is aimed at screening number of stocks as per user input with respect to Daily Exponential Moving Average. Default is set at 200 DEMA, it can be changed by the user from settings menu as per user's preference.
The EMA cell illuminates to Green if Day's Open < EMA
The EMA cell illuminates to Purple if Day's Open > EMA
EMU cell shows the price as, EMA * EMA Price Multiplier (i.e. range below EMA, customizable from settings by user)
EMU cell illuminates to light Green when Price > EMU (i.e. the price is in range of EMA, For example suppose EMA value is 1000 and EMA Price Multiplier is 0.95 then the EMU cell value will be 950 as soon as the price crosses above 950 the EMU cell will get illuminated)
EMD cell shows the price as, EMA * EMA Price Multiplier (i.e. range above EMA, customizable from settings by user)
EMD cell illuminates to red when Price < EMD (i.e. the price is in range of EMA, For example suppose EMA value is 1000 and EMA Price Multiplier is 1.05 then the EMD cell value will be 1050 as soon as the price crosses below 1050 the EMD cell will get illuminated)
The DBO (Day Break Out) cell illuminates to Blue when the current price is near Day's high.
--Dr. Vats
Disclaimer: Only for studying price movement ideas, trading is not advised.

Symbol Searcher [EmuMoon]Introducing the EmuMoon 'Symbol Searcher'. Your go-to tool for quickly comparing and discovering the best coins/symbols to trade.
With this nifty tool, you can easily search and compare 40+ different coins/symbols simultaneously to find the most volatile ones, while also identifying coins that are already correlated to the ones you're trading. That way, you can diversify your portfolio and avoid putting all your eggs in one basket.🧺🐣
The Symbol Searcher lets you sort by volatility, correlation and weighted combinations of both. You can even input your own coins/symbols to see how they stack up. It's a fun way to explore the crypto/trading market and find new opportunities.
You can also add the 'Symbol Searcher' to the chart multiple times to display even more symbols. This works excellent with the other DCA Tools that are Advanced!
Features
The EmuMoon 'Symbol Searcher' has a number of features, including:
• Optimal Coin Selection - The 'Top Picks' Table automatically populates with coins/symbols exhibiting the most desirable values that are well suited to trading.
• 'Sort By' Drop-Down - Explore a wide range of sorting options to discover coins/symbols that align with your target goals and preferences.
• Lookback Duration - Small or broad, you can specify the quantity of bars/candles that are used when performing internal calculations.
• Customisable View - Choose the Quantity of Pairs to Compare and also separately choose the Quantity of Pairs to Display.
• Real-Time Data - Receive up-to-the-minute data on coins/symbols, pick any time frame interval to make informed and timely choices.
• Quick & Easy - You can search, compare and analyse a wide range of coins with speed and convenience and no complex setup.
• Default Pairs - Carefully selected from Binance USDT Spot, the top 40 pairs with a 'Maximum Supply' based on the highest statistics at the time of creating. Add your own at any time.
• Connectivity - Use on the go, on any device. Settings menu and display tables have been optimized to look great on Mobile as well as PC, Browser, App, Laptop, Mobile, Tablet etc.
• Fast Loading - Streamlined array/table structure means enhanced script compile times, significantly improving script compiling times and timeout errors.
Settings
• Show Main Table - Show or hide the main coin selection table.
• Display X Pairs - Choose how many pairs to display.
• Compare X Pairs - Choose how many pairs to compare.
• Lookback - Choose the quantity of bars/candles to be used for the Correlation and Volatility calculations.
• Sort By - Choose how the main table is sorted.
• Show Top Picks Table - Show or hide the Top Picks Table.
• + Corr X Vol - Choose the quantity of High Correlation + High Volatility coins to show on the Top Picks Table.
• - Corr X Vol - Choose the quantity of Low Correlation + High Volatility coins to show on the Top Picks Table.
• o Corr X Vol - Choose the quantity of Neutral Correlation + High Volatility coins to show on the Top Picks Table.
• Symbol Input 1 - To check for correlation, the script utilizes coin slot number 1 as a reference, comparing it against all the coins numbered 2~40.
• Symbol Inputs 2~40 - Customize the coin inputs (2~40) according to your preference.
• Table Position - Adjust location of table plotted on chart. You can also add the 'Symbol Searcher' to the chart multiple times to display even more symbols. 🎉
• Info & Help - Some great information about the script and its features
• Text Size - Whether you are on PC, App, or Tablet, you can adjust the view to fit your device.
Usage
While statistics provide valuable insights, they should not be solely relied upon as an indicator of future results. This script serves as a tool traders can utilise to help gain an overview of the market landscape, and quickly compare and identify potential opportunities, enhancing their decision-making process. To use the indicator, simply input your chosen coins/symbols or use the defaults, select the quantity you want to compare, choose a sorting option, you can also generate a Top Picks list based on the highest performing values by using the +/-/o Corr X Vol quantity selections.

Strategy - Relative Volume GainersStrategy - Relative Volume Gainers
Overview:
This trading strategy, called "Relative Volume Gainers," is designed for Long Entry opportunities in the stock market. The strategy aims to identify potential trading candidates based on specific technical conditions, including volume, price movements, and indicator alignments.
Strategy Rules:
The strategy is focused solely on Long Entry positions.
The volume for the current trading day must be greater than or equal to the volume of the previous day.
The percentage change in price must be greater than or equal to 2.5%.
The Last Traded Price (LTP) must be greater than or equal to the Exponential Moving Average (EMA) 200.
The Relative Volume for the current trading day (calculated over the last 30 days) must be greater than or equal to the Simple Moving Average (SMA) of Relative Volume over the same 30 days.
The current candle on the chart should be Green or Bullish, indicating positive price movement.
The price difference between bid and ask prices should be kept to a minimum.
It's recommended to also analyze market depth for better insights.
Strategy Requirements:
Add the Exponential Moving Average (EMA) 200 to your trading chart.
This strategy can be applied on charts of any timeframe.
For intraday trading, particularly for early entry, consider using a 1-minute timeframe.
It is advisable to create a screener to identify potential trades in real-time market conditions.
Risk Warning:
Stocks that meet the strategy criteria might exhibit high volatility and a high beta, making them inherently risky to trade. Exercise caution and adhere to predetermined risk management strategies.
Determine your trading quantity based on your entry price and stop loss in order to manage risk effectively.
Quantity Calculation Formula:
Quantity calculation is crucial to manage risk and position sizing. The following formulas can be used based on your trading scenario:
Quantity with Leverage:
Quantity = (((Using Capital / 100) * Risk Percent) / (Entry Price - Stop Loss)) * Leverage
Eg: Quantity = (((10000 / 100) * 0.2) / (405.5 - 398.5)) * 5
Quantity = 14
Risk = Rs.100 (Rs.100 is 1% of Rs.10000. So the risk is 1%, means we lose only Rs.100 when the SL is hit. If SL is increased the Quantity will get reduced to maintain a fixed risk of Rs.100)
Quantity without Leverage:
Quantity = (((Using Capital / 100) * Risk Percent) / (Entry Price - Stop Loss))
Note:
Always stay informed about market conditions and be prepared for potential rapid price movements when trading stocks that meet the strategy criteria. Strictly adhere to your predefined risk management strategy to safeguard your capital.

All Candlestick Patterns Screener [By MUQWISHI]▋ INTRODUCTION :
The Candlestick Patterns Screener has been designed to offer an advanced monitoring solution for up to 40 symbols. Utilizing a log screener style, it efficiently gathers information on confirmed candlestick pattern occurrences and presents it in an organized table. This table includes essential details such as the symbol name, signal price, and the corresponding candlestick pattern name.
_______________________
▋ OVERVIEW:
_______________________
▋ CREDIT:
Credit to public technical “*All Candlestick Patterns*” indicator.
_______________________
▋ USAGE:
_______________________
▋ Final Comments:
For best performance, add the Candlestick Patterns Screener on active symbol chart like QQQ, SPY, AAPL, BTCUSDT, ES, EURUSD or …etc.
Candlestick patterns are not a major concept to build a trading decision.
Personally, I see candlestick patterns as a means to comprehend the psychology of the market, and help to follow the price action.
Please let me know if you have any questions.
Thank you.

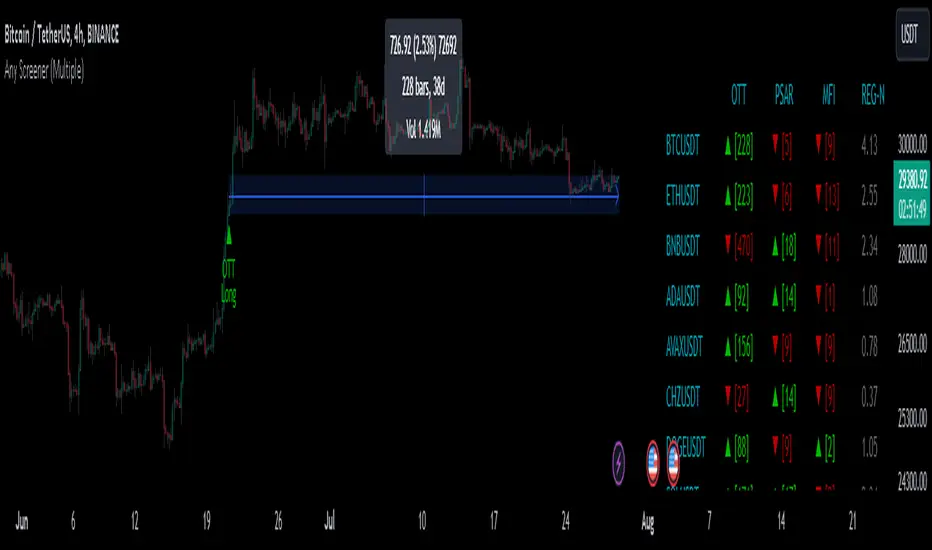
Any Screener (Multiple)I suppose it's time to publish something relatively useful :). Here's the first try, Any Screener.
This script is an advanced version of the Alphatrend - Screener that I've coded as a humble "thank you" to Kıvanç Özbilgiç (KivancOzbilgic), who always inspired me.
INTRODUCTION
I developed this version with a unique method because I couldn't find an example with the following features:
It presents the valid signal status of multiple indicators for 15 different symbols in the form of a report.
It indicates how many bars have passed after the signal has occurred.
It indicates the signal direction with dynamic colors and chars.
It can also be used for data (just indicator value) that is only intended to be displayed as text. (Default color is grey).
Long and short signals can optionally be ploted on the chart.
It includes advanced configuration settings.
USAGE OF PANEL
The screener panel is simple to use. On the far left, assets are listed. The names of the indicators appear at the top. In the column with the name of each indicator, the signals of that indicator appear as green or red. The green ones represent the long signals (uptrend) and the red ones represent the short signals (down trend). The numbers in square brackets indicate how many bars have passed after the last signal has occurred. (For example: According to the indicator at the top, when the green bullish triangle and 21 appeared on allign of BTCUSDT, Bitcoin switched to buy signal 21 bars ago. A tip : If the signal distance is 0, the signal occurred at the current bar. It is recommended to wait for the bar to close before entering the trade). Signal distance is an essential output for both manual and algorithmic trading. Users often require mentioned data the most during real time trading.
THE SCRIPT
There are two sections in the script; indicators and screener.
SECTION 1 : "INDICATORS"
In the indicator section, you'll find efficient details about switch methods, normalization, avoid pyramyding (in momentum oscillators) etc. On the other hand, I intended to present a "how to example" of a multiple screener, so it has to include more than one indicator.
OTT : Optimized Trend Tracker is developed by dear Anıl Özekşi, known as the "Old Fisherman" :). In my opinion, it is a pretty cool trend-following indicator that offers a mathematical elegance. This indicator aim to detect the current market trend direction, the indicator detect an up-trending market when the support line is superior to the OTT, and a down trending market when the support line is inferior to the OTT. It has three parameters; moving average type, length and percentage. In this version when the percentage parameter is set to 0.0, OTT turns into the selected moving average. And the signals are generated by the crossing of the closing price. It means, this screener is able to compile and present status of moving averages as well. Also VAR (VIDYA) and EVWMA has been re-designed, both moving averages no longer start at zero at the beginning of the chart (That was a big problem for backtests).
PSAR : J. Welles Wilder's Parabolic Stop And Reversal is an important trend following indicator. PSAR detects an up-trending market when below the market price and a down-trend when above. It can work in harmony with OTT according to the parameter combinations.
OSCILLATORS : Also optional three momentum oscillators have been added. MFI (Money Flow Index), RSI (Relative Strength Index) and STOCH (Stochastic %k). All three oscillators are widely used in markets and quite successful in explaining price movements by using different sources. Oscillators generate long and short signals based on oversold and overbought parameters.
VOLATILITY & TREND : There are three optional indicators. ADX (Average Directional Index), BBW-N (Normalized Bollinger Bandwidth) and REG-N (Normalized value of standard error of linear regression). These three indicators don't generate any long or short signals. Instead, they are used to measure the strength of trends and volatility. Therefore, only the numerical results (0-100) are displayed in screener panel and it is grey. (Note : The second length parameter of ADX has the same value with the first one. Bollinger Bandwith's multiplier is 2.0. REG-N is a variable that developed by Paul Kirshenbaum for Kirshenbaum Bands.)
SECTION 2 : "SCREENER"
The second section processes the main idea. This Screener model is based on generating an integer direction variable from boolean signals. The direction value serves multiple purposes: calculating the distance of signal, determining the color based on the direction, and creating "clean" data for the security function. The final step is to present the obtained data as text to the user.
HOW CAN I "SCREEN" MY CONDITIONS?
That's piece a cake, delete the Section 1 in the script :). If you change totally 11 variables according to your own strategy, you can create your new screener! The method is explained at lines 169-171.
SINCERELY THANKS
To allanster for patiently answering my primitive questions,
And to KivancOzbilgic for mind blowing suggestions (especially while we're drinking Raki) :)...
DISCLEIMER
This is just an indicator, nothing more. The script is for informational and educational purposes only. The use of the script does not constitute professional and/or financial advice. The responsibility for risks associated with the use of the script is solely owned by the user. Do not forget to manage your risk. And trade as safely as possible. Good luck!
Auto Harmonic Pattern - Screener [Trendoscope]At Trendoscope, we take pride in offering a wide range of indicators on Harmonic Patterns, including both free and premium options. While we have successfully developed various advanced tools, we recognize that creating a Harmonic Pattern screener is an audacious endeavor that few have ventured into.
Creating a harmonic pattern screener presents a formidable challenge. The intricate nature of the algorithm, coupled with the limitations of cloud-based processing and platform memory, makes it exceedingly difficult to implement the screener functionality without encountering runtime errors.
Today marks a historic achievement as we overcome numerous challenges to unveil our groundbreaking harmonic pattern-based screener. This significant leap signifies our commitment to innovation in the field.
Without further delay, let's dive right into the new Auto Harmonic Pattern - Screener algorithm
🎲 Features Overview
🎯 Primary Functionality
We prefer not to categorize this as a traditional indicator, as it goes beyond that scope. Instead, it's a unique amalgamation of both a screener and an indicator, designed to achieve primarily two essential functions.
Firstly, it efficiently scans multiple tickers, up to 20, for harmonic pattern formations and presents them on a user-friendly dashboard
Secondly, it provides harmonic pattern drawings on the chart, but only if the current chart ticker is part of the screener and exhibits a harmonic pattern formation.
🎯 Secondary Features
In addition to its primary functionalities, our revolutionary algorithm offers an array of secondary features that cater to traders' diverse needs
Users have the privilege of accessing enhanced settings, providing limitless customization options for the zigzag and pattern detection algorithm
The platform empowers traders to effortlessly customize stop entry target ratios, facilitating automatic calculations and display of suggestions
The freedom to personalize the visualization and display of patterns and dashboard ensures a seamless and intuitive user experience
And finally, the algorithm leaves no stone unturned, keeping traders well-informed through timely alerts on every bar, highlighting tickers exhibiting Harmonic Pattern formations.
🎯 Limitations
Our innovative screener harnesses the power of the recursive zigzag algorithm to deliver efficient and accurate harmonic pattern detections. While the deep search algorithm, present in our other Harmonic Pattern algorithms, offers unparalleled precision, its resource-intensive nature makes it unsuitable for simultaneous scanning of 20 tickers. By focusing on the recursive zigzag approach, we strike the perfect balance between performance and functionality, ensuring seamless scanning across multiple tickers without compromising on accuracy. This strategic decision allows us to deliver a powerful and reliable screener that meets the diverse needs of traders and empowers them with real-time harmonic pattern insights.
🎲 Chart Components
Upon loading the indicator and configuring your tickers, our user-friendly interface offers two key components seamlessly integrated into the chart:
A color-coded screener dashboard : The dashboard presents a clear visualization of tickers with bullish and bearish harmonic patterns. This intuitive display allows you to quickly identify potential trading opportunities based on pattern formations.
Dynamic pattern display : As you interact with the chart, our algorithm dynamically highlights possible harmonic patterns based on the latest zigzag pivots. Please note that patterns may not always be visible on the chart, especially in cases where higher-level zigzags take time to form pivots. However, rest assured that our sophisticated algorithm ensures real-time updates, providing you with accurate and timely harmonic pattern insights.
🎯 Screener Dashboard
In our screener dashboard, you will find a wealth of information at your fingertips:
Bullish patterns : Tickers exhibiting bullish harmonic patterns are prominently highlighted with a refreshing green background
Bearish patterns : Similarly, tickers featuring bearish harmonic patterns stand out with a striking red background
Dual patterns : Tickers displaying both bullish and bearish patterns are cleverly highlighted in a captivating purple background, providing a comprehensive view of the harmonic pattern landscape.
Tickers without current patterns : Tickers lacking any current patterns are elegantly displayed with a silver background. These tickers do not trigger tooltips, streamlining your focus on actionable pattern-related data.
🎲 Settings in Detail
🎯 Tickers
Our platform currently allows users to select up to 20 tickers for the harmonic pattern screener. We understand the importance of flexibility and scalability, and while we are excited to accommodate more tickers in the future, our present focus is to ensure optimal performance within the CPU and memory limitations. Rest assured, we are continuously working on enhancing our capabilities to provide you with an even more comprehensive experience. Stay tuned for updates as we strive to meet your evolving needs.
🎯 Zigzag and Harmonic Pattern
In this section, we present a range of essential settings that play a pivotal role in the calculation of the zigzag and the scanning of patterns. These parameters share similarities with other premium indicators associated with Harmonic patterns. These settings serve as building blocks for our advanced algorithms' suite.
This include
Zigzag length and depth settings for calculation of the multi level recursive zigzag
Pattern scanning settings to filter patterns based on preferences of category, pattern name, accuracy of calculation, and other considerations.
User preference of pattern trading ratios that are used for calculating entry, stop and target prices.
🎯 Screener Dashboard and Alerts
In this section, we introduce the parameters that define the format and content of alerts and the screener dashboard, offering you maximum flexibility in customizing their display. These settings encompass the following key aspects:
Screener dashboard position, layout and size that influence the display of screener dashboard.
List of parameters that can be shown on dashboard tooltips as well as on alerts.
Format of alert and tooltip data
🎯 Pattern Display
These are the settings related to pattern display on the chart and to limit calculation to last n bars
Will soon make video tutorials on this soon.
Script a pagamento

GDCA ScreenerThis is upgrated system for Screener to DCA from "Grospector DCA V.3".
This has 5 zone Extreme high , high , normal , low , Extreme low. You can dynamic set min - max percent every zone.
Extreme zone is derivative short and long which It change Extreme zone to Normal zone all position will be closed.
Every Zone is splitted 10 channel. and this strategy calculate contribution.
and now can predict price in future.
Price Type: Allows the user to select the price type (open, high, low, close) for calculations.
ALL SET
Length MA for normal zone: The length of the moving average used in the normal zone.
Length for strong zone: The length of the moving average used in the strong zone, which is averaged from the normal zone moving average.
Multiple for Short: The multiplication factor applied to determine the threshold for the short zone.
Multiple for Strong Sell: The multiplication factor applied to determine the threshold for the strong sell zone.
Multiple for Sell Zone: The multiplication factor applied to determine the threshold for the sell zone.
Multiple for Buy Zone: The multiplication factor applied to determine the threshold for the buy zone.
Multiple for Strong Buy: The multiplication factor applied to determine the threshold for the strong buy zone.
Multiple for Long: The multiplication factor applied to determine the threshold for the long zone.
ZONE
Start Short Zone %: The start percentage of the short zone.
End Short Zone %: The end percentage of the short zone.
Start Sell Zone %: The start percentage of the sell zone.
End Sell Zone %: The end percentage of the sell zone.
Start Normal Zone %: The start percentage of the normal zone.
End Normal Zone %: The end percentage of the normal zone.
Start Buy Zone %: The start percentage of the buy zone.
End Buy Zone %: The end percentage of the buy zone.
Start Long Zone %: The start percentage of the long zone.
End Long Zone %: The end percentage of the long zone.
DISPLAY
Show Price: Controls the visibility of the price column in the display table.
Show Mode: Controls the visibility of the mode column in the display table.
Show GDCA: Controls the visibility of the GDCA column in the display table.
Show %: Controls the visibility of the percentage column in the display table.
Show Short: Controls the visibility of the short column in the display table.
Show Strong Sell: Controls the visibility of the strong sell column in the display table.
Show Sell: Controls the visibility of the sell column in the display table.
Show Buy: Controls the visibility of the buy column in the display table.
Show Strong Buy: Controls the visibility of the strong buy column in the display table.
Show Long: Controls the visibility of the long column in the display table.
Show Suggestion Trend: Controls the visibility of the suggestion trend column in the display table.
Show Manual Custom Code: Controls the visibility of the manual custom code column in the display table.
Show Dynamic Trend: Controls the visibility of the dynamic trend column in the display table.
Symbols: Boolean parameters that control the visibility of individual symbols in the display table.
Mode: Integer parameters that determine the mode for each symbol, specifying different settings or trends.
My mindset has been customed = AAPL , MSFT
To effectively make the DCA plan, I recommend adopting a comprehensive strategy that takes into consideration your mindset as the best indicator of the optimal approach. By leveraging your mindset, the task can be made more manageable and adaptable to any market
Dollar-cost averaging (DCA) is a suitable investment strategy for sound money and growth assets which It is Bitcoin, as it allows for consistent and disciplined investment over time, minimizing the impact of market volatility and potential risks associated with market timing

RSI Momentum Trend ScreenerIntroducing The RSI Momentum Trend Screener, to have the ability to scan 40 symbols at once
The screener is based on RSI Momentum Trend Indicator
It will show Positive Or Negative based on the symbol condition.
You can change the values on the screener, symbols, activate/disable symbols and change table position and color

MOST + Moving Average ScreenerScreener version of Anıl Özekşi's Moving Stop Loss (MOST) Indicator:
USERS MAY SCREEN MOST WITH 11 DIFFERENT TYPES OF MOVING AVERAGES + THEY CAN ALSO SCREEN SIGNALS WITH THAT 11 MOVING AVERAGES INSTEAD OF USING MOST LINE.
Adjustable Moving Average Types:
SMA : Simple Moving Average
EMA : Exponential Moving Average
WMA : Weighted Moving Average
DEMA : Double Exponential Moving Average
TMA : Triangular Moving Average
VAR : Variable Index Dynamic Moving Average aka VIDYA
WWMA : Welles Wilder's Moving Average
ZLEMA : Zero Lag Exponential Moving Average
TSF : True Strength Force
HULL : Hull Moving Average
TILL : Tillson T3 Moving Average
About Screener Panel:
Users can explore 20 different and user-defined tickers, which can be changed from the SETTINGS (shares, crypto, commodities...) on this screener version.
The screener panel shows up right after the bars on the right side of the chart.
-In this screener version of MOST, users can define the number of demanded tickers (symbols) from 1 to 20 by checking the relevant boxes on the settings tab.
-All selected tickers can be screened in different timeframes.
-Also, different timeframes of the same Ticker can be screened.
IMPORTANT NOTICE:
Screener shows the results in 3 different logic:
1st LOGIC (Default Settings):
BUY AND SELL SIGNALS of MOST and MOVING AVERAGE LINE
Most Buy Signal: Moving Average Crosses ABOVE the MOST LINE
Most Sel Signal: Moving Average Crosses BELOW the MOST LINE
Tickers seen in green are the ones that are in an uptrend, according to MOST.
The ones that appear in red are those in the SELL signal, in a downtrend.
The numbers before each Ticker indicate how many bars passed after MOST's last BUY or SELL signal.
For example, according to the indicator, when BTCUSDT appears (3) in GREEN, Bitcoin switched to a BUY signal 3 bars ago.
2nd LOGIC (Moving Average & Price Flips Screener Mode):
This mode can only be activated by checking the 'Activate Moving Average Screening Mode' box on the settings menu.
MOST line will be disappeared after checking the box.
Buy Signal: When the Selected Price crosses ABOVE the selected Moving Average.
Sell Signal: When the Selected Price crosses BELOW the selected Moving Average.
Tickers seen in green are the ones that are in an uptrend, according to Moving Average & Price Flips.
The ones that appear in red are those in the SELL signal, in a downtrend.
The numbers before each Ticker indicate how many bars passed after the last BUY or SELL signal of Moving Average & Price Flips.
For example, according to the indicator, when BTCUSDT appears (3) in GREEN, Bitcoin switched to a BUY signal 3 bars ago.
3rd LOGIC (Moving Average Color Change Screener Mode):
Both 'Activate Moving Average Screening Mode' and 'Activate Moving Average Color Change Screening Mode' boxes must be checked in the settings tab.
Moving Average Line will turn out into two colors.
Green color means the moving average value is greater than the previous bar's value.
Red color means the moving average value is smaller than the previous bar's value.
Buy Signal: After the Selected Moving Average turns GREEN from red.
Sell Signal: After the Selected Moving Average turns RED from green.
-Screener shows the information about the color changes of the selected Moving Average with default settings.
If this option is preferred, users are advised to enlarge the length to have better signals.
Tickers seen in green are the ones that are in an uptrend, according to Moving Average Color.
The ones that appear in red are those in the SELL signal, in a downtrend.
The numbers before each Ticker indicate how many bars passed after the last BUY or SELL signal of Moving Average Color Change.
For example, according to the indicator, when BTCUSDT appears (3) in GREEN, Bitcoin switched to a BUY signal 3 bars ago.

RSI Divergence Screener by zdmreThis screener tracks the following for up to 20 assets:
-All selected tickers will be screened in same timeframes (as in the chart).
-Values in table indicate that how many days passed after the last Bullish or Bearish of RSI Divergence.
For example, when BTCUSDT appears Bullish-Days Ago (15) , Bitcoin has switched to a Bullish Divergence signal 15 days ago.
Thanks to @QuantNomad and @MUQWISHI for building the base for this screener.
*Use it at your own risk
Note:
Screener shows the information about the RSI Divergence Scanner by zdmre with default settings.
Based indicator:

Divergence Screener [Mr_Zed]Divergence Screener
This script allows you to scan multiple assets and timeframes for bullish and bearish divergences based on the RSI (Relative Strength Index) indicator.
Features
Supports up to 40 different assets and timeframes for simultaneous scanning.
Customizable settings for RSI period and source.
Adjustable lookback periods for identifying pivot highs and pivot lows.
Flexible range limits for filtering divergences based on the number of bars since the last pivot point.
Alerts for bullish and bearish divergences on confirmed bars.
