Bollinger Band Reversal StudyThis strategy was inspired by ParallaxFX.
This strategy attempts to predict when a price reversal will happen. It uses bollinger bands, stochastics and candle formations.
The idea is that when an indecision candle, such as a doji, crosses outside the bollinger bands, then is followed by another candle that pushed sharply back inside the bands, you have a setup.
These setups are marked with green arrows to go long and red arrows to go short. Wait until the next candle begins before acting. The arrow may come and go as the price fluctuates, so wait until the candle closes.
Another play is when the same setup occurs, but on the middle bollinger band instead of the outer band.
These setups are marked with blue arrows to go long and yellow arrows to go short. Wait until the next candle begins before acting. The arrow may come and go as the price fluctuates, so wait until the candle closes.
Closing can happen a number of ways. You can use a predetermined risk-reward or look to sell when the price reaches another band.
In summary.
Go long when a green or blue arrow appears.
Go Short when a red or yellow arrow appears.
Green arrows show signs of reversal from lower BB.
Blue arrows show signs of reversal from middle BB.
Red arrows show signs of reversal from upper BB.
Yellow arrows show signs of reversal from middle BB.
Wait for candle with arrow to close before taking trade.
Cerca negli script per "弘历投教boll指标代码分析"

Mean Reversion w/ Bollinger BandsThis is a more advanced version of my original mean reversion script.
It employs the famous Bollinger Bands.
This robot will buy when price falls below the lower Bollinger Band, and sell when price moves above the upper Bollinger Band.
I've only tested it on the S&P 500, though you could try it out on other assets to see the backtest performance.
During the recent COVID-19 bear market drop, it produced several buy signals on the S&P which I followed, and made some nice gains so far.
I still think this would make a better investing strategy (buy undervalued / sell over-valued), rather than a trading strategy.
I use this robot for my long term portfolio.

[fikira] Bollinger Bands + Higher Time FramesHere is my take on BB and MTF, based on the most excellent work of
"PineCoders" (MTF Selection Framework functions)!
The big advantage is that on 1 image you can easily see where
price is compared to 5 or less BB Bands (each of different Time Frames).
This gives a lot of Support and Resistance area's!
Includes:
- 1 Bollinger Bands (can be enabled/disabled - "Bollinger Bands"
- 4 Bollinger Bands (each can be enabled/disabled - "HTF Selection 1-4")
Each BB has its colour (can be changed)
- Labels (Timeframe and price) can be enabled/disabled
- Labels position and size can be changed
...

Bollinger Band - Keltner Squeeze - Failed Volatility BreakoutThis simple script provides Bollinger Band and Keltner Channel indicators, and will highlight areas where the Bollinger Bands enter into the Keltner Channel.
This script is based on the Failed Volatility Breakout (FVBO) System used by professional trader ChrisD_Macro. The default plot styles for the indicators in this script are based on Chris's setup, but visual styles as well as BB and Kelt settings (length, standard deviation, etc...) can all be easily customized with the user interface in the indicator settings.
You can also choose whether you want the condition to be triggered by just one Bollinger Band entering the Keltner Channel, or if it has to be both bands entering the channel.
This script is very useful when manually back testing the FVBO strategy, as it clearly highlights the BB-Kelt squeezes instead of having to constantly scroll in and out looking for them.
It can also be useful live as it has the ability to trigger TradingView alerts using the condition "BB-Kelt Squeeze".
Hope it's helpful
- JDC
Side Notes:
With Forex / Currencies this indicator I usually use this indicator on the 1 Day time frame.
Keep in mind that the script includes the Bollinger Bands and Keltner Channels, so if you already have your own version of these indicators on your chart, it will get really messy. (Just hide the other indicators while you get to know this one).

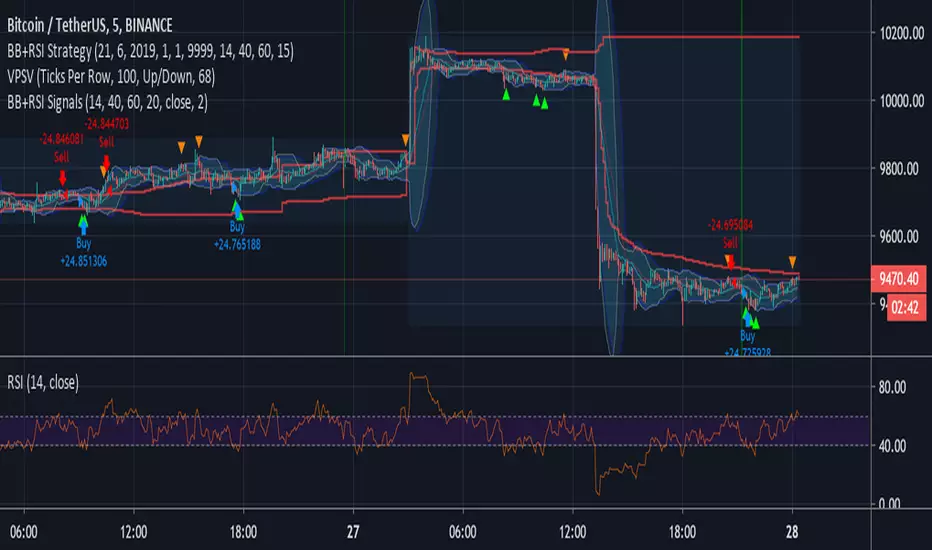
Bollinger + RSI Signals (by Bader Kamal)This idea originally by ChartArt on January 14, 2015 as Strategy, and I modify it to become as Signals on 26 July 2019.
This signals uses a modified RSI to sell when the RSI increases over the value of 60 (or to buy when the value falls below 40), with the classic Bollinger Bands strategy to sell when the price is above the upper Bollinger Band (and to buy when this value is below the lower band).
This signals only triggers when both the RSI and the Bollinger Bands indicators are at the same time in a overbought or oversold condition.
Bollinger and Tendencies (Bollinger e Tendências )The strategy consists of buying when the price breaks up (crossover) the bottom line of the Bollinger and selling when the price breaks down (crossunder) to your top line.
The chart still shows trends clearly, with the fill between the exponential average and the closing value of the canlestick, green at high, red at low (this part of the script is based on the code: "Pivot Daily Price Color" by Rimko).
It also places notes on the high and low candlesticks (based on the code: "Candlesticks Pattern Identified" by Repo32).
It is recommended to use it in conjunction with the "IFR and Storage" script (also available to me), and some volume script.
A estratégia consiste em comprar quando o preço rompe para cima (crossover) a linha inferior do Bollinger e vender quando o preço rompe para baixo (crossunder) a sua linha superior.
O gráfico ainda mostra as tendências de forma clara, com o preenchimento entre a média exponencial e o valor de fechamento do canlestick, verde em alta, vermelho em baixa (essa parte do script é baseada no código: "Pivot Daily Price Color" do usuário: Rimko).
Também, coloca apontamentos nos candlesticks de alta e de baixa (baseado no código: "Candlesticks Pattern Identified" do usuário Repo32).
Recomenda-se a utilização em conjunto com o script "IFR e Estocagem" (também por mim disponibilizado), e algum script de volume.

TEMA/hullMA Ribbon with Bollinger BandsDesigned for shorted time frames.
Bollinger bands based off of TEMA as source.
Ribbon based off TEMA and hullMA divergence.
RMA used to signal Bollinger bands.
Ribbon:
pinch -> reversal
blue -> sign of possible uptrend
red -> sign of possible downtrend
Bollinger bands background:
blue -> sign of continuing uptrend
red -> sign of continuing downtrend

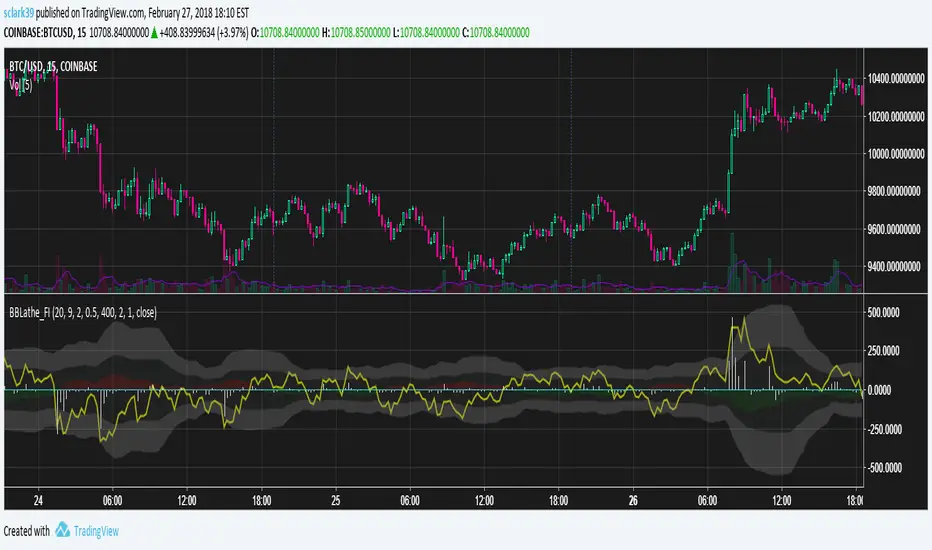
BBLathe2: Bollinger Band Lathe w/ Elder's Force Index [sclark39]Welcome to the second version of the BBLathe!
This shows Bollinger Bands centered on a horizontal basis, to make it easier to see how volatility is changing and identify squeeze opportunities. By default Bollinger bands are calculated using an exponential moving average and an improved higher precision stdev implementation, but this can be disabled. Version 2 also shows Elder's Force Index as a white histogram, so you can see some volume information to help confirm the power of the bears/bulls. The green/red shadow shows how the Bollinger's basis is changing, and when it is going up there will be a green shadow underneath the basis line (this can be inverted in the settings). There is also price line (yellow) showing the location of the price within the Bollinger Bands.
Use this indicator for trades at your own risk, I made this for fun and it is not a trade recommendation.
That being said, if you like my work please tip me!
ETH: 0xf8E0Ea503B5c833fD4546E7fa2c70EcE42A27C8A
Please comment with feedback and requests!
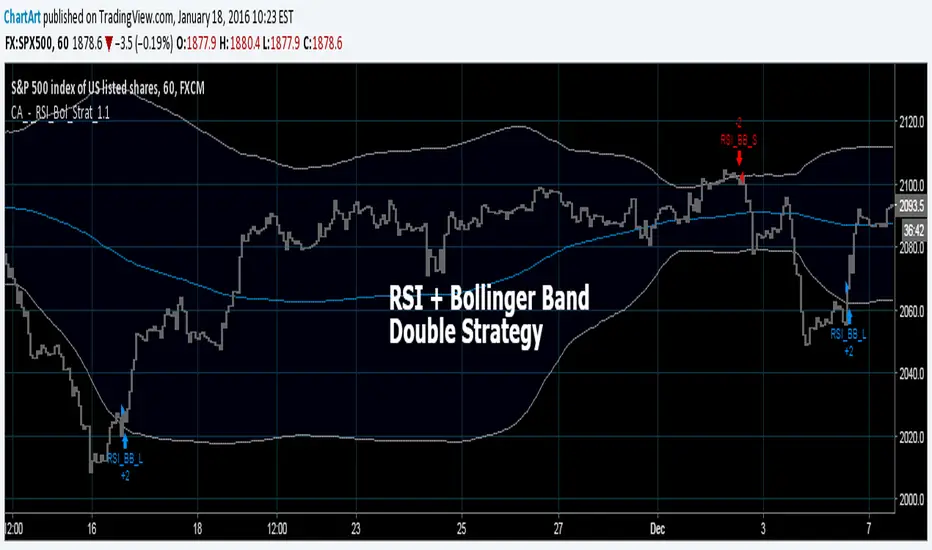
Bollinger + RSI, Double Strategy (by ChartArt) v1.1This strategy uses the RSI indicator together with the Bollinger Bands to sell when the price is above the upper Bollinger Band (and to buy when this value is below the lower band). This simple strategy only triggers when both the RSI and the Bollinger Band indicators are at the same time in a overbought or oversold condition.
UPDATE
In this updated version 1.1 the strategy was both simplified for the user (less inputs) and made more successful in backtesting by now using a 200 period for the SMA which is the basis for the Bollinger Band. I also reduced the number of color alerts to show fewer, but more relevant trading opportunities.
And just like the first version this strategy does not use close prices from higher-time frame and should not repaint after the current candle has closed. It might repaint like every Tradingview indicator while the current candle hasn't closed.
All trading involves high risk; past performance is not necessarily indicative of future results. Hypothetical or simulated performance results have certain inherent limitations. Unlike an actual performance record, simulated results do not represent actual trading. Also, since the trades have not actually been executed, the results may have under- or over-compensated for the impact, if any, of certain market factors, such as lack of liquidity. Simulated trading programs in general are also subject to the fact that they are designed with the benefit of hindsight. No representation is being made that any account will or is likely to achieve profits or losses similar to those shown.
P.S. For advanced users if you want access to more functions of this strategy script, then please use version 1.0:
Volume Weighted Bollinger BandsThis indicator provides a customizable version of Bollinger Bands, enhanced with optional volume weighting and a method for decomposing market volatility.
Key Features:
Volatility Decomposition: The indicator's primary feature is its ability to separate total volatility, controlled by the 'Estimate Bar Statistics' option.
Standard Mode (Estimate Bar Statistics = OFF): The indicator functions as a customizable Bollinger Band. It calculates the standard deviation of the user-selected Source and plots a single set of bands.
Decomposition Mode (Estimate Bar Statistics = ON): The indicator uses a statistical model ('Estimator') to calculate within-bar volatility. (Assumption: In this mode, the Source input is ignored, and an estimated mean for each bar is used instead). This mode displays two sets of bands:
Inner Bands: Show only the contribution of the 'between-bar' volatility.
Outer Bands: Show the total volatility (the sum of between-bar and within-bar components).
Customizable Construction: The indicator is a hybrid:
Basis Line: The central line is calculated using a selectable Moving Average type (e.g., EMA, SMA, WMA).
Volume Weighting: An option (Volume weighted) allows for volume to be incorporated into the calculation of both the basis MA and the volatility decomposition.
Logarithmic Scaling: An optional 'Normalize' mode calculates the bands on a logarithmic scale. This results in bands that maintain a constant percentage distance from the basis, suitable for analyzing exponential markets.
Multi-Timeframe (MTF) Engine: The indicator includes an MTF conversion block. When a Higher Timeframe (HTF) is selected, advanced options become available: Fill Gaps handles data gaps, and Wait for timeframe to close prevents repainting by ensuring the indicator only updates when the HTF bar closes.
Integrated Alerts: Includes a full set of built-in alerts for the source price crossing over or under the central MA line and the outermost calculated volatility band.
DISCLAIMER
For Informational/Educational Use Only: This indicator is provided for informational and educational purposes only. It does not constitute financial, investment, or trading advice, nor is it a recommendation to buy or sell any asset.
Use at Your Own Risk: All trading decisions you make based on the information or signals generated by this indicator are made solely at your own risk.
No Guarantee of Performance: Past performance is not an indicator of future results. The author makes no guarantee regarding the accuracy of the signals or future profitability.
No Liability: The author shall not be held liable for any financial losses or damages incurred directly or indirectly from the use of this indicator.
Signals Are Not Recommendations: The alerts and visual signals (e.g., crossovers) generated by this tool are not direct recommendations to buy or sell. They are technical observations for your own analysis and consideration.

Bollinger Bands ForLoopBollinger Bands ForLoop
OVERVIEW
BB ForLoop is an improved version of Bollinger Bands it is designed to calculate an array of values 1 or -1 depending if soruce for calculations is above or below basis.
It takes avereage of values over a range of lengths, providing trend signals smothed based on various moving averages in order to get rid of noise.
It offers flexibility with different signal modes and visual customizations.
TYPE OF SIGNALS
-FAST (MA > MA or MA > 0.99)
-SLOW (MA > 0)
-THRESHOLD CROSSING (when cross above/below treshold set independently for both directions)
-FAST THRESHOLD (when there's change in signal by set margin e.g (0.4 -> 0.2) means bearsih when FT is set to 0.1, when MA is > 0.99 it will signal bullish, when MA < -0.99 it will signal bearish)
Generaly Lime color of line indicates Bullish, Fuchsia indicates Bearish.
This colors are not set in stone so you can change them in settings.
-Bullish Trend, line color is lime
-Bearish Trend, line color is fuchsia
Credit
Idea for this script was from one of indicators created by www.tradingview.com
Warning
Be careful when using this indicator especialy combining DEMA with FT (Fast Treshold).
This indicator can be really noisy depending on the settings, signal mode so it should be used preferably as a part of an strategy not as a stand alone indicator
Remember the lower the timeframe you use the more noise there is.
No single indicator should be used alone when making investment decisions.

Bollinger Bands and SMA Channel Buy and Sell
This Indicator is a combination of a standard BB indicator incorporated with a SSL Channel by ErwinBeckers which is Simple Moving average with a length of set at 10 (Default) and calculates the high and low set for the default 10 to form a Channel.
The Settings for the Bollinger Band is the standard settings on a normal Bollinger Band - Length 20, source close and Standard dev 2
The setting for the SMA is length 10 and the high and low calculated or that length to form a channel.
The SMA Channel gives a green line for the Up channel and the Red line for the down Channel.
The basis of the indicator is that the Candle close above the Basis line of the BB and the SMA green line will give a buy indicator
and the same for Sell indicator the candle close below the basis BB and the SMA line Red will give a Sell indicator.
Please note that this indicator is a mix of 2 basic indicators found in Trading view, giving Buy and Sell indicators to make things easier to not look for this visually.
This code will be open source for anyone to use or back test or use it for whatever they want.
This code is for my own personal trading and cannot be relied upon. This indicator cannot be used and cannot guarantee anything, and caution should always be taken when trading. Use this with other indicators to give certanty.
Again use this for Paper Trading only.
I want to thank TradingView for its platform that facilitates development and learning.
Ignition Band Angles are Bollinger Bands with numeric angleI developed Bollinger Bands that provide a numeric value indicating their strength. To achieve this, I used the degree of the angle of attack and color-coded the numbers. The top band displays the number in the upper corner of the chart, the bottom band in the bottom corner, and the Basis is in the left middle. These numbers quantify the slope of the bands, which can be difficult to discern on a chart because stretching out the x and y axis can flatten or exaggerate a slope. With my Bollinger Bands, you get a constant reading that provides an accurate measurement of the angle and strength of a trend. I hope this helps.

Bollinger Bands SignalsDescription:
This indicator works well in trendy markets on long runs and in mean-reverting markets, at almost any timeframe.
That said, higher timeframes are much preferred for their intrinsic ability to cut out noise. The example chart is in 3H TF.
Be mindful, the script shows somewhat erratic jigsaw-like behaviour during consolidation periods when the price
jumps up and down in indecision which way to go. Fortunately, there are scripts out there that detect such periods.
You can choose between 4 Moving Averages, Vidya being the default. Period, Deviation and Bands Width parameters
all of them affect the signal generation.
For the Pine Script coder this script is pretty obvious.
It uses a standard technical analysis indicator - Bollinger Bands - and appends it with a 'width' parameter and
a signal generation procedure.
The signal generation procedure is the heart of this script that keeps the script pumping signals.
The BB width is used as a filter.
You can use this procedure in your own scripts and it will continue generate signals according to your rules.

Currency Strength by Bollinger BandsOVERVIEW
This indicator is a currency strength by bollinger band.
CONCEPTS
- The currency strength of the passage is determined by each deviation of the Bollinger Bands.
- Wins if price is above MA, ±1σ, ±2σ. Mark is "○".
- Lose if price is below MA, ±1σ, ±2σ. Mark is "●".
- Display up to 9 currency combinations
- Support for bar indexes other than the latest

[KL] Bollinger bands + RSI StrategyThis strategy is based on two of my previous scripts, one called “RSI14 + 10”; the other one called “Bollinger Bands Consolidation”. At its core, it combines the main setups from each of those two scripts but excludes the auxiliary features that were considered as experimental. This strategy will identify periods of squeeze, and then enter long during consolidation with a trailing stop loss set.
Primary indicator will be the Bollinger Bands. By comparing the width of the BBs with the ATR of the same lookback period (i.e. 2 standard deviations of the 20 recent closing prices vs ATR(20) x2), we begin to look for confirmation for entry whenever the standard deviation of prices is less than the ATR. This can be seen visually in the plots (i.e. default gray lines representing ATRx2 relative to BB center line).
Confirmation for entry will be the RSIs (slow-14, and fast-10). If both are upward sloping, then we assume prices are in an uptrend and may eventually break above upper band. RSIs are typically in mid-range when prices are consolidating, therefore no need to measure it.
Exits will happen in two cases, (1) when trailing stop loss hits, or (2) when RSIs signal that the instrument is overbought. No. 1 is self-explanatory. No. 2 happens, when RSI14 reaches above 70 (can be changed), followed by RSI10 catching up and surpassing RSI14.

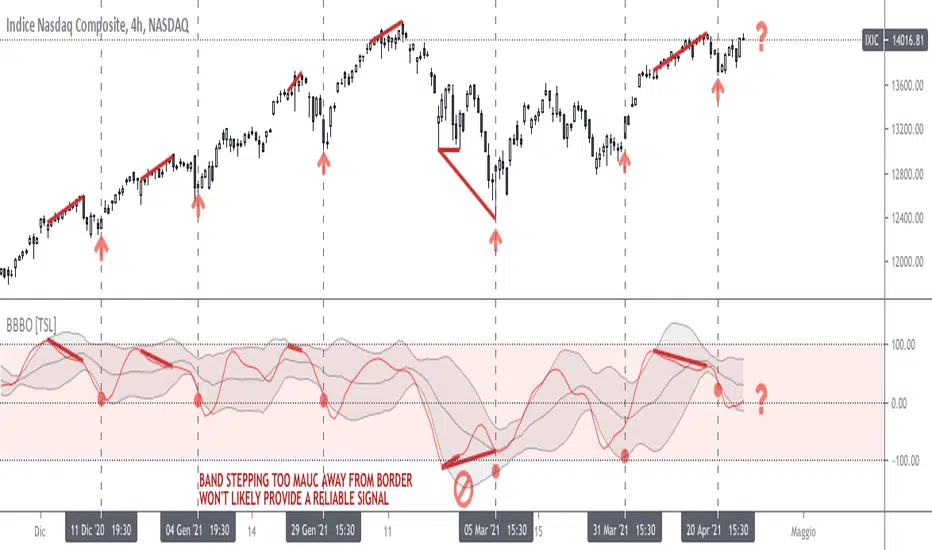
Bollinger on Bollinger OscillatorThis study is a user-friendly workaround to the BBOE+ (attached at the bottom).
I applied Bollinger Bands on BB Oscillator which spend his time bouncing between +100 -100 levels both representing extremes market conditions. You can use it to spot reliable entries/exits opportunities.
During an uptrend when the oscillator tends to -100 and the lower BB turn up you should consider a BUY. Do the same thing when the oscillator pushes under the lower BB nearby the Zero Line.
Make the opposite during a downtrend.
Also look for divergencies that occurs nearby the borders and BB squeezes too.
You can vary both the lenght for the Oscillator and BB.
Use “Upper Multiplier” and “Lower Multiplier” to set two different StDev from the basis (if you need).
You may also consider to apply an offset to the BB.
Is up to you to match the configuration that better-fits your market and time frame.
Default settings could well fits this IXIC 4H Chart.
So that this is basically a price-based indicator you would better consider to pair it with a volume-based or an absolute-momentum-based one.
SHARING IS INTENDED FOR EDUCATIONAL PURPOSE ONLY. NOT FOR PROFESSIONAL USE.
WILL APPRECIATE ANY FEEDBACK, QUESTION, SUGGESTION. (*)
(*) Please don’t ask me for “magic-setting” that do not exit, nor for “kaleidoscopic effects” cause I’m a big fan of such a minimalistic yet profession layouts.
FOLLOW UP TO CHECK UPDATES!
Bollinger DCA v1Simple "benchmark" strategy for ETFs, Stocks and Crypto! Super-easy to implement for beginners, a BTD (buy-the-dip) strategy means that you buy a fixed amount of an ETF / Stock / Crypto every time it falls. For instance, to BTD the S&P 500 ( SPY ), you could purchase $500 USD each time the price falls. Assuming the macro-economic conditions of the underlying country remain favourable, BTD strategies will result in capital gains over a period of many years, e.g. 10 years.
Recommended Chart Settings:
Asset Class: ETF / Stocks / Crypto
Time Frame: H1 (Hourly) / D1 (Daily) / W1 (Weekly) / M1 (Monthly)
Necessary ETF Macro Conditions:
1. Country must have healthy demographics, good ratio of young > old
2. Country population must be increasing
3. Country must be experiencing price-inflation
Necessary Stock Conditions:
1. Growing revenue
2. Growing net income
3. Consistent net margins
4. Higher gross/net profit margin compared to its peers in the industry
5. Growing share holders equity
6. Current ratios > 1
7. Debt to equity ratio (compare to peers )
8. Debt servicing ratio < 30%
9. Wide economic moat
10. Products and services used daily, and will stay relevant for at least 1 decade
Necessary Crypto Conditions:
1. Honest founders
2. Competent technical co-founders
3. Fair or non-existent pre-mine
4. Solid marketing and PR
5. Legitimate use-cases / adoption
Default Robot Settings:
Contribution (USD): $500
When: Dips below lower Bollinger Band
*Robot buys $500 worth of ETF , Stock, Crypto, every time price falls below the lower Bollinger Band
*Equity curve can be seen from the bottom panel*
Risk Warning:
This strategy is low-risk, however it assumes you have a long time horizon of at least 5 to 10 years. The longer your holding-period, the better your returns. The only thing the user has to keep-in-mind are the macro-economic conditions as stated above. If unsure, please stick to ETFs rather than buying individual stocks or cryptocurrencies.

Bollinger Band Color BarsThis is a simple addition to the built in Bollinger Bands script. All it does is replaces the traditional plotting of Bollinger Bands with color bars.

Volume Weighted Bollinger Bands 出来高加重ボリンジャーバンドIt is a volume-weighted index of Bollinger Bands.
The central line is vwma so it's quite responsive
The standard deviation is also volume weighted
Charts without volume are not weighted with volume as 1.
It seems that the usage in trading is the same as the Bollinger band
ボリンジャーバンドを出来高加重した指標です
中央線はvwma出来高加重移動平均なのでかなり反応が良いです
標準偏差も出来高加重してしています
出来高の無いチャートは出来高を1として加重しないようにしています
トレードでの使い方はボリンジャーバンドと同じで良いと思われます

Bollinger Channels / EMA and SMAThis is written as a system to replace the BB strategy.
I think it will work well.
It looks pretty stylish.
Description / Usage:
Adjust the length and multiplier based on your location with Bollinger Bands.
The multiplier of 1 provides you with a basic channel with high and low-source EMA (or SMA).
And with the 8-day exponential moving average, you can observe short entries and exits.
I wish good luck to the friends who will use it.
You can support and track new indicators.
Bu, BB stratejisinin yerini alacak bir sistem olarak yazılmıştır.
Oldukça şık görünüyor.
Kullanım
Bollinger Bantları ile bulunduğunuz yere göre uzunluk ve çarpanı ayarlayın.
1 çarpanı size yüksek ve düşük kaynaklı EMA (veya SMA) içeren temel bir kanal sağlar.
Ve 8 günlük üstel hareketli ortalama ile kısa giriş ve çıkışları gözlemleyebilirsiniz.
Kullanacak arkadaşlara bol kazançlar diliyorum.
Yeni indikatör için destek olabilir ve takip edebilirsiniz.

Keltner | Bollinger | SqueezePercent B (%B), it's derivation Percent K (%K) and squeeze indicator combined in one.
blue line = bollinger %
orange line = keltner %
red background = squeeze*
squeeze = bollinger bands are inside (encapsulated by) keltner channel

Bollinger Bands on MacdOnly longs when Macd line is above Bollinger Band and shorts when Macd line is above Bollinger Band, this will avoid many problems.
thumbs up!!!
