SMC OB+HOBSmart Money OB/HOB Indicator — Quick Guide
Use this as a field manual: what you’re seeing, how it’s decided, and which settings to use for different timeframes and trade styles.
What the tool plots
Bullish Order Block (OB) — teal box
The last small down candle before a bullish displacement/BOS. Height = candle body (default) or wick range (if you choose “Wick”).
Pin (small white dot) at the origin candle’s time to make anchoring obvious.
Bearish Order Block (OB) — red box
The last small up candle before a bearish displacement/BOS.
Hidden Order Block (HOB) — same box but yellow-tinted fill
A valid OB with one or more same-bias FVGs “ahead” (i.e., OB sits “behind” inefficiency). These tend to be stronger.
Mitigation state (fill transparency)
Unmitigated (least transparent): price hasn’t meaningfully traded back into the box. Highest priority.
Partial (more transparent): some penetration; still valid.
Full (most transparent): fully consumed; lower priority (optional to hide).
Top-K border — thin white outline
Only the best-scoring OBs/HOBs per direction are drawn to reduce clutter.
Auto-Fibs (optional)
OTE zone (0.62–0.79) — subtle purple band across the current swing leg.
0.618 / 0.705 / 0.786 — thin white horizontal lines. Confluence here adds score.
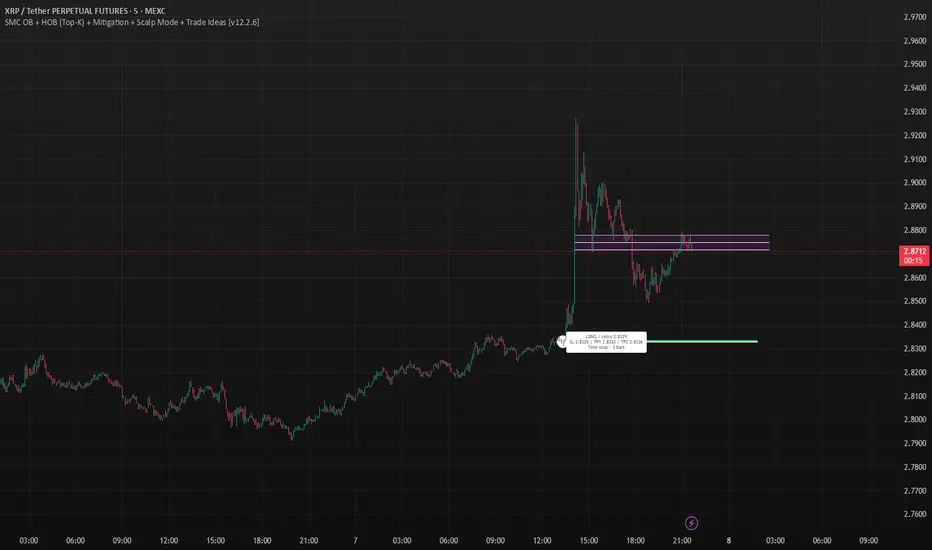
Trade idea lines (per Top-K block)
Entry — white line (mid/edge per your setting).
Stop — red line (box edge ± your pad).
TP1/TP2 — lime lines, R-based from entry→stop distance.
Label shows LONG/SHORT, entry, SL, TP1, TP2, time-stop (bars).
Note: Fair Value Gaps (FVGs) are tracked internally to classify HOBs and for pruning, not drawn to avoid noise.
How a block is qualified (in plain English)
BOS + Displacement:
Close breaks the recent swing high/low by at least N ticks and the bar shows impulse (body ≥ X·ATR and ≥ Y% of its total range).
(Settings: “Close beyond ≥ ticks”, “Min impulse body (x ATR)”, “Body/TR min %”)
Seed candle:
Look back ≤ N bars for the last opposite small-body candle (body ≤ Z% of its range). That candle’s body/wick becomes the OB height.
(Settings: “Last opposite candle within N bars”, “OB body ≤ % of TR”, “OB height model”)
Hidden OB:
Count same-bias FVGs “ahead”. If ≥ your threshold → tag the OB as HOB.
(Setting: “Require ≥ N same-bias FVGs ahead”)
Mitigation tracking:
As price trades into the box, we compute penetration %, updating unmitigated / partial / full state each bar.
Ranking (Top-K):
Every OB/HOB gets a score: near price, newer, hidden, near fib, and unmitigated boost. We draw only the Top-K per direction.
Inputs you’ll actually tweak
Timeframe
Compute on: Current (uses your chart TF) or Specific (MTF scan).
Process last N bars: reduce for speed, increase to see more history.
Anchoring
Extend: Right, Limited, or Origin only.
Limited draws boxes to a fixed number of bars so charts stay clean.
Show origin pins: Keep on so you always know the source candle.
Structure / BOS (signal frequency vs. quality)
Require FVG on break bar: ON = stricter, OFF = more signals.
Min impulse body (x ATR): higher = stricter.
Body/TR min %: higher = stricter.
Close beyond ≥ ticks: 0–1 for LTF; 1–3 for HTF.
Order Blocks
OB height model: Body (cleaner) or Wick (wider protection).
Last opposite candle within N bars: 3–8 (higher finds more).
OB body ≤ % of TR: 0.35–0.70 (lower = stricter).
Min OB height (ticks): 1–2 (avoid micro slivers).
Expire on first touch: If ON, removes boxes after first reaction.
Hidden OB
Require ≥ N FVGs ahead: 0–1 for LTF (more HOBs), 1–2 for HTF.
Mitigation Filter (what you show)
Toggle Unmitigated / Partial / Full visibility.
For precision trading, keep Unmitigated on; show others while scanning.
Auto-Fibs
Enable fib confluence: On adds score near 0.618/0.705/0.786.
Draw lines / OTE: Visual only; confluence also boosts ranking.
Tolerance (x ATR): how close price must be to count as “near fib”.
Ranking & Draw
Top-K per direction: how many OBs/HOBs you’ll see each side.
Prefer near / newer / hidden / unmitigated: scoring toggles.
Fib boost: how much fib confluence bumps a level.
Trade Ideas
Entry style: 50% of OB (balanced) or OB edge (faster fills).
Stop pad (ticks/ATR): give a little room beyond the box edge.
TP1/TP2 (R): risk-multiple targets (e.g., 1R, 2R).
Time stop (minutes): exit if it doesn’t go in time.
Execution / Alerts (recommended)
Keep on-close workflow: do not enable calc_on_every_tick.
When creating alerts, choose Once per bar close.
How to use it (mechanical checklist)
Scan: Focus on Top-K boxes. HOBs (yellow-tinted) and unmitigated get first look.
Context (optional): If you like, also check HTF structure or obvious liquidity pools (equal highs/lows).
Confluence: Prefer boxes near 0.618/0.705/0.786 or inside the OTE band.
Trigger: Let the bar close. If entry line is touched next, you have a go-signal with a placed stop and R-targets.
Manage: If TP1 hits, move SL to BE. For HOBs, consider a runner (trail under minor swing/FVG) — they often travel further.
Time stop: If it hasn’t moved within N minutes/bars, cut it; don’t babysit.
Preset recipes (copy these settings)
1) Hyper-Scalp (1–3m) — frequent, fast
Structure / BOS:
FVG on break = OFF | Min impulse = 0.6–0.8 | Body/TR = 0.45–0.55 | Close beyond = 0–1
Order Blocks:
Opposite lookback = 5–6 | OB body ≤ 0.55–0.60 | Min height = 1
HOB: Need FVGs = 0–1
Mitigation view: Show Unmit/Partial, optionally Full while scanning
Ranking: Top-K = 4–6, prefer near/new/hidden/unmit = ON, Fib boost = 0.6–1.0
Trade Ideas: Entry = OB edge, Stop pad = 1–2 ticks, Time stop = 5–8 min
Execution: On bar close alerts
2) Intraday (5–15m) — balanced
Structure / BOS:
FVG on break = OFF | Min impulse = 0.8–1.0 | Body/TR = 0.55–0.60 | Close beyond = 1
Order Blocks:
Opposite lookback = 4–5 | OB body ≤ 0.50–0.55 | Min height = 1–2
HOB: Need FVGs = 1
Ranking: Top-K = 3–4, Fib boost = 1.0–1.5
Trade Ideas: Entry = 50%, Stop pad = 2–3 ticks, Time stop = 10–20 min
3) Swing (1H–4H) — selective, higher quality
Structure / BOS:
FVG on break = ON | Min impulse = ≥1.0 | Body/TR = ≥0.65 | Close beyond = 1–3
Order Blocks:
Opposite lookback = 3–4 | OB body ≤ 0.45–0.50 | Min height = 2–4
HOB: Need FVGs = 1–2
Ranking: Top-K = 2–3, Fib boost = 1.5–2.0
Trade Ideas: Entry = 50%, Stop pad = a few ticks + ATR pad, Time stop = few bars
4) HTF (Daily+) — very selective
Keep swing settings, increase Min impulse and Close beyond a bit, reduce Top-K to 1–2.
Priority rules (what to trade first)
HOB over OB
Unmitigated over partial/full
With fib confluence over without
Near price and recent over far/old
Favor levels that follow a sweep (equal highs/lows taken, then return to your box)
If two boxes tie, take the one with the cleaner origin candle and simpler path to TP (fewer nearby obstacles).
Troubleshooting & tips
“I’m not seeing many signals.”
Loosen Structure/BOS (lower ATR and Body/TR), increase Opposite lookback, allow Partial/Full in view, raise Top-K.
“Too many lines/boxes.”
Lower Top-K, use Limited extension (Anchoring), hide Partial/Full, and keep fib lines if you rely on confluence.
“Stuff looks offset.”
Keep origin pins on. Use xloc.bar_time (already in code) and avoid custom time compressions that desync objects.
Execution discipline:
Use on-close alerts. Respect time stops. Size by fixed risk per trade, not fixed leverage.
Cerca negli script per "BOS"
Advanced ICT Theory - A-ICT📊 Advanced ICT Theory (A-ICT): The Institutional Manipulation Detector
Are you tired of being the liquidity? Stop chasing shadows and start tracking the architects of price movement.
This is not another lagging indicator. This is a complete framework for viewing the market through the lens of institutional traders. Advanced ICT Theory (A-ICT) is an all-in-one, military-grade analysis engine designed to decode the complex language of "Smart Money." It automates the core tenets of Inner Circle Trader (ICT) methodology, moving beyond simple patterns to build a dynamic, real-time narrative of market manipulation, liquidity engineering, and institutional order flow.
AIT provides a living blueprint of the market, identifying high-probability zones, tracking structural shifts, and scoring the quality of setups with a sophisticated, multi-factor algorithm. This is your X-ray into the market's true intentions.
🔬 THE CORE ENGINE: DECODING THE THEORY & FORMULAS
A-ICT is built upon a sophisticated, multi-layered logic system that interprets price action as a story of cause and effect. It does not guess; it confirms. Here is the foundational theory that drives the engine:
1. Market Structure: The Blueprint of Trend
The script first establishes a deep understanding of the market's skeleton through multi-level pivot analysis. It uses ta.pivothigh and ta.pivotlow to identify significant swing points.
Internal Structure (iBOS): Minor swings that show the short-term order flow. A break of internal structure is the first whisper of a potential shift.
External Structure (eBOS): Major swing points that define the primary trend. A confirmed break of external structure is a powerful statement of trend continuation. AIT validates this with optional Volume Confirmation (volume > volumeSMA * 1.2) and Candle Confirmation to ensure the break is driven by institutional force, not just a random spike.
Change of Character (CHoCH): This is the earthquake. A CHoCH occurs when a confirmed eBOS happens against the prevailing trend (e.g., a bearish eBOS in a clear uptrend). A-ICT flags this immediately, as it is the strongest signal that the primary trend is under threat of reversal.
2. Liquidity Engineering: The Fuel of the Market
Institutions don't buy into strength; they buy into weakness. They need liquidity. A-ICT maps these liquidity pools with forensic precision:
Buyside & Sellside Liquidity (BSL/SSL): Using ta.highest and ta.lowest, AIT identifies recent highs and lows where clusters of stop-loss orders (liquidity) are resting. These are institutional targets.
Liquidity Sweeps: This is the "manipulation" part of the detector. AIT has a specific formula to detect a sweep: high > bsl and close < bsl . This signifies that institutions pushed price just high enough to trigger buy-stops before aggressively selling—a classic "stop hunt." This event dramatically increases the quality score of subsequent patterns.
3. The Element Lifecycle: From Potential to Power
This is the revolutionary heart of A-ICT. Zones are not static; they have a lifecycle. AIT tracks this with its dynamic classification engine.
Phase 1: PENDING (Yellow): The script identifies a potential zone of interest based on a specific candle formation (a "displacement"). It is marked as "Pending" because its true nature is unknown. It is a question.
Phase 2: CLASSIFICATION: After the zone is created, AIT watches what happens next. The zone's identity is defined by its actions:
ORDER BLOCK (Blue): The highest-grade element. A zone is classified as an Order Block if it directly causes a Break of Structure (BOS) . This is the footprint of institutions entering the market with enough force to validate the new trend direction.
TRAP ZONE (Orange): A zone is classified as a Trap Zone if it is directly involved in a Liquidity Sweep . This indicates the zone was used to engineer liquidity, setting a "trap" for retail traders before a reversal.
REVERSAL / S&R ZONE (Green): If a zone is not powerful enough to cause a BOS or a major sweep, but still serves as a pivot point, it's classified as a general support/resistance or reversal zone.
4. Market Inefficiencies: Gaps in the Matrix
Fair Value Gaps (FVG): AIT detects FVGs—a 3-bar pattern indicating an imbalance—with a strict formula: low > high (for a bullish FVG) and gapSize > atr14 * 0.5. This ensures only significant, volatile gaps are shown. An FVG co-located with an Order Block is a high-confluence setup.
5. Premium & Discount: The Law of Value
Institutions buy at wholesale (Discount) and sell at retail (Premium). AIT uses a pdLookback to define the current dealing range and divides it into three zones: Premium (sell zone), Discount (buy zone), and Equilibrium. An element's quality score is massively boosted if it aligns with this principle (e.g., a bullish Order Block in a Discount zone).
⚙️ THE CONTROL PANEL: A COMPLETE GUIDE TO THE INPUTS MENU
Every setting is a lever, allowing you to tune the AIT engine to your exact specifications. Master these to unlock the script's full potential.
🎯 A-ICT Detection Engine
Min Displacement Candles: Controls the sensitivity of element detection. How it works: It defines the number of subsequent candles that must be "inside" a large parent candle. Best practice: Use 2-3 for a balanced view on most timeframes. A higher number (4-5) will find only major, more significant zones, ideal for swing trading. A lower number (1) is highly sensitive, suitable for scalping.
Mitigation Method: Defines when a zone is considered "used up" or mitigated. How it works: Cross triggers as soon as price touches the zone's boundary. Close requires a candle to fully close beyond it. Best practice: Cross is more responsive for fast-moving markets. Close is more conservative and helps filter out fake-outs caused by wicks, making it safer for confirmations.
Min Element Size (ATR): A crucial noise filter. How it works: It requires a detected zone to be at least this multiple of the Average True Range (ATR). Best practice: Keep this around 0.5. If you see too many tiny, irrelevant zones, increase this value to 0.8 or 1.0. If you feel the script is missing smaller but valid zones, decrease it to 0.3.
Age Threshold & Pending Timeout: These manage visual clutter. How they work: Age Threshold removes old, mitigated elements after a set number of bars. Pending Timeout removes a "Pending" element if it isn't classified within a certain window. Best practice: The default settings are optimized. If your chart feels cluttered, reduce the Age Threshold. If pending zones disappear too quickly, increase the Pending Timeout.
Min Quality Threshold: Your primary visual filter. How it works: It hides all elements (boxes, lines, labels) that do not meet this minimum quality score (0-100). Best practice: Start with the default 30. To see only A- or B-grade setups, increase this to 60 or 70 for an exceptionally clean, high-probability view.
🏗️ Market Structure
Lookbacks (Internal, External, Major): These define the sensitivity of the trend analysis. How they work: They set the number of bars to the left and right for pivot detection. Best practice: Use smaller values for Internal (e.g., 3) to see minor structure and larger values for External (e.g., 10-15) to map the main trend. For a macro, long-term view, increase the Major Swing Lookback.
Require Volume/Candle Confirmation: Toggles for quality control on BOS/CHoCH signals. Best practice: It is highly recommended to keep these enabled. Disabling them will result in more structure signals, but many will be false alarms. They are your filter against market noise.
... (Continue this detailed breakdown for every single input group: Display Configuration, Zones Style, Levels Appearance, Colors, Dashboards, MTF, Liquidity, Premium/Discount, Sessions, and IPDA).
📊 THE INTELLIGENCE DASHBOARDS: YOUR COMMAND CENTER
The dashboards synthesize all the complex analysis into a simple, actionable intelligence briefing.
Main Dashboard (Bottom Right)
ICT Metrics & Breakdown: This is your statistical overview. Total Elements shows how much structure the script is tracking. High Quality instantly tells you if there are any A/B grade setups nearby. Unmitigated vs. Mitigated shows the balance of fresh opportunities versus resolved price action. The breakdown by Order Blocks, Trap Zones, etc., gives you a quick read on the market's recent character.
Structure & Market Context: This is your core bias. Order Flow tells you the current script-determined trend. Last BOS shows you the most recent structural event. CHoCH Active is a critical warning. HTF Bias shows if you are aligned with the higher timeframe—the checkmark (✓) for alignment is one of the most important confluence factors.
Smart Money Flow: A volume-based sentiment gauge. Net Flow shows the raw buying vs. selling pressure, while the Bias provides an interpretation (e.g., "STRONG BULLISH FLOW").
Key Guide (Large Dashboard only): A built-in legend so you never have to guess. It defines every pattern, structure type, and special level visually.
📖 Narrative Dashboard (Bottom Left)
This is the "story" of the market, updated in real-time. It's designed to build your trading thesis.
Recent Elements Table: A live list of the most recent, high-quality setups. It displays the Type , its Narrative Role (e.g., "Bullish OB caused BOS"), its raw Quality percentage, and its final Trade Score grade. This is your at-a-glance opportunity scanner.
Market Narrative Section: This is the soul of A-ICT. It combines all data points into a human-readable story:
📍 Current Phase: Tells you if you are in a high-volatility Killzone or a consolidation phase like the Asian Range.
🎯 Bias & Alignment: Your primary direction, with a clear indicator of HTF alignment or conflict.
🔗 Events: A causal sequence of recent events, like "💧 Sell-side liquidity swept →
📊 Bullish BOS → 🎯 Active Order Block".
🎯 Next Expectation: The script's logical conclusion. It provides a specific, forward-looking hypothesis, such as "📉 Pullback expected to bullish OB at 1.2345 before continuation up."
🎨 READING THE BATTLEFIELD: A VISUAL INTERPRETATION GUIDE
Every color and line is a piece of information. Learn to read them together to see the full picture.
The Core Zones (Boxes):
Blue Box (Order Block): Highest probability zone for trend continuation. Look for entries here.
Orange Box (Trap Zone): A manipulation footprint. Expect a potential reversal after price interacts with this zone.
Green Box (Reversal/S&R): A standard pivot area. A good reference point but requires more confluence.
Purple Box (FVG): A market imbalance. Acts as a magnet for price. An FVG inside an Order Block is an A+ confluence.
The Structural Lines:
Green/Red Line (eBOS): Confirms the trend direction. A break above the green line is bullish; a break below the red line is bearish.
Thick Orange Line (CHoCH): WARNING. The previous trend is now in question. The market character has changed.
Blue/Red Lines (BSL/SSL): Liquidity targets. Expect price to gravitate towards these lines. A dotted line with a checkmark (✓) means the liquidity has been "swept" or "purged."
How to Synthesize: The magic is in the confluence. A perfect setup might look like this: Price sweeps below a red SSL line , enters a green Discount Zone during the NY Killzone , and forms a blue Order Block which then causes a green eBOS . This sequence, visible at a glance, is the story of a high-probability long setup.
🔧 THE ARCHITECT'S VISION: THE DEVELOPMENT JOURNEY
A-ICT was forged from the frustration of using lagging indicators in a market that is forward-looking. Traditional tools are reactive; they tell you what happened. The vision for A-ICT was to create a proactive engine that could anticipate institutional behavior by understanding their objectives: liquidity and efficiency. The development process was centered on creating a "lifecycle" for price patterns—the idea that a zone's true meaning is only revealed by its consequence. This led to the post-breakout classification system and the narrative-building engine. It's designed not just to show you patterns, but to tell you their story.
⚠️ RISK DISCLAIMER & BEST PRACTICES
Advanced ICT Theory (A-ICT) is a professional-grade analytical tool and does not provide financial advice or direct buy/sell signals. Its analysis is based on historical price action and probabilities. All forms of trading involve substantial risk. Past performance is not indicative of future results. Always use this tool as part of a comprehensive trading plan that includes your own analysis and a robust risk management strategy. Do not trade based on this indicator alone.
観の目つよく、見の目よわく
"Kan no me tsuyoku, ken no me yowaku"
— Miyamoto Musashi, The Book of Five Rings
English: "Perceive that which cannot be seen with the eye."
— Dskyz, Trade with insight. Trade with anticipation.

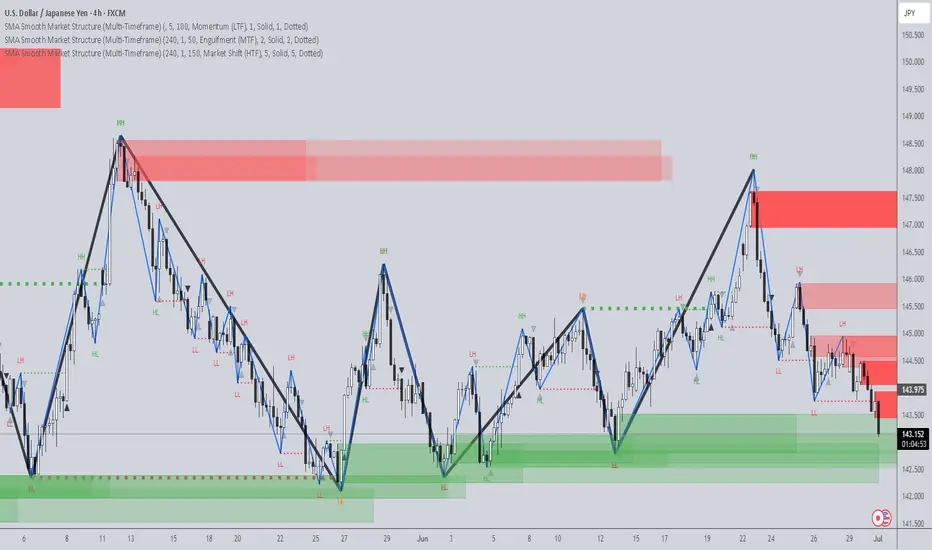
SMA Smooth Market Structure (Multi-Timeframe)SMA Market Structure (Multi-Timeframe) is a powerful tool for tracking structural price action, using simple moving averages across any higher timeframe (HTF). It blends Smart Money Concepts with clean swing logic to reveal trend shifts, breaks of structure, and supply/demand zones.
This indicator highlights key structure features:
• Break of Structure (BOS) – Automatic detection of bullish or bearish swing breaks
• Internal Shifts – Early clues that the market is building toward a reversal
• Liquidity Sweeps (LS) – Detects swing failures that may trap traders
• Zigzag Swing Lines – Cleanly connects swing highs and lows
• Dynamic Zones – Demand (green) and supply (red) blocks drawn from engulfing breakouts
How to Use:
• Set your preferred HTF (e.g. 1H on a 15m chart) to view structure in proper context and
adjust SMA to smooth out market structure for directional consistency
• Watch BOS lines and swing labels like HH, HL, LH, LL for directional clarity
• Use the MS (Market Shift) label to identify full reversals after internal shifts + BOS
• Demand/Supply zones mark areas of previous strength and will update or mitigate automatically
• Alerts notify you of every BOS, MS, HH, LL, and LS event — no need to monitor manually
Customization Features:
• Toggle visibility of market shift markers, internal shifts, and zones
• Choose how internal shifts are calculated (High/Low or Open)
• Customize line style, width, and colors for BOS and zigzag lines
• Control zone duration and how mitigated zones behave (fade or delete)
• Built-in safety for Pine Script’s history limits using smart offset caps
Best Use Tips:
• Combine with price action patterns or volume for confirmation
• MS + BOS + zone tap often marks a high-probability reversal setup
• Use it to align lower timeframe entries with higher timeframe structure
For traders who want structure clarity without clutter, this tool is built to keep your chart actionable and adaptive.
ICT Swiftedge# ICT SwiftEdge: Advanced Market Structure Trading System
**Overview**
ICT SwiftEdge is a powerful trading system built upon the foundation of ICTProTools' ICT Breakers, licensed under the Mozilla Public License 2.0 (mozilla.org). This script has been significantly enhanced by to combine market structure analysis with modern technical indicators and a sleek, AI-inspired statistics dashboard. The goal is to provide traders with a comprehensive tool for identifying high-probability trade setups, managing exits, and tracking performance in a visually intuitive way.
**Credits**
This script is a derivative work based on the original "ICT Breakers" by ICTProTools, used with permission under the Mozilla Public License 2.0. Significant enhancements, including RSI-MA signals, trend filtering, dynamic timeframe adjustments, dual exit strategies, and an AI-style statistics dashboard, were developed by . We express our gratitude to ICTProTools for their foundational work in market structure analysis.
**What It Does**
ICT SwiftEdge integrates multiple trading concepts to help traders identify and manage trades based on market structure and momentum:
- **Market Structure Analysis**: Identifies Break of Structure (BOS) and Market Structure Shift (MSS) patterns, which signal potential trend continuations or reversals. BOS indicates a continuation of the current trend, while MSS highlights a shift in market direction, providing key entry points.
- **RSI-MA Signals**: Generates "BUY" and "SELL" signals when BOS or MSS patterns align with the Relative Strength Index (RSI) smoothed by a Moving Average (RSI-MA). Signals are filtered to occur only when RSI-MA is above 50 (for buys) or below 50 (for sells), ensuring momentum supports the trade direction.
- **Trend Filtering**: Prevents multiple signals in the same trend, ensuring only one buy or sell signal per trend direction, reducing noise and improving trade clarity.
- **Dynamic Timeframe Adjustment**: Automatically adjusts pivot points, RSI, and MA parameters based on the selected chart timeframe (1M to 1D), optimizing performance across different market conditions.
- **Flexible Exit Strategies**: Offers two user-selectable exit methods:
- **Trailing Stop-Loss (TSL)**: Exits trades when price moves against the position by a user-defined distance (in points), locking in profits or limiting losses.
- **RSI-MA Exit**: Exits trades when RSI-MA crosses the 50 level, signaling a potential loss of momentum.
- Users can enable either or both strategies, providing flexibility to adapt to different trading styles.
- **AI-Style Statistics Dashboard**: Displays real-time trade performance metrics in a futuristic, neon-colored interface, including total trades, wins, losses, win/loss ratio, and win percentage. This helps traders evaluate the system's effectiveness without external tools.
**Why This Combination?**
The integration of these components creates a synergistic trading system:
- **BOS/MSS and RSI-MA**: Combining market structure breaks with RSI-MA ensures entries are based on both price action (structure) and momentum (RSI-MA), increasing the likelihood of high-probability trades.
- **Trend Filtering**: By limiting signals to one per trend, the system avoids overtrading and focuses on significant market moves.
- **Dynamic Adjustments**: Timeframe-specific parameters make the system versatile, suitable for scalping (1M, 5M) or swing trading (4H, 1D).
- **Dual Exit Strategies**: TSL protects profits during trending markets, while RSI-MA exits are ideal for range-bound or reversing markets, catering to diverse market conditions.
- **Statistics Dashboard**: Provides immediate feedback on trade performance, enabling data-driven decision-making without manual tracking.
This combination balances technical precision with user-friendly visuals, making it accessible to both novice and experienced traders.
**How to Use**
1. **Add to Chart**: Apply the script to any TradingView chart.
2. **Configure Settings**:
- **Chart Timeframe**: Select your chart's timeframe (1M to 1D) to optimize parameters.
- **Structure Timeframe**: Choose a timeframe for market structure analysis (leave blank for chart timeframe).
- **Exit Strategy**: Enable Trailing Stop-Loss (`useTslExit`), RSI-MA Exit (`useRsiMaExit`), or both. Adjust `tslPoints` for TSL distance.
- **Show Signals/Labels**: Toggle `showSignals` and `showExit` to display "BUY", "SELL", and "EXIT" labels.
- **Dashboard**: Enable `showDashboard` to view trade statistics. Customize colors with `dashboardBgColor` and `dashboardTextColor`.
3. **Trading**:
- Look for "BUY" or "SELL" labels to enter trades when BOS/MSS aligns with RSI-MA.
- Exit trades at "EXIT" labels based on your chosen strategy.
- Monitor the statistics dashboard to track performance (total trades, win/loss ratio, win percentage).
4. **Alerts**: Set up alerts for BOS, MSS, buy, sell, or exit signals using the provided alert conditions.
**License**
This script is licensed under the Mozilla Public License 2.0 (mozilla.org). The source code is available for review and modification under the terms of this license.
**Compliance with TradingView House Rules**
This publication adheres to TradingView's House Rules and Scripts Publication Rules. It provides a clear, self-contained description of the script's functionality, credits the original author (ICTProTools), and explains the rationale for combining indicators. The script contains no promotional content, offensive language, or proprietary restrictions beyond MPL 2.0.
**Note**
Trading involves risk, and past performance is not indicative of future results. Always backtest and validate the system on your preferred markets and timeframes before live trading.
Enjoy trading with ICT SwiftEdge, and let data-driven insights guide your decisions!

Qullamaggie [Modified] | FractalystWhat's the purpose of this strategy?
The strategy aims to identify high-probability breakout setups in trending markets, inspired by Kristjan "Qullamaggie" Kullamägi’s approach.
It focuses on capturing explosive price moves after periods of consolidation, using technical criteria like moving averages, breakouts, trailing stop-loss and momentum confirmation.
Ideal for swing traders seeking to ride strong trends while managing risk.
----
How does the strategy work?
The strategy follows a systematic process to capture high-momentum breakouts:
Pre-Breakout Criteria:
Prior Price Surge: Identifies stocks that have rallied 30-100%+ in recent month(s), signaling strong underlying momentum (per Qullamaggie’s volatility expansion principles).
Consolidation Phase: Looks for a tightening price range (e.g., flag, pennant, or tight base), indicating a potential "coiling" before continuation.
Trend Confirmation: Uses moving averages (e.g., 20/50/200 EMA) to ensure the stock is trading above key averages on the daily chart, confirming an uptrend.
Price Break: Enters when price clears the consolidation high with conviction.
Risk Management:
Initial Stop Loss: Placed below the consolidation low or a recent swing point to limit downside.
Break-Even Adjustment: Moves stop loss to breakeven once the trade reaches 1.5x risk-to-reward (RR), securing a "free trade" while letting winners run.
Trailing Stop (Unique Edge):
Market Structure Trailing: Instead of trailing via moving averages, the stop is dynamically adjusted using structural invalidation level. This adapts to price action, allowing the trade to stay open during volatile retracements while locking in gains as new structure forms.
Why This Matters: Most strategies use rigid trailing stops (e.g., below the 10EMA), which often exit prematurely in choppy markets. By trailing based on structure, this strategy avoids "noise" and captures larger trends, directly boosting overall returns.
----
What markets or timeframes is this suited for?
This is a long-only strategy designed for trending markets, and it performs best in:
Markets: Stocks (especially high-growth, liquid equities), cryptocurrencies (major pairs with strong volatility), commodities (e.g., oil, gold), and futures (index/commodity futures).
Timeframes: Primarily daily charts for swing trades (1-30 day holds), though weekly charts can help confirm broader trends.
Key Advantage: The TradingView script allows instant backtesting with adjustable parameters
You can:
- Test historical performance across multiple markets to identify which assets align best with the strategy.
- Optimize settings (e.g., trailing stop sensitivity, moving averages etc.) to match a market’s volatility profile.
Build a diversified portfolio by filtering for markets that show consistent profitability in backtests.
For example, you might discover cryptos require tighter trailing stops due to volatility, while stocks thrive with wider structural stops. The script automates this analysis, letting you to trade confidently.
----
What indicators or tools does the strategy use?
The strategy combines customizable technical tools with strict anti-lookahead safeguards:
Core Indicators:
Moving Averages: Adjustable periods (e.g., 20/50/200 EMA or SMA) and timeframes (daily/weekly) to confirm trend alignment. Users can test combinations (e.g., 10EMA vs. 20EMA) to optimize for specific markets.
Breakout Parameters:
Consolidation Length: Adjustable window to define the "tightness" of the pre-breakout pattern.
Entry Models: Flexible entry logics (Breakouts and fractals)
Anti-Lookahead Design:
All calculations (e.g., moving averages, consolidation ranges, volume averages) use only closed/confirmed data available at the time of the signal.
----
How do I manage risk with this strategy?
The strategy prioritizes customizable risk controls to align with your trading style and account size:
User-Defined Risk Inputs:
Risk Per Trade: Set a % of Equity (e.g., 1-2%) to determine position size. The strategy auto-calculates shares/contracts to match your selected risk per trade.
Flexibility: Choose between fixed risk or equity-based scaling.
The script adjusts position sizing dynamically based on your selection.
Pyramiding Feature:
Customizable Entries: Adjust the number of pyramiding trades allowed (e.g., 1-3 additional positions) in the strategy settings. Each new entry is triggered only if the prior trade hits its 1.5x RR target and the trend remains intact.
Risk-Scaled Additions: New positions use profits from prior trades, compounding gains without increasing initial risk.
Risk-Free Trade Mechanic:
Once a trade reaches 1.5x RR, the stop loss is moved to breakeven, eliminating downside risk.
The strategy then opens a new position (if pyramiding is enabled) using a portion of the locked-in profit. This "snowballs" winners while keeping total capital exposure stable.
Impact on Net Profit & Drawdown:
Net Profit Boost: Pyramiding lets you ride multi-leg trends aggressively. For example, a 100% runner could generate 2-3x more profit vs. a single-entry approach.
Controlled Drawdowns: Since new positions are funded by profits (not initial capital), max drawdown stays anchored to your original risk per trade (e.g., 1-2% of account). Even if later entries fail, the breakeven stop on prior trades protects overall equity.
Why This Works: Most strategies either over-leverage (increasing drawdowns) or exit too early. By recycling profits into new positions only after securing risk-free capital, this approach mimics hedge fund "scaling in" tactics while staying retail-trader friendly.
----
How does the strategy identify market structure for its trailing stoploss?
The strategy identifies market structure by utilizing an efficient logic with for loops to pinpoint the first swing candle that features a pivot of 2. This marks the beginning of the break of structure, where the market's previous trend or pattern is considered invalidated or changed.
----
What are the underlying calculations?
The underlying calculations involve:
Identifying Swing Points: The strategy looks for swing highs (marked with blue Xs) and swing lows (marked with red Xs). A swing high is identified when a candle's high is higher than the highs of the candles before and after it. Conversely, a swing low is when a candle's low is lower than the lows of the candles before and after it.
Break of Structure (BOS):
Bullish BOS: This occurs when the price breaks above the swing high level of the previous structure, indicating a potential shift to a bullish trend.
Bearish BOS: This happens when the price breaks below the swing low level of the previous structure, signaling a potential shift to a bearish trend.
Structural Liquidity and Invalidation:
Structural Liquidity: After a break of structure, liquidity levels are updated to the first swing high in a bullish BOS or the first swing low in a bearish BOS.
Structural Invalidation: If the price moves back to the level of the first swing low before the bullish BOS or the first swing high before the bearish BOS, it invalidates the break of structure, suggesting a potential reversal or continuation of the previous trend.
This method provides users with a technical approach to filter market regimes, offering an advantage by minimizing the risk of overfitting to historical data, which is often a concern with traditional indicators like moving averages.
By focusing on identifying pivotal swing points and the subsequent breaks of structure, the strategy maintains a balance between sensitivity to market changes and robustness against historical data anomalies, ensuring a more adaptable and potentially more reliable market analysis tool.
----
What entry criteria are used in this script?
The script uses two entry models for trading decisions: BreakOut and Fractal.
Underlying Calculations:
Breakout: The script records the most recent swing high by storing it in a variable. When the price closes above this recorded level, and all other predefined conditions are satisfied, the script triggers a breakout entry. This approach is considered conservative because it waits for the price to confirm a breakout above the previous high before entering a trade. As shown in the image, as soon as the price closes above the new candle (first tick), the long entry gets taken. The stop-loss is initially set and then moved to break-even once the price moves in favor of the trade.
Fractal: This method involves identifying a swing low with a period of 2, which means it looks for a low point where the price is lower than the two candles before and after it. Once this pattern is detected, the script executes the trade. This is an aggressive approach since it doesn't wait for further price confirmation. In the image, this is represented by the 'Fractal 2' label where the script identifies and acts on the swing low pattern.
----
What type of stop-loss identification method are used in this strategy?
This strategy employs two types of stop-loss methods: Initial Stop-loss and Trailing Stop-Loss.
Underlying Calculations:
Initial Stop-loss:
ATR Based: The strategy uses the Average True Range (ATR) to set an initial stop-loss, which helps in accounting for market volatility without predicting price direction.
Calculation:
- First, the True Range (TR) is calculated for each period, which is the greatest of:
- Current Period High - Current Period Low
- Absolute Value of Current Period High - Previous Period Close
- Absolute Value of Current Period Low - Previous Period Close
- The ATR is then the moving average of these TR values over a specified period, typically 14 periods by default. This ATR value can be used to set the stop-loss at a distance from the entry price that reflects the current market volatility.
Swing Low Based:
For this method, the stop-loss is set based on the most recent swing low identified in the market structure analysis. This approach uses the lowest point of the recent price action as a reference for setting the stop-loss.
Trailing Stop-Loss:
The strategy uses structural liquidity and structural invalidation levels across multiple timeframes to adjust the stop-loss once the trade is profitable. This method involves:
Detecting Structural Liquidity: After a break of structure, the liquidity levels are updated to the first swing high in a bullish scenario or the first swing low in a bearish scenario. These levels serve as potential areas where the price might find support or resistance, allowing the stop-loss to trail the price movement.
Detecting Structural Invalidation: If the price returns to the level of the first swing low before a bullish break of structure or the first swing high before a bearish break of structure, it suggests the trend might be reversing or invalidating, prompting the adjustment of the stop-loss to lock in profits or minimize losses.
By using these methods, the strategy dynamically adjusts the initial stop-loss based on market volatility, helping to protect against adverse price movements while allowing for enough room for trades to develop. The ATR-based stop-loss adapts to the current market conditions by considering the volatility, ensuring that the stop-loss is not too tight during volatile periods, which could lead to premature exits, nor too loose during calm markets, which might result in larger losses. Similarly, the swing low based stop-loss provides a logical exit point if the market structure changes unfavorably.
Each market behaves differently across various timeframes, and it is essential to test different parameters and optimizations to find out which trailing stop-loss method gives you the desired results and performance. This involves backtesting the strategy with different settings for the ATR period, the distance from the swing low, and how the trailing stop-loss reacts to structural liquidity and invalidation levels.
Through this process, you can tailor the strategy to perform optimally in different market environments, ensuring that the stop-loss mechanism supports the trade's longevity while safeguarding against significant drawdowns.
----
What type of break-even method is used in this strategy? What are the underlying calculations?
Moves the initial stop-loss to the entry price when the price reaches a certain RR ratio.
Calculation:
Break-even level = Entry Price + (Initial Risk * RR Ratio)
----
What tables are available in this script?
- Summary: Provides a general overview, displaying key performance parameters such as Net Profit, Profit Factor, Max Drawdown, Average Trade, Closed Trades and more.
Total Commission: Displays the cumulative commissions incurred from all trades executed within the selected backtesting window. This value is derived by summing the commission fees for each trade on your chart.
Average Commission: Represents the average commission per trade, calculated by dividing the Total Commission by the total number of closed trades. This metric is crucial for assessing the impact of trading costs on overall profitability.
Avg Trade: The sum of money gained or lost by the average trade generated by a strategy. Calculated by dividing the Net Profit by the overall number of closed trades. An important value since it must be large enough to cover the commission and slippage costs of trading the strategy and still bring a profit.
MaxDD: Displays the largest drawdown of losses, i.e., the maximum possible loss that the strategy could have incurred among all of the trades it has made. This value is calculated separately for every bar that the strategy spends with an open position.
Profit Factor: The amount of money a trading strategy made for every unit of money it lost (in the selected currency). This value is calculated by dividing gross profits by gross losses.
Avg RR: This is calculated by dividing the average winning trade by the average losing trade. This field is not a very meaningful value by itself because it does not take into account the ratio of the number of winning vs losing trades, and strategies can have different approaches to profitability. A strategy may trade at every possibility in order to capture many small profits, yet have an average losing trade greater than the average winning trade. The higher this value is, the better, but it should be considered together with the percentage of winning trades and the net profit.
Winrate: The percentage of winning trades generated by a strategy. Calculated by dividing the number of winning trades by the total number of closed trades generated by a strategy. Percent profitable is not a very reliable measure by itself. A strategy could have many small winning trades, making the percent profitable high with a small average winning trade, or a few big winning trades accounting for a low percent profitable and a big average winning trade. Most mean-reversion successful strategies have a percent profitability of 40-80% but are profitable due to risk management control.
BE Trades: Number of break-even trades, excluding commission/slippage.
Losing Trades: The total number of losing trades generated by the strategy.
Winning Trades: The total number of winning trades generated by the strategy.
Total Trades: Total number of taken traders visible your charts.
Net Profit: The overall profit or loss (in the selected currency) achieved by the trading strategy in the test period. The value is the sum of all values from the Profit column (on the List of Trades tab), taking into account the sign.
- Monthly: Displays performance data on a month-by-month basis, allowing users to analyze performance trends over each month and year.
- Weekly: Displays performance data on a week-by-week basis, helping users to understand weekly performance variations.
- UI Table: A user-friendly table that allows users to view and save the selected strategy parameters from user inputs. This table enables easy access to key settings and configurations, providing a straightforward solution for saving strategy parameters by simply taking a screenshot with Alt + S or ⌥ + S.
User-input styles and customizations:
Please note that all background colors in the style are disabled by default to enhance visualization.
How to Use This Strategy to Create a Profitable Edge and Systems?
Choose Your Strategy mode:
- Decide whether you are creating an investing strategy or a trading strategy.
Select a Market:
- Choose a one-sided market such as stocks, indices, or cryptocurrencies.
Historical Data:
- Ensure the historical data covers at least 10 years of price action for robust backtesting.
Timeframe Selection:
- Choose the timeframe you are comfortable trading with. It is strongly recommended to use a timeframe above 15 minutes to minimize the impact of commissions/slippage on your profits.
Set Commission and Slippage:
- Properly set the commission and slippage in the strategy properties according to your broker/prop firm specifications.
Parameter Optimization:
- Use trial and error to test different parameters until you find the performance results you are looking for in the summary table or, preferably, through deep backtesting using the strategy tester.
Trade Count:
- Ensure the number of trades is 200 or more; the higher, the better for statistical significance.
Positive Average Trade:
- Make sure the average trade is above zero.
(An important value since it must be large enough to cover the commission and slippage costs of trading the strategy and still bring a profit.)
Performance Metrics:
- Look for a high profit factor, and net profit with minimum drawdown.
- Ideally, aim for a drawdown under 20-30%, depending on your risk tolerance.
Refinement and Optimization:
- Try out different markets and timeframes.
- Continue working on refining your edge using the available filters and components to further optimize your strategy.
What Makes This Strategy Unique?
This strategy combines flexibility, smart risk management, and momentum focus in a way that’s rare and practical:
1. Adapts to Any Market Rhythm
Works on daily, weekly, or intraday charts without code changes.
Uses two entry types: classic breakouts (like trending stocks) or fractal patterns (to avoid false starts).
2. Smarter Stop-Loss System
No rigid rules: Stops adjust based on price structure (e.g., new “higher lows”), not fixed percentages.
Avoids whipsaws: Tightens stops only when the trend strengthens, not in choppy markets.
3. Safe Profit-Boosting Pyramiding
Adds new positions only after prior trades are risk-free (stops moved above breakeven).
Scales up using locked-in profits, not new capital, to grow gains safely.
4. Built-In Momentum Check
Tracks 1/3/6-month price growth to spotlight stocks with strong, lasting momentum.
Terms and Conditions | Disclaimer
Our charting tools are provided for informational and educational purposes only and should not be construed as financial, investment, or trading advice. They are not intended to forecast market movements or offer specific recommendations. Users should understand that past performance does not guarantee future results and should not base financial decisions solely on historical data.
Built-in components, features, and functionalities of our charting tools are the intellectual property of @Fractalyst Unauthorized use, reproduction, or distribution of these proprietary elements is prohibited.
- By continuing to use our charting tools, the user acknowledges and accepts the Terms and Conditions outlined in this legal disclaimer and agrees to respect our intellectual property rights and comply with all applicable laws and regulations.

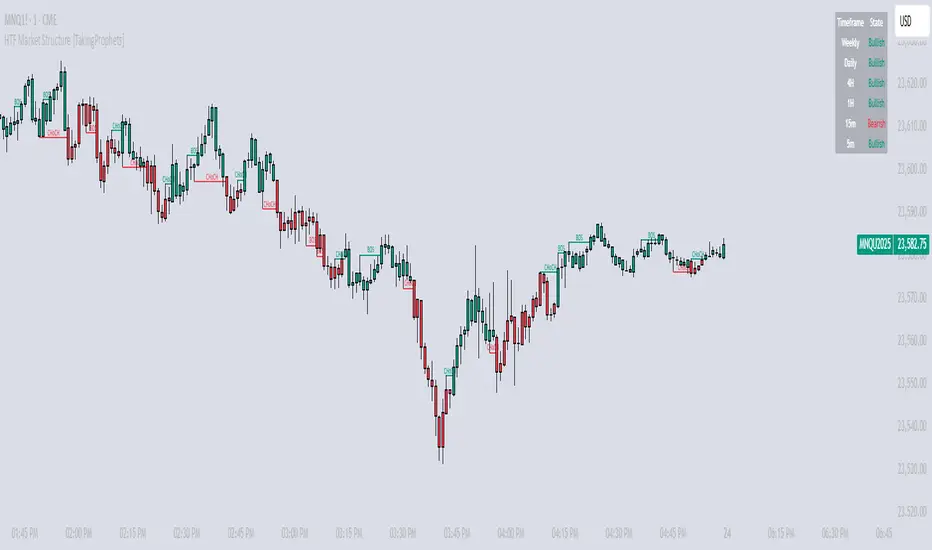
HTF Market Structure [TakingProphets]HTF Market Structure
The Market Structure CHoCH/BOS (Fractal) Indicator is designed for traders using smart money concepts and ICT (Inner Circle Trader) methodology to track market structure shifts in real time. It automatically detects Change of Character (CHoCH) and Break of Structure (BOS) events based on fractal highs and lows, helping traders identify potential trend reversals and continuations with greater precision.
🔹 Key Features:
✅ Automatic CHoCH & BOS Detection – No need for manual plotting; the indicator highlights key structure shifts.
✅ Custom Lookback Period – Adjustable fractal settings to fine-tune market structure sensitivity.
✅ Multi-Timeframe Market Structure Table – Displays the most recent CHoCH state on multiple timeframes (Weekly, Daily, 4H, 1H, 15m, 5m).
✅ Candle Coloring – Optional feature to change candle colors after a CHoCH for better visual clarity.
✅ Works Across All Markets – Use it for Forex, Stocks, Crypto, and Futures.
🔹 How It Works:
📌 Break of Structure (BOS) – Indicates a continuation of the existing trend when price breaks a previous swing high or low.
📌 Change of Character (CHoCH) – Suggests a potential trend reversal when price structure shifts direction.
📌 Multi-Timeframe Confirmation – The built-in table tracks the latest CHoCH across different timeframes to help confirm bias.
🔹 How to Use:
Look for CHoCH signals at key liquidity zones (order blocks, fair value gaps).
Use BOS confirmations to follow trend continuations.
Combine with other smart money concepts like imbalance fills and liquidity grabs for stronger trade setups.
🚀 Enhance your market structure analysis with the CHoCH/BOS Indicator
Dollar Cost Averaging (DCA) | FractalystWhat's the purpose of this strategy?
The purpose of dollar cost averaging (DCA) is to grow investments over time using a disciplined, methodical approach used by many top institutions like MicroStrategy and other institutions.
Here's how it functions:
Dollar Cost Averaging (DCA): This technique involves investing a set amount of money regularly, regardless of market conditions. It helps to mitigate the risk of investing a large sum at a peak price by spreading out your investment, thus potentially lowering your average cost per share over time.
Regular Contributions: By adding money to your investments on a pre-determined frequency and dollar amount defined by the user, you take advantage of compounding. The script will remind you to contribute based on your chosen schedule, which can be weekly, bi-weekly, monthly, quarterly, or yearly. This systematic approach ensures that your returns can earn their own returns, much like interest on savings but potentially at a higher rate.
Technical Analysis: The strategy employs a market trend ratio to gauge market sentiment. It calculates the ratio of bullish vs bearish breakouts across various timeframes, assigning this ratio a percentage-based score to determine the directional bias. Once this score exceeds a user-selected percentage, the strategy looks to take buy entries, signaling a favorable time for investment based on current market trends.
Fundamental Analysis: This aspect looks at the health of the economy and companies within it to determine bullish market conditions. Specifically, we consider:
Specifically, it considers:
Interest Rate: High interest rates can affect borrowing costs, potentially slowing down economic growth or making stocks less attractive compared to fixed income.
Inflation Rate: Inflation erodes purchasing power, but moderate inflation can be a sign of a healthy economy. We look for investments that might benefit from or withstand inflation.
GDP Rate: GDP growth indicates the overall health of the economy; we aim to invest in sectors poised to grow with the economy.
Unemployment Rate: Lower unemployment typically signals consumer confidence and spending power, which can boost certain sectors.
By integrating these elements, the strategy aims to:
Reduce Investment Volatility: By spreading out your investments, you're less impacted by short-term market swings.
Enhance Growth Potential: Using both technical and fundamental filters helps in choosing investments that are more likely to appreciate over time.
Manage Risk: The strategy aims to balance the risk of market timing by investing consistently and choosing assets wisely based on both economic data and market conditions.
----
What are Regular Contributions in this strategy?
Regular Contributions involve adding money to your investments on a pre-determined frequency and dollar amount defined by the user. The script will remind you to contribute based on your chosen schedule, which can be weekly, bi-weekly, monthly, quarterly, or yearly. This systematic approach ensures that your returns can earn their own returns, much like interest on savings but potentially at a higher rate.
----
How do regular contributions enhance compounding and reduce timing risk?
Enhances Compounding: Regular contributions leverage the power of compounding, where returns on investments can generate their own returns, potentially leading to exponential growth over time.
Reduces Timing Risk: By investing regularly, the strategy minimizes the risk associated with trying to time the market, spreading out the investment cost over time and potentially reducing the impact of volatility.
Automated Reminders: The script reminds users to make contributions based on their chosen schedule, ensuring consistency and discipline in investment practices, which is crucial for long-term success.
----
How does the strategy integrate technical and fundamental analysis for investors?
A: The strategy combines technical and fundamental analysis in the following manner:
Technical Analysis: It uses a market trend ratio to determine the directional bias by calculating the ratio of bullish vs bearish breakouts. Once this ratio exceeds a user-selected percentage threshold, the strategy signals to take buy entries, optimizing the timing within the given timeframe(s).
Fundamental Analysis: This aspect assesses the broader economic environment to identify sectors or assets that are likely to benefit from current economic conditions. By understanding these fundamentals, the strategy ensures investments are made in assets with strong growth potential.
This integration allows the strategy to select investments that are both technically favorable for entry and fundamentally sound, providing a comprehensive approach to investment decisions in the crypto, stock, and commodities markets.
----
How does the strategy identify market structure? What are the underlying calculations?
Q: How does the strategy identify market structure?
A: The strategy identifies market structure by utilizing an efficient logic with for loops to pinpoint the first swing candle that features a pivot of 2. This marks the beginning of the break of structure, where the market's previous trend or pattern is considered invalidated or changed.
What are the underlying calculations for identifying market structure?
A: The underlying calculations involve:
Identifying Swing Points: The strategy looks for swing highs (marked with blue Xs) and swing lows (marked with red Xs). A swing high is identified when a candle's high is higher than the highs of the candles before and after it. Conversely, a swing low is when a candle's low is lower than the lows of the candles before and after it.
Break of Structure (BOS):
Bullish BOS: This occurs when the price breaks above the swing high level of the previous structure, indicating a potential shift to a bullish trend.
Bearish BOS: This happens when the price breaks below the swing low level of the previous structure, signaling a potential shift to a bearish trend.
Structural Liquidity and Invalidation:
Structural Liquidity: After a break of structure, liquidity levels are updated to the first swing high in a bullish BOS or the first swing low in a bearish BOS.
Structural Invalidation: If the price moves back to the level of the first swing low before the bullish BOS or the first swing high before the bearish BOS, it invalidates the break of structure, suggesting a potential reversal or continuation of the previous trend.
This method provides users with a technical approach to filter market regimes, offering an advantage by minimizing the risk of overfitting to historical data, which is often a concern with traditional indicators like moving averages.
By focusing on identifying pivotal swing points and the subsequent breaks of structure, the strategy maintains a balance between sensitivity to market changes and robustness against historical data anomalies, ensuring a more adaptable and potentially more reliable market analysis tool.
What entry criteria are used in this script?
The script uses two entry models for trading decisions: BreakOut and Fractal.
Underlying Calculations:
Breakout: The script records the most recent swing high by storing it in a variable. When the price closes above this recorded level, and all other predefined conditions are satisfied, the script triggers a breakout entry. This approach is considered conservative because it waits for the price to confirm a breakout above the previous high before entering a trade. As shown in the image, as soon as the price closes above the new candle (first tick), the long entry gets taken. The stop-loss is initially set and then moved to break-even once the price moves in favor of the trade.
Fractal: This method involves identifying a swing low with a period of 2, which means it looks for a low point where the price is lower than the two candles before and after it. Once this pattern is detected, the script executes the trade. This is an aggressive approach since it doesn't wait for further price confirmation. In the image, this is represented by the 'Fractal 2' label where the script identifies and acts on the swing low pattern.
----
How does the script calculate trend score? What are the underlying calculations?
Market Trend Ratio: The script calculates the ratio of bullish to bearish breakouts. This involves:
Counting Bullish Breakouts: A bullish breakout is counted when the price breaks above a recent swing high (as identified in the strategy's market structure analysis).
Counting Bearish Breakouts: A bearish breakout is counted when the price breaks below a recent swing low.
Percentage-Based Score: This ratio is then converted into a percentage-based score:
For example, if there are 10 bullish breakouts and 5 bearish breakouts in a given timeframe, the ratio would be 10:5 or 2:1. This could be translated into a score where 66.67% (10/(10+5) * 100) represents the bullish trend strength.
The score might be calculated as (Number of Bullish Breakouts / Total Breakouts) * 100.
User-Defined Threshold: The strategy uses this score to determine when to take buy entries. If the trend score exceeds a user-defined percentage threshold, it indicates a strong enough bullish trend to justify a buy entry. For instance, if the user sets the threshold at 60%, the script would look for a buy entry when the trend score is above this level.
Timeframe Consideration: The calculations are performed across the timeframes specified by the user, ensuring the trend score reflects the market's behavior over different periods, which could be daily, weekly, or any other relevant timeframe.
This method provides a quantitative measure of market trend strength, helping to make informed decisions based on the balance between bullish and bearish market movements.
What type of stop-loss identification method are used in this strategy?
This strategy employs two types of stop-loss methods: Initial Stop-loss and Trailing Stop-Loss.
Underlying Calculations:
Initial Stop-loss:
ATR Based: The strategy uses the Average True Range (ATR) to set an initial stop-loss, which helps in accounting for market volatility without predicting price direction.
Calculation:
- First, the True Range (TR) is calculated for each period, which is the greatest of:
- Current Period High - Current Period Low
- Absolute Value of Current Period High - Previous Period Close
- Absolute Value of Current Period Low - Previous Period Close
- The ATR is then the moving average of these TR values over a specified period, typically 14 periods by default. This ATR value can be used to set the stop-loss at a distance from the entry price that reflects the current market volatility.
Swing Low Based:
For this method, the stop-loss is set based on the most recent swing low identified in the market structure analysis. This approach uses the lowest point of the recent price action as a reference for setting the stop-loss.
Trailing Stop-Loss:
The strategy uses structural liquidity and structural invalidation levels across multiple timeframes to adjust the stop-loss once the trade is profitable. This method involves:
Detecting Structural Liquidity: After a break of structure, the liquidity levels are updated to the first swing high in a bullish scenario or the first swing low in a bearish scenario. These levels serve as potential areas where the price might find support or resistance, allowing the stop-loss to trail the price movement.
Detecting Structural Invalidation: If the price returns to the level of the first swing low before a bullish break of structure or the first swing high before a bearish break of structure, it suggests the trend might be reversing or invalidating, prompting the adjustment of the stop-loss to lock in profits or minimize losses.
By using these methods, the strategy dynamically adjusts the initial stop-loss based on market volatility, helping to protect against adverse price movements while allowing for enough room for trades to develop. The ATR-based stop-loss adapts to the current market conditions by considering the volatility, ensuring that the stop-loss is not too tight during volatile periods, which could lead to premature exits, nor too loose during calm markets, which might result in larger losses. Similarly, the swing low based stop-loss provides a logical exit point if the market structure changes unfavorably.
Each market behaves differently across various timeframes, and it is essential to test different parameters and optimizations to find out which trailing stop-loss method gives you the desired results and performance. This involves backtesting the strategy with different settings for the ATR period, the distance from the swing low, and how the trailing stop-loss reacts to structural liquidity and invalidation levels.
Through this process, you can tailor the strategy to perform optimally in different market environments, ensuring that the stop-loss mechanism supports the trade's longevity while safeguarding against significant drawdowns.
What type of break-even and take profit identification methods are used in this strategy? What are the underlying calculations?
For Break-Even:
Percentage (%) Based:
Moves the initial stop-loss to the entry price when the price reaches a certain percentage above the entry.
Calculation:
Break-even level = Entry Price * (1 + Percentage / 100)
Example:
If the entry price is $100 and the break-even percentage is 5%, the break-even level is $100 * 1.05 = $105.
Risk-to-Reward (RR) Based:
Moves the initial stop-loss to the entry price when the price reaches a certain RR ratio.
Calculation:
Break-even level = Entry Price + (Initial Risk * RR Ratio)
For TP
- You can choose to set a take profit level at which your position gets fully closed.
- Similar to break-even, you can select either a percentage (%) or risk-to-reward (RR) based take profit level, allowing you to set your TP1 level as a percentage amount above the entry price or based on RR.
What's the day filter Filter, what does it do?
The day filter allows users to customize the session time and choose the specific days they want to include in the strategy session. This helps traders tailor their strategies to particular trading sessions or days of the week when they believe the market conditions are more favorable for their trading style.
Customize Session Time:
Users can define the start and end times for the trading session.
This allows the strategy to only consider trades within the specified time window, focusing on periods of higher market activity or preferred trading hours.
Select Days:
Users can select which days of the week to include in the strategy.
This feature is useful for excluding days with historically lower volatility or unfavorable trading conditions (e.g., Mondays or Fridays).
Benefits:
Focus on Optimal Trading Periods:
By customizing session times and days, traders can focus on periods when the market is more likely to present profitable opportunities.
Avoid Unfavorable Conditions:
Excluding specific days or times can help avoid trading during periods of low liquidity or high unpredictability, such as major news events or holidays.
What tables are available in this script?
- Summary: Provides a general overview, displaying key performance parameters such as Net Profit, Profit Factor, Max Drawdown, Average Trade, Closed Trades and more.
Total Commission: Displays the cumulative commissions incurred from all trades executed within the selected backtesting window. This value is derived by summing the commission fees for each trade on your chart.
Average Commission: Represents the average commission per trade, calculated by dividing the Total Commission by the total number of closed trades. This metric is crucial for assessing the impact of trading costs on overall profitability.
Avg Trade: The sum of money gained or lost by the average trade generated by a strategy. Calculated by dividing the Net Profit by the overall number of closed trades. An important value since it must be large enough to cover the commission and slippage costs of trading the strategy and still bring a profit.
MaxDD: Displays the largest drawdown of losses, i.e., the maximum possible loss that the strategy could have incurred among all of the trades it has made. This value is calculated separately for every bar that the strategy spends with an open position.
Profit Factor: The amount of money a trading strategy made for every unit of money it lost (in the selected currency). This value is calculated by dividing gross profits by gross losses.
Avg RR: This is calculated by dividing the average winning trade by the average losing trade. This field is not a very meaningful value by itself because it does not take into account the ratio of the number of winning vs losing trades, and strategies can have different approaches to profitability. A strategy may trade at every possibility in order to capture many small profits, yet have an average losing trade greater than the average winning trade. The higher this value is, the better, but it should be considered together with the percentage of winning trades and the net profit.
Winrate: The percentage of winning trades generated by a strategy. Calculated by dividing the number of winning trades by the total number of closed trades generated by a strategy. Percent profitable is not a very reliable measure by itself. A strategy could have many small winning trades, making the percent profitable high with a small average winning trade, or a few big winning trades accounting for a low percent profitable and a big average winning trade. Most mean-reversion successful strategies have a percent profitability of 40-80% but are profitable due to risk management control.
BE Trades: Number of break-even trades, excluding commission/slippage.
Losing Trades: The total number of losing trades generated by the strategy.
Winning Trades: The total number of winning trades generated by the strategy.
Total Trades: Total number of taken traders visible your charts.
Net Profit: The overall profit or loss (in the selected currency) achieved by the trading strategy in the test period. The value is the sum of all values from the Profit column (on the List of Trades tab), taking into account the sign.
- Monthly: Displays performance data on a month-by-month basis, allowing users to analyze performance trends over each month and year.
- Weekly: Displays performance data on a week-by-week basis, helping users to understand weekly performance variations.
- UI Table: A user-friendly table that allows users to view and save the selected strategy parameters from user inputs. This table enables easy access to key settings and configurations, providing a straightforward solution for saving strategy parameters by simply taking a screenshot with Alt + S or ⌥ + S.
User-input styles and customizations:
Please note that all background colors in the style are disabled by default to enhance visualization.
How to Use This Strategy to Create a Profitable Edge and Systems?
Choose Your Strategy mode:
- Decide whether you are creating an investing strategy or a trading strategy.
Select a Market:
- Choose a one-sided market such as stocks, indices, or cryptocurrencies.
Historical Data:
- Ensure the historical data covers at least 10 years of price action for robust backtesting.
Timeframe Selection:
- Choose the timeframe you are comfortable trading with. It is strongly recommended to use a timeframe above 15 minutes to minimize the impact of commissions/slippage on your profits.
Set Commission and Slippage:
- Properly set the commission and slippage in the strategy properties according to your broker/prop firm specifications.
Parameter Optimization:
- Use trial and error to test different parameters until you find the performance results you are looking for in the summary table or, preferably, through deep backtesting using the strategy tester.
Trade Count:
- Ensure the number of trades is 200 or more; the higher, the better for statistical significance.
Positive Average Trade:
- Make sure the average trade is above zero.
(An important value since it must be large enough to cover the commission and slippage costs of trading the strategy and still bring a profit.)
Performance Metrics:
- Look for a high profit factor, and net profit with minimum drawdown.
- Ideally, aim for a drawdown under 20-30%, depending on your risk tolerance.
Refinement and Optimization:
- Try out different markets and timeframes.
- Continue working on refining your edge using the available filters and components to further optimize your strategy.
What makes this strategy original?
Incorporation of Fundamental Analysis:
This strategy integrates fundamental analysis by considering key economic indicators such as interest rates, inflation, GDP growth, and unemployment rates. These fundamentals help in assessing the broader economic health, which in turn influences sector performance and market trends. By understanding these economic conditions, the strategy can identify sectors or assets that are likely to thrive, ensuring investments are made in environments conducive to growth. This approach allows for a more informed investment decision, aligning technical entries with fundamentally strong market conditions, thus potentially enhancing the strategy's effectiveness over time.
Technical Analysis Without Classical Methods:
The strategy's technical analysis diverges from traditional methods like moving averages by focusing on market structure through a trend score system.
Instead of using lagging indicators, it employs a real-time analysis of market trends by calculating the ratio of bullish to bearish breakouts. This provides several benefits:
Immediate Market Sentiment: The trend score system reacts more dynamically to current market conditions, offering insights into the market's immediate sentiment rather than historical trends, which can often lag behind real-time changes.
Reduced Overfitting: By not relying on moving averages or similar classical indicators, the strategy avoids the common pitfall of overfitting to historical data, which can lead to poor performance in new market conditions. The trend score provides a fresh perspective on market direction, potentially leading to more robust trading signals.
Clear Entry Signals: With the trend score, entry decisions are based on a clear percentage threshold, making the strategy's decision-making process straightforward and less subjective than interpreting moving average crossovers or similar signals.
Regular Contributions and Reminders:
The strategy encourages regular investments through a system of predefined frequency and amount, which could be weekly, bi-weekly, monthly, quarterly, or yearly. This systematic approach:
Enhances Compounding: Regular contributions leverage the power of compounding, where returns on investments can generate their own returns, potentially leading to exponential growth over time.
Reduces Timing Risk: By investing regularly, the strategy minimizes the risk associated with trying to time the market, spreading out the investment cost over time and potentially reducing the impact of volatility.
Automated Reminders: The script reminds users to make contributions based on their chosen schedule, ensuring consistency and discipline in investment practices, which is crucial for long-term success.
Long-Term Wealth Building:
Focused on long-term wealth accumulation, this strategy:
Promotes Patience and Discipline: By emphasizing regular contributions and a disciplined approach to both entry and risk management, it aligns with the principles of long-term investing, discouraging impulsive decisions based on short-term market fluctuations.
Diversification Across Asset Classes: Operating across crypto, stocks, and commodities, the strategy provides diversification, which is a key component of long-term wealth building, reducing risk through varied exposure.
Growth Over Time: The strategy's design to work with the market's natural growth cycles, supported by fundamental analysis, aims for sustainable growth rather than quick profits, aligning with the goals of investors looking to build wealth over decades.
This comprehensive approach, combining fundamental insights, innovative technical analysis, disciplined investment habits, and a focus on long-term growth, offers a unique and potentially effective pathway for investors seeking to build wealth steadily over time.
Terms and Conditions | Disclaimer
Our charting tools are provided for informational and educational purposes only and should not be construed as financial, investment, or trading advice. They are not intended to forecast market movements or offer specific recommendations. Users should understand that past performance does not guarantee future results and should not base financial decisions solely on historical data.
Built-in components, features, and functionalities of our charting tools are the intellectual property of @Fractalyst Unauthorized use, reproduction, or distribution of these proprietary elements is prohibited.
- By continuing to use our charting tools, the user acknowledges and accepts the Terms and Conditions outlined in this legal disclaimer and agrees to respect our intellectual property rights and comply with all applicable laws and regulations.

Prime Multi-Ticker Screener: Real-Time Market StructurePrime Multi-Ticker Screener: Real-Time Market Structure and Trend Detection Tool
Prime Multi-Ticker Screener is designed to track multiple tickers simultaneously, providing real-time insights into market trends and structure changes such as CHoCH (Change of Character) and BOS (Break of Structure). This tool is perfect for traders looking to monitor multiple assets across different timeframes while receiving clear signals that highlight critical market shifts. The indicator delivers instant visual feedback with color-coded backgrounds to make interpreting signals easy and efficient.
Core Features of Prime Multi-Ticker Screener
Multi-Ticker Monitoring: Track up to 5 tickers across multiple timeframes in a single dashboard. This makes it easy to watch several assets at once without cluttering your chart.
CHoCH and BOS Detection: The screener automatically detects and highlights significant market structure shifts. CHoCH signals are shown when a trend reverses or consolidates, while BOS signals indicate a break in previous highs or lows, helping traders catch potential trend reversals early.
Color-Coded Visuals: The background of each signal cell dynamically changes color to represent bullish or bearish signals. Green indicates bullish activity, while red highlights bearish market shifts, making it easy for traders to identify key movements at a glance.
Close Price and ATR Data: For each ticker, the screener displays both the current close price and the 14-period Average True Range (ATR), providing important volatility information to support decision-making.
Detailed Explanation of How Prime Multi-Ticker Screener Works
Prime Multi-Ticker Screener combines trend detection with real-time market structure analysis to deliver comprehensive market insights. It analyzes the following components:
CHoCH Detection: Change of Character occurs when the market switches from trending to ranging or vice versa. This indicator catches these moments by identifying when prices cross pivot levels, providing traders with a valuable signal of potential market phase changes.
BOS Detection: The Break of Structure function highlights moments when the price breaks a significant high or low, often indicating the start of a new trend or the continuation of an existing one.
Close Price & ATR Monitoring: Alongside market structure signals, the screener provides real-time data on the close price and the Average True Range (ATR), ensuring traders have a complete picture of the price and volatility landscape for each asset they are tracking.
Why It's Useful for Traders
Prime Multi-Ticker Screener is a versatile tool that offers substantial benefits to traders who want to stay informed about multiple assets and trends simultaneously:
Comprehensive Monitoring: Track multiple assets in real time, all from a single indicator. Whether you trade crypto, forex, or stocks, this tool helps you stay on top of market movements across different assets and timeframes.
Market Structure Analysis: The automatic detection of CHoCH and BOS signals gives traders an edge by identifying potential reversals and trend continuations as they happen, allowing for more timely and informed trading decisions.
Efficient and Intuitive Design: The screener is designed with simplicity in mind. The color-coded backgrounds quickly alert traders to market structure shifts without overwhelming them with data, making it ideal for those who need to act fast.
How It Works: Practical Usage
Prime Multi-Ticker Screener is ideal for:
Day traders: The real-time tracking of multiple assets allows day traders to quickly spot trading opportunities across different markets.
Swing traders: CHoCH and BOS detection help swing traders catch key market structure shifts, helping them align trades with emerging trends.
Trend followers: The screener provides instant feedback on when a trend is continuing or breaking, helping trend-following traders maintain their positions or exit early when needed.
By combining multiple key metrics—price, volatility, and market structure—Prime Multi-Ticker Screener ensures traders are well-equipped to manage their positions across a variety of assets.
Risk Disclaimer
While Prime Multi-Ticker Screener provides valuable market insights, it's important to remember:
Past performance is not indicative of future results: This screener provides analysis based on historical data, and no indicator can predict future market movements with certainty.
Market Conditions: The effectiveness of Prime Multi-Ticker Screener may vary in different market conditions, so traders should always use proper risk management when trading.
Trading Risks: Like any trading tool, Prime Multi-Ticker Screener should be used as part of a comprehensive trading strategy, including risk management techniques such as stop-loss orders and position sizing.
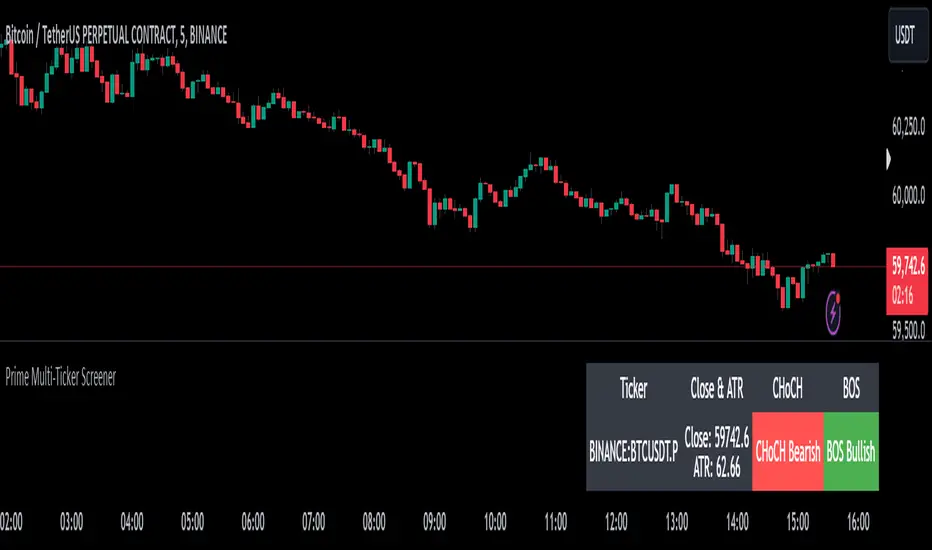
Mxwll Price Action Suite [Mxwll]Introducing the Mxwll Price Action Suite!
The Mxwll Price Action Suite is an all-in-one analysis indicator incorporating elements of SMC and also ideas extending beyond the trading methodology!
Features
Internal structures
External structures
Customizable Sensitivities
BoS/CHoCH
Order Blocks
HH/LH/LL/LH Areas
Rolling TF highs/lows
Rolling Volume Comparisons
Auto Fibs
And more!
The image above shows the indicator's market structure identification capabilities. Internal BoS and CHoCH structures in addition to overarching market structures are available with customizable sensitivities.
The image above shows the indicator identifying order blocks! Additionally, HH/LH/LL/LH areas are also identified.
The image above shows a rolling area of interest. These areas can be compared to supply/demand zones, where traders might consider a bargain long/short/sell area.
The indicator displays a rolling 4hr high/low and 1D high/low, alongside auto fibonacci levels with a customizable sensitivity.
Finally, the Mxwll Price Action Suite shows relevant session information.
Table information
Current Session
Countdown to session close
Next Session
Countdown to next session open
Rolling 4-Hr volume intensity
Rolling 24-Hr volume intensity
Introducing the Mxwll SMC Suite!
The Mxwll SMC Suite is an all-in-one analysis indicator incorporating elements of SMC and also ideas extending beyond the trading methodology!
Features
Internal structures
External structures
Customizable Sensitivities
BoS/CHoCH
Order Blocks
HH/LH/LL/LH Areas
Rolling TF highs/lows
Rolling Volume Comparisons
Auto Fibs
And more!
The image above shows the indicator's market structure identification capabilities. Internal BoS and CHoCH structures in addition to overarching market structures are available with customizable sensitivities.
The image above shows the indicator identifying order blocks! Additionally, HH/LH/LL/LH areas are also identified.
The image above shows a rolling area of interest. These areas can be compared to supply/demand zones, where traders might consider a bargain long/short/sell area.
The indicator displays a rolling 4hr high/low and 1D high/low, alongside auto fibonacci levels with a customizable sensitivity.
Finally, the Mxwll Price Action Suite shows relevant session information.
Table information
Current Session
Countdown to session close
Next Session
Countdown to next session open
Rolling 4-Hr volume intensity
Rolling 24-Hr volume intensity
Expanded Features of Mxwll Price Action Suite
Internal and External Structures
Internal Structures: These elements refer to the price formations and patterns that occur within a smaller scope or a specific trading session. The suite can detect intricate details like minor support/resistance levels or short-term trend reversals.
External Structures: These involve larger, more significant market patterns and trends spanning multiple sessions or time frames. This capability helps traders understand overarching market directions.
Customizable Sensitivities
Adjusting sensitivity settings allows users to tailor the indicator's responsiveness to market changes. Higher sensitivity can catch smaller fluctuations, while lower sensitivity might focus on more significant, reliable market moves.
Break of Structure (BoS) and Change of Character (CHoCH)
BoS: This feature identifies points where the price breaks a significant structure, potentially indicating a new trend or a trend reversal.
CHoCH: Detects subtle shifts in the market's behavior, which could suggest the early stages of a trend change before they become apparent to the broader market.
Order Blocks and Market Phases
Order Blocks: These are essentially price levels or zones where significant trading activities previously occurred, likely pointing to the positions of smart money.
HH/LH/LL/LH Areas: Identifying Higher Highs (HH), Lower Highs (LH), Lower Lows (LL), and Lower Highs (LH) helps in understanding the trend and market structure, aiding in predictive analysis.
Rolling Timeframe Highs/Lows and Volume Comparisons
Tracks highs and lows over specified rolling periods, providing dynamic support and resistance levels.
Compares volume data across different timeframes to assess the strength or weakness of the current price movements.
Auto Fibonacci Levels
Automatically calculates and plots Fibonacci retracement levels, a popular tool among traders to identify potential reversal points based on past movements.
Session Data and Volume Intensity
Session Information: Displays current and upcoming trading sessions along with countdown timers, which is crucial for day traders and those trading on session overlaps.
Volume Intensity: Measures and compares the volume within the last 4 hours and 24 hours to gauge market activity and potential breakout/breakdown movements.
Visualizations and Practical Use
Dynamic Visuals: The suite provides dynamic visual aids, such as real-time updating of high/low markers and Fibonacci levels, which adjust as new data comes in. This feature is critical in fast-paced markets.
Strategic Entry/Exit Points: By identifying order blocks and using Fibonacci levels, traders can pinpoint strategic entry and exit points, maximizing potential returns.
Risk Management: Enhanced features like session countdowns and volume intensity help in better risk management by providing traders with more data on market sentiment and potential volatility.

BigBeluga - BacktestingThe Backtesting System (SMC) is a strategy builder designed around concepts of Smart Money.
What makes this indicator unique is that users can build a wide variety of strategies thanks to the external source conditions and the built-in one that are coded around concepts of smart money.
🔶 FEATURES
🔹 Step Algorithm
Crafting Your Strategy:
You can add multiple steps to your strategy, using both internal and external (custom) conditions.
Evaluating Your Conditions:
The system evaluates your conditions sequentially.
Only after the previous step becomes true will the next one be evaluated.
This ensures your strategy only triggers when all specified conditions are met.
Executing Your Strategy:
Once all steps in your strategy are true, the backtester automatically opens a market order.
You can also configure exit conditions within the strategy builder to manage your positions effectively.
🔹 External and Internal build-in conditions
Users can choose to use external or internal conditions or just one of the two categories.
Build-in conditions:
CHoCH or BOS
CHoCH or BOS Sweep
CHoCH
BOS
CHoCH Sweep
BOS Sweep
OB Mitigated
Price Inside OB
FVG Mitigated
Raid Found
Price Inside FVG
SFP Created
Liquidity Print
Sweep Area
Breakdown of each of the options:
CHoCH: Change of Character (not Charter) is a change from bullish to bearish market or vice versa.
BOS: Break of Structure is a continuation of the current trend.
CHoCH or BOS Sweep: Liquidity taken out from the market within the structure.
OB Mitigated: An order block mitigated.
FVG Mitigated: An imbalance mitigated.
Raid Found: Liquidity taken out from an imbalance.
SFP Created: A Swing Failure Pattern detected.
Liquidity Print: A huge chunk of liquidity taken out from the market.
Sweep Area: A level regained from the structure.
Price inside OB/FVG: Price inside an order block or an imbalance.
External inputs can be anything that is plotted on the chart that has valid entry points, such as an RSI or a simple Supertrend.
Equal
Greather Than
Less Than
Crossing Over
Crossing Under
Crossing
🔹 Direction
Users can change the direction of each condition to either Bullish or Bearish. This can be useful if users want to long the market on a bearish condition or vice versa.
🔹 Build-in Stop-Loss and Take-Profit features
Tailoring Your Exits:
Similar to entry creation, the backtesting system allows you to build multi-step exit strategies.
Each step can utilize internal and external (custom) conditions.
This flexibility allows you to personalize your exit strategy based on your risk tolerance and trading goals.
Stop-Loss and Take-Profit Options:
The backtesting system offers various options for setting stop-loss and take-profit levels.
You can choose from:
Dynamic levels: These levels automatically adjust based on market movements, helping you manage risk and secure profits.
Specific price levels: You can set fixed stop-loss and take-profit levels based on your comfort level and analysis.
Price - Set x point to a specific price
Currency - Set x point away from tot Currency points
Ticks - Set x point away from tot ticks
Percent - Set x point away from a fixed %
ATR - Set x point away using the Averge True Range (200 bars)
Trailing Stop (Only for stop-loss order)
🔶 USAGE
Users can create a variety of strategies using this script, limited only by their imagination.
Long entry : Bullish CHoCH after price is inside a bullish order block
Short entry : Bearish CHoCH after price is inside a bearish order block
Stop-Loss : Trailing Stop set away from price by 0.2%
Example below using external conditions
Long entry : Bullish Liquidity Prints after bullish CHoCH
Short entry : Bearish Liquidity Prints after Bearish CHoCH
Long Exit : RSI Crossing over 70 line
Short Exit : RSI Crossing over 30 line
Stop-Loss : Trailing Stop set away from price by 0.3%
🔶 PROPERTIES
Users will need to adjust the property tabs according to their individual balance to achieve realistic results.
An important aspect to note is that past performance does not guarantee future results. This principle should always be kept in mind.
🔶 HOW TO ACCESS
You can see the Author Instructions to get access.
Script a pagamento

Break of Structure with trend table by GadatasThis indicator is designed to identify and track swing highs and lows in a given market on chart timeframe. It plots these swing highs and lows as solid lines on the chart. The indicator allows for customization of the line color and width. The selected timeframe trend is visually represented in a table located in the upper right corner of the chart. To enhance consistency, the background color of the timeframe column now elegantly matches the color of the BOS line.
The indicator follows specific rules to determine when a new high or low is created. If the current range is considered bullish (meaning the most recent breakout was to the topside), the indicator will only update the low if a candle's body falls below the current low. However, if the current range is bearish (most recent breakout to the downside), the indicator will only update the high if a candle's body rises above the current high.
When a range is identified as bullish, the indicator will continue updating the high until a swing high is formed, denoting the high of the range. The high will only change if a candle's body surpasses the previous high. The low, on the other hand, will be updated based on the last time a candle's body falls below a previous candle's low. The lowest low after this condition is met will be assigned as the low of the range.
Conversely, when a range is identified as bearish, the indicator will continue updating the low until a swing low is formed, denoting the low of the range. The low will only change if a candle's body falls below the previous low. The high, in this case, will be updated based on the last time a candle's body rises above a previous candle's high. The highest high after this condition is met will be assigned as the high of the range.
Swing highs are determined by having lower highs to the left and right, while swing lows have higher lows to the left and right. These swings are used to determine the final high or low of a bullish or bearish range, respectively.
Tis Indicator differs from other indicators by incorporating this concept to track market structure. The indicator assumes that significant market players sell before making heavy purchases in bullish ranges and buy before selling heavily in bearish ranges. The lines on the chart represent prior highs and lows, as well as the current updated highs and lows based on this theory. By using this indicator, one can gain insights into the structure of price movement and potentially identify bullish or bearish continuations. It can also provide confluence when analyzing multiple timeframes to validate trend-following strategies.
Open-source script.
It now displays both short and long condition changes along with their respective arguments:
1. In the case of a high Bos line break followed by a fall, a very long condition change is made when at least three breaks of Bos Low are observed, transitioning from very short to short then distribution , and after that to long.
2. Short conditions are indicated when a high Bos falls and the condition changes from very long to long and then accumulation, short, and very short with each break.
Additionally, the break counter column now shows positive numbers for long situations, indicating each low Bos break, and negative numbers for short situations, indicating each high Bos break.
The background color of the break counter column now changes to green for positive numbers and red for negative numbers.

Smart Money Concepts (SMC) [LuxAlgo]This all-in-one indicator displays real-time market structure (internal & swing BOS / CHoCH), order blocks, premium & discount zones, equal highs & lows, and much more...allowing traders to automatically mark up their charts with widely used price action methodologies. Following the release of our Fair Value Gap script, we received numerous requests from our community to release more features in the same category.
"Smart Money Concepts" (SMC) is a fairly new yet widely used term amongst price action traders looking to more accurately navigate liquidity & find more optimal points of interest in the market. Trying to determine where institutional market participants have orders placed (buy or sell side liquidity) can be a very reasonable approach to finding more practical entries & exits based on price action.
The indicator includes alerts for the presence of swing structures and many other relevant conditions.
Features
This indicator includes many features relevant to SMC, these are highlighted below:
Full internal & swing market structure labeling in real-time
Break of Structure (BOS)
Change of Character (CHoCH)
Order Blocks (bullish & bearish)
Equal Highs & Lows
Fair Value Gap Detection
Previous Highs & Lows
Premium & Discount Zones as a range
Options to style the indicator to more easily display these concepts
Settings
Mode: Allows the user to select Historical (default) or Present, which displays only recent data on the chart.
Style: Allows the user to select different styling for the entire indicator between Colored (default) and Monochrome.
Color Candles: Plots candles based on the internal & swing structures from within the indicator on the chart.
Internal Structure: Displays the internal structure labels & dashed lines to represent them. (BOS & CHoCH).
Confluence Filter: Filter non-significant internal structure breakouts.
Swing Structure: Displays the swing structure labels & solid lines on the chart (larger BOS & CHoCH labels).
Swing Points: Displays swing points labels on chart such as HH, HL, LH, LL.
Internal Order Blocks: Enables Internal Order Blocks & allows the user to select how many most recent Internal Order Blocks appear on the chart.
Swing Order Blocks: Enables Swing Order Blocks & allows the user to select how many most recent Swing Order Blocks appear on the chart.
Equal Highs & Lows: Displays EQH/EQL labels on chart for detecting equal highs & lows.
Bars Confirmation: Allows the user to select how many bars are needed to confirm an EQH/EQL symbol on chart.
Fair Value Gaps: Displays boxes to highlight imbalance areas on the chart.
Auto Threshold: Filter out non-significant fair value gaps.
Timeframe: Allows the user to select the timeframe for the Fair Value Gap detection.
Extend FVG: Allows the user to choose how many bars to extend the Fair Value Gap boxes on the chart.
Highs & Lows MTF: Allows the user to display previous highs & lows from daily, weekly, & monthly timeframes as significant levels.
Premium/Discount Zones: Allows the user to display Premium, Discount, and Equilibrium zones on the chart
Usage
Users can see automatic CHoCH and BOS labels to highlight breakouts of market structure, which allows to determine the market trend. In the chart below we can see the internal structure which displays more frequent labels within larger structures. We can also see equal highs & lows (EQH/EQL) labels plotted alongside the internal structure to frequently give indications of potential reversals.
In the chart below we can see the swing market structure labels. These are also labeled as BOS and CHoCH but with a solid line & larger text to show larger market structure breakouts & trend reversals. Users can be mindful of these larger structure labels while trading internal structures as displayed in the previous chart.
Order blocks highlight areas where institutional market participants open positions, one can use order blocks to determine confirmation entries or potential targets as we can expect there is a large amount of liquidity at these order blocks. In the chart below we can see 2 potential trade setups with confirmation entries. The path outlined in red would be a potential short entry targeting the blue order block below, and the path outlined in green would be a potential long entry, targeting the red order blocks above.
As we can see in the chart below, the bullish confirmation entry played out in this scenario with the green path outlined in hindsight. As price breaks though the order blocks above, the indicator will consider them mitigated causing them to disappear, and as per the logic of these order blocks they will always display 5 (by default) on the chart so we can now see more actionable levels.
The Smart Money Concepts indicator has many other features and here we can see how they can also help a user find potential levels for price action trading. In the screenshot below we can see a trade setup using the Previous Monthly High, Strong High, and a Swing Order Block as a stop loss. Accompanied by the Premium from the Discount/Premium zones feature being used as a potential entry. A potential take profit level for this trade setup that a user could easily identify would be the 50% mark labeled with the Fair Value Gap & the Equilibrium all displayed automatically by the indicator.
Conclusion
This indicator highlights all relevant components of Smart Money Concepts which can be a very useful interpretation of market structure, liquidity, & more simply put, price action. The term was coined & popularized primarily within the forex community & by ICT while making its way to become a part of many traders' analysis. These concepts, with or without this indicator do not guarantee a trader to be trading within the presence of institutional or "bank-level" liquidity, there is no supporting data regarding the validity of these teachings.

Investment Boat(Yatırım Botu)English:
The investment bot plugin works according to past 90 bar(candle) statistics. It shows goals that you can use to detect cheap products and products that you buy that you can easily sell. Invest bot add-on at the best price 1 (2 (Method:) to apply the technique of buying piece by piece, or the price becomes cheaper as it increases the amount of the purchase, make an average near the bottom, and opportunity all at once and decreases capital input blocks missing bottom: method of capture: the product helps to obtain.
Features:
The investment bot does not trade for you, it informs you at the most convenient times, purchases are made manually.
By automating all reviews of the product you want to review, it eliminates the human and error factor that doesn't leave a feature you forgot to review.
According to past statistics, it examines whether the price of the product being studied is suitable for profit, you can instantly determine which product is cheaper, and avoid getting caught up in FOMO.
Shows the correct Trading Method to be made in the trend determined by Trend Tracking. (Hold in rising trend, buy - sell in horizontal trend, buy opportunity in falling trend)
It shows Trend turns with colored candles and you get push notifications in important areas when the alarm is set. This feature is very important, it helps you capture the product from the bottom and continue the process by moving your stop level.
According to Old statistics examined when collecting and selling goods, it shows possible price return zones where you can easily buy and sell the product with red(buy) and green(sell) lines.
You may receive notifications in overbought and sold zones. Even if you don't follow the important price movements associated with the product with the alarm when you install an Alarm, you know that your eyes will not stay behind.
Keep the plugin to yourself with customizable settings.
Method 1:
The investment bot piecemeal purchase technique plugin scores between 0 and 6 based on the price of the product; 3x, 5x. Let's think of the X value as $ 100. It looks like a $ 500 transaction will open for 3x points, 300 points, 5x points. thanks to purchases made using the piecemeal purchase technique, you provide an average price close to the lower price of the product that returns from the bottom. A 0x score indicates that this product is not suitable for medium-and long-term purchases, its price is expensive, but it is your job to green lines hit-and-run operations.
Example usage: we decided to buy Bitcoin we want to buy Bitcoin we divide the capital you set aside to buy Bitcoin into 21 parts (1x+2x+3x+4x+5x+6x=21x) if Bitcoin were at the current 3x level (3x+4x+5x=12x) we would divide it into 12 parts. Our initial purchase support and resistance lines after raising the price if the price rises, we thought we would make a left turn at the profit level we made, but it could be pulled down if it goes according to the price level we continue to add, in the process of adding each, when adding the product, to give a signal to return the price if we don't. Sometimes it can drop from 2 to 3 levels without adding products skipped level we can shop by adding your purchases to the current level you have decided. If you have collected enough products, all that remains is to wait for the rise, so you can collect the investment you have created from the appropriate levels, piece by piece or wholesale, at targets indicated by Green lines created according to the old statistics. Don't forget to make a profit.
Method 2:
The yellow candle and purple candle that come in trend turns indicate the most accurate times for us to get in and out of the process. The price is to see the yellow candle, we get the product from here and immediately between 1-3% here now the goal is that if the circuit does not occur and the drop will be lower, we catch the product from the bottom, but thanks to the product caught from the bottom, we can not stop a few times until this return to get the product out of the process, when there should be a stop under the yellow candle, stop losses that turn from the bottom area are very easily compensated. After you purchase the product, a rising trend if the trend breaks the current trend continues to fall, if the process exits, but does not continue to decline-a trend we expect to see goals worsen purple candle purple candle means to sell, but when we see these purple candles, how much you sell doesn't mean we're going to stop level under the purple candle, cheap and easy to buy products we don't sell if the rising trend continues, we are constantly moving under the purple candle to the stop level. You get maximum profit at the end of the transaction, but sometimes Future fake moves and needles will cause you to stop unnecessarily, unfortunately there is no solution or measure for this.
Warning: the investment bot plugin aims to shop at the right time, but before buying, supports must be withdrawn, it must be verified that the price does not fall only to act according to the plugin and to trade non-stop (even when collecting goods 10-20% should be placed, even better than losing 70-80% in possible large falls) is wrong. Depending on the chart time you use, the results calculated by the plugin may vary, and smaller time statistics give less reliable results.
Türkçe:
Yatırım Botu eklentisi geçmiş 90 bar(mum) istatistiklerine göre çalışmaktadır. Ucuzlayan ürünleri tespit etmek için kullanabileceğiniz gibi aldığınız ürünleri rahatça satabileceğiniz hedefleri de göstermektedir. Yatırım Botu eklentisi size tepeden ürün aldırmaz ürünü en uygun fiyattan alabilmeniz için (Yöntem 1:) parçalı alım tekniği uygulamanıza yada (Yöntem 2:) dip yakalamanıza yardımcı olur: Fiyat ucuzladıkça alım miktarını arttırarak ortalamanızın dibe yakın olmasını sağlar ayrıca tüm sermayeniz ile tek seferde girip düşüşlerde fırsatları kaçırmanıza engel olur.
Özellikleri:
Yatırım Botu sizin yerinize alım satım yapmaz en uygun zamanlarda sizi bilgilendirir, alımlar manuel yapılır.
İncelenmek istenen ürün ile ilgili tüm incelemeleri otomatik yaparak incelemeyi unuttuğunuz bir özellik bırakmaz insan ve hata faktörünü ortadan kaldırır.
İncelenen ürün fiyatının kazanç elde edilebilmesi için uygun durumda olup olmadığını geçmiş istatistiklere göre inceler hangi ürünün daha fazla ucuzladığını anında tespit edebilirsiniz, FOMO'ya kapılmanızın önüne geçer tepeden malı elinize veremezler.
Trend takibi ile tespit edilen trend'te yapılması doğru olan trade yöntemini gösterir. (Yükselen Trend'te Alınan Tutulur, Yatay Trend'te Al - Sat, Düşen Trend'te ise Fırsat Alımı)
Trend dönüşlerini renkli mumlar ile gösterir ve alarm kurulduğunda önemli bölgelerde anlık bildirimler alırsınız. Bu özellik çok önemlidir ürünü en dipten yakalamanıza ve stop seviyenizi taşıyarak işleme devam etmenize yardımcı olur.
Mal toplarken ve satarken incelenen eski istatistiklere göre ürünü kolayca alabileceğiniz ve satabileceğiniz muhtemel fiyat dönüş bölgelerini kırmızı(alış) ve yeşil(satış) çizgiler ile gösterir.
Aşırı alım ve satım bölgelerinde bildirim alabilirsiniz. Alarm kurduğunuzda alarm bulunan ürün ile ilgili önemli fiyat hareketlerini takip etmeseniz bile bilirsiniz, gözünüz arkada kalmaz.
Özelleştirilebilir ayarlar ile eklentiyi kendinize uydurun.
Yöntem 1:
Yatırım Botu Parçalı Alım Tekniği Eklentisi ürünün fiyatına bakarak ucuzlama durumunu 0 ile 6 arasında puanlar; 3x, 5x gibi. X değerini 100 dolar olarak düşünelim. 3x olan puana 300 dolarlık 5x olan puana 500 dolarlık işlem açılacak gibi. Parçalı alım tekniği ile yapılan alımlar sayesinde fiyatı dipten dönen ürünün dip fiyatına yakın bir ortalama sağlarsınız. 0x puanı o ürünün orta uzun vade alım için uygun olmadığını fiyatının pahalı olduğunu gösterir ancak yeşil hedeflere kadar vur kaç işlemleri yapmak sizin bileceğiniz iştir.
Örnek Kullanım: Bitcoin almaya karar verdik alım yapmak istiyoruz Bitcoin almak için ayırdığınız sermayeyi 21 parçaya bölüyoruz (1x+2x+3x+4x+5x+6x=21x) eğer Bitcoin şuan 3x alınabilir seviyede olsaydı (3x+4x+5x=12x) 12 parçaya bölecektik. İlk alımımızı destek ve direnç çizgilerini çektikten sonra fiyatın yukarı dönüş yapacağını düşündüğümüz seviyeden yapıyoruz fiyat yukarı giderse hemen kar ediyoruz ancak oldu da aşağı giderse alınabilir fiyat seviyelerine göre ekleme yapmaya devam ediyoruz her ekleme işlemi yapılırken fiyatın yukarı dönüş için bir sinyal vermesi şart ürün düşerken ekleme yapmıyoruz. Bazen ürün biz ekleme yapmadan 2 3 seviye birden düşebilir burada karar sizin atlanan seviye alımlarını mevcut seviyeye ekleyerek alım yapabilirsiniz. Yeterince ürün topladıysanız geriye sadece yükselişi beklemek kalır uygun seviyelerden toplayarak oluşturduğunuz yatırımı eski istatistiklere göre oluşturulan Yeşil Çizgilerle gösterilen hedeflerde parça parça yada toptan satabilirsiniz. Kar almayı ihmal etmeyin.
Yöntem 2:
Trend dönüşlerinde gelen sarı mum ve mor mum işleme girmemiz ve çıkmanız için en doğru zamanları gösterir. Sarı mum'u gördüğünüzde fiyat dip bölgesinden dönüş yapıyordur ürünü buradan alır ve hemen sarı mum altına stop koyarız %1-3 arasında olmalı daha fazla değil burada amaç eğer dönüş gerçekleşmez ve düşüş devam ederse işlemden çıkıp ürünü daha aşağıda gerçekleşecek dönüşten tekrar almaktır, ürünü dipten yakalayana kadar birkaç sefer stop olabiliriz ancak dipten yakalanan ürün sayesinde stop zararları çok rahat telafi edilmektedir. Ürünü aldıktan sonra bulunduğumuz trend yükselen bir trend ise kolay al-sat hedeflerinde ürünü ucuza satmıyoruz mor mum görmeyi bekliyoruz mor mum trend'in bozulabileceği anlamını taşıyor ancak kesin bozulacak elindekini sat kaç demek değildir bu nedenle mor mum'u gördüğümüzde stop seviyemizi mor mum altına taşıyoruz trend bozulur düşüş devam ederse işlemden çıkmış oluyoruz ancak düşüş devam etmez yükselen trend devam ederse stop seviyemizi sürekli mor mum altına taşıyarak ilerliyoruz. Sonunda maximum kar alarak işlemden çıkıyoruz ancak bazen gelecek fake hareketler ve iğneler gereksiz stop olmanıza neden olacaktır bunun bir çözümü yada önlemi yok malesef.
Uyarı: Yatırım Botu eklentisi doğru zamanlarda alım yaptırmayı amaçlar ancak alım yapmadan önce destekler çizilmeli fiyatın aşağı gitmediği onaylanmalıdır sadece eklentiye göre hareket etmek ve stopsuz işlem yapmak (Mal toplarken dahi %10-20 aşağıya bile olsa mutlaka konulmalıdır olası büyük düşüşlerde %70-80 kaybetmekten iyidir) yanlıştır. Kullandığınız grafik zamanına göre eklentinin hesapladığı sonuçlar değişebilir, küçük zaman istatistikleri daha az güvenilir sonuçlar verir.

TopTenAlgo 6. Trading IndexEN: Trend & Trading Index Oscillator is an indicator developed using Stochastic which makes your day trading easier. Is it to measure price swings with a more sensitive and close to zero error margin, and is the price movement and the direction of the trend compatible? is the ideal guide to look at. The oscillator consists of a 5 step system. Depressions below -0.85 are measured to determine the intake region (Lowlander 2) at the bottom of the step. At the top of the step, enthusiastic movements above 0.90 are detected to determine the sales region(Highlander 2). The buffer zone is the BALANCE "0" zone and its highlander "0. 40 zone close to enthusiasm, and the Lowlander "-0.50" zone close to depression.
This algorithm is prepared with @Top10Algo ... Study modify...
TR: Trend & Trading Index Osiatörü Stochastic kullanırak geliştirilen ve gün içi al satlarınızı kolaylaştıran bir göstergedir. Fiyat salınımlarını daha hassas ve sıfıra yakın bir hatalama payıyla ölçmek ve fiyat hareketi ile trendin yönü uyumlu mu? bakmak için en ideal yol göstericidir. Osilatör 5 basamaklı bir sistemden oluşmaktadır. Basamağın en altında alım bögesini belirlemek için -0.85 değerinin altındaki depresyonlar(Lowlander 2) ölçülür. Basamağın en üstünde ise satış bölgesini belirlemek için 0.90 değerinin üstündeki coşkulu hareketler (Highlander 2) tespit edilir. Ara bölge ise BALANCE “0” bögesi ve onun coşkuya yakın Highlander 1 “0.40" bölgesi ile depresyona yakın Lowlander 1 “-0.50" bölgesi yer alır.
Bu algoritma @Top10Algo ile beraber hazırlanmıştır... Çalışma Prensipleri modifiye edildi...

LuxAlgo® - Price Action Concepts™Price Action Concepts™ is a first of it's kind all-in-one indicator toolkit which includes various features specifically based on pure price action.
Order Blocks w/ volume data, real-time market structure (BOS, CHoCH, EQH/L) w/ 'CHoCH+' being a more confirmed reversal signal, a MTF dashboard, Trend Line Liquidity Zones (real-time), Chart Pattern Liquidity Zones, Liquidity Grabs, and much more detailed customization to get an edge trading price action automatically.
Many traders argue that trading price action is better than using technical indicators due to lag, complexity, and noisy charts. Popular ideas within the trading space that cater towards price action trading include "trading like the banks" or "Smart Money Concepts trading" (SMC), most prominently known within the forex community.
What differentiates price action trading from others forms of technical analysis is that it's main focus is on raw price data opposed to creating values or plots derived from price history.
Mostly all of the features within this script are generated purely from price action, more specifically; swing highs, swing lows, and market structure... which allows users to automate their analysis of price action for any market / timeframe.
🔶 FEATURES
This script includes many features based on Price Action; these are highlighted below:
Market structure (BOS, CHoCH, CHoCH+, EQH/L) (Internal & Swing) multi-timeframe
Volumetric Order Blocks & mitigation methods (bullish & bearish)
Liquidity Concepts
Trend Line Liquidity Zones
Chart Pattern Liquidity
Liquidity Grabs Feature
Imbalance Concepts MTF w/ multiple mitigation methods
Fair Value Gaps
Balanced Price Range
Activity Asymmetry
Strong/Weak Highs & Lows w/ volume percentages
Premium & Discount Zones included
Candle Coloring based on market structure
Previous Highs/Lows (Daily, Monday's, Weekly, Monthly, Quarterly)
Multi-Timeframe Dashboard (15m, 1h, 4h, 1d)
Built-in alert conditions & Any Alert() Function Call Conditions
Advanced Alerts Creator to create step-by-step alerts with various conditions
+ more (see changelog below for current features)
🔶 BASIC DEMONSTRATION
In the image above we can see a demonstration of the market structure labeling within this indicator. The automatic BOS & CHoCH labels on top of dashed lines give clear indications of breakouts & reversals within the internal market structure (short term price action). The "CHoCH+" label is also demonstrated as it triggers only if price has already made a new higher low, or lower high.
We can also see a solid line with a larger BOS label in the middle of the chart. This label demonstrates a break of structure taking into account the swing market structure (longer term price action). All of these labels are generated in real-time.
🔶 USAGE & EXAMPLES
In the image below we can see how a trade setup could be created using Order Blocks w/ volume metrics to find points of interest in the market, swing / internal market structure to get indications of longer & shorter term reversals, and trend line liquidity zones to find more likely impulses & breakouts within trends.
We can see in the next image below that price came down to the highest volume order block marked out previously as our point of interest for an entry used in confluence with the overall market structure being bullish (swing CHoCH). Due to price closing below the middle Order Block at (24.77%), we saw it was mitigated, and then price revisited liquidity above the Trend Line zone above, leading us to the first Order Block as a target.
You will notice the % values adjust as Order Blocks are touched & mitigated, aligning with the correct volume detected when the Order Block was established.
In the image below we can see more features from within Price Action Concepts™ indicator, including Chart Pattern Liquidity, Fair Value Gaps (one of many Imbalance Concepts), Liquidity Grabs, as well as the primary market structures & OBs.
By using multiple features as such, users can develop a greater interpretation of where liquidity rests in the market, which allows them to develop trading plans a lot easier. Liquidity Grabs are highlighted as blue/red boxes on the wicks during specific price action that indicates the market has made an impulse specifically to take out resting buy or sell side orders.
We can notice in the trade demonstrated below (hindsight example) how price often moves to the areas of the most liquidity, even if unexpected according to classical technical analysis performed by retail traders such as chart patterns. Wicks to take out orders above & potentially trap traders are much more noticeable with features such as these.
The Chart Patterns which can be detected include:
Ascending/Descending Wedges (Asc/Desc Wedge)
Ascending/Descending Broadening Wedges (Asc/Desc BW)
Ascending/Descending/Symmetrical Triangles (Asc/Desc/Sym Triangle)
Double Tops/Bottoms (Double Top/Double BTM)
Head & Shoulders (H&S)
Inverted Head & Shoulders (IH&S)
General support & resistance during undetected patterns
In the image below we can see more features from within the indicator, including Balanced Price Range (another imbalance method similar to FVG), Market Structure Candle Coloring, Accumulation & Distribution zones, Premium & Discount zones w/ a percentage on each zone, the MTF dashboard, as well as the Previous Daily Highs & Lows (one of many highs/lows) displayed on the chart automatically.
The colored candles use more specific market structure analysis, specifically allowing users to visualize when trends are considered "normal" or "strong". By utilizing other features alongside this market structure analysis, such as noticing price retesting the PDL level + the Equilibrium as resistance, a Balanced Price Range below price, the discount with a high 72% metric, and the MTF dashboard displaying an overall bearish structure...
...users can instantly gain a deeper interpretation of price action, make highly confluent trading plans while avoiding classical technical indicators, and use traditional retail trading concepts such as chart patterns / trend lines to their advantage in finding logical areas of liquidity & points of interest in the market.
The image below shows the previous chart zoomed in with 2 liquidity concepts re-enabled & used alongside a new range targeting the same Discount zone.
🔶 SETTINGS
Market Structure Internal: Allows the user to select which internal structures to display (BOS, CHoCH, or None).
Market Structure Swing: Allows the user to select which swing structures to display (BOS, CHoCH, or None).
MTF Scanner: See market structure on various timeframes & how many labels are active consecutively.
Equal Highs & Lows: Displays EQH / EQL labels on chart for detecting equal highs & lows.
Color Candles: Plots candles based on the internal & swing structures from within the indicator on the chart.
Order Blocks Internal: Enables Internal Order Blocks & allows the user to select how many most recent Internal Order Blocks appear on the chart as well as select a color.
Order Blocks Swing: Enables Swing Order Blocks & allows the user to select how many most recent Swing Order Blocks appear on the chart as well as select a color.
Mitigation Method: Allows the user to select how the script mitigates an Order Block (close, wick, or average).
Internal Buy/Sell Activity: Allows the user to display buy/sell activity within Order Blocks & decide their color.
Show Metrics: Allows the user to display volume % metrics within the Order Blocks.
Trend Line Liquidity Zones: Allows the user to display Trend Line Zones on the chart, select the number of Trend Lines visible, & their colors.
Chart Pattern Liquidity: Allows the user to display Chart Patterns on the chart, select the significance of the pattern detection, & their colors.
Liquidity Grabs: Allows the user to display Liquidity Grabs on the chart.
Imbalance Concepts: Allows the user to select the type of imbalances to display on the chart as well as the styling, mitigation method, & timeframe.
Auto FVG Threshold: Filter out non-significant fair value gaps.
Premium/ Discount Zones: Allows the user to display Premium, Discount , and Equilibrium zones on the chart
Accumulation / Distribution: Allows the user to display accumulation & distribution consolidation zones with an optional Consolidation Zig-Zag setting included.
Highs/Lows MTF: Displays previous highs & lows as levels on the chart for the previous Day, Monday, Week, Month, or quarter (3M).
General Styling: Provides styling options for market structure labels, market structure theme, and dashboard customization.
Any Alert() Function Call Conditions: Allows the user to select multiple conditions to use within 1 alert.
🔶 CONCLUSION
Price action trading is a widely respected method for its simplicity & realistic approach to understanding the market itself. Price Action Concepts™ is an extremely comprehensive product that opens the possibilities for any trader to automatically display useful metrics for trading price action with enhanced details in each. While this script is useful, it's critical to understand that past performance is not necessarily indicative of future results and there are many more factors that go into being a profitable trader.
🔶 HOW TO GET ACCESS
You can see the Author's instructions below to get instant access to this indicator & our premium suite.
🟡 GOLD 4H HUD v8.9 — Loose ICT OB + Strong/Weak + FVG/HVN/LVNGOLD 4H HUD v8.9 is a clean, structured Smart Money Concepts (SMC)–based analysis tool designed exclusively for XAUUSD on the 4-hour timeframe.
It focuses on the three most important elements for institutional orderflow analysis:
✔ Loose ICT Order Blocks (Demand/Supply)
✔ Fair Value Gaps (FVG)
✔ Volume Profile Zones (HVN/LVN/POC)
The script builds a professional-style HUD that displays the key institutional regions and structural levels that matter most for gold traders.
📌 Key Features
1 — Market Structure Engine (HH/HL & BOS)
The indicator detects:
Minor swing Highs and Lows
Last confirmed HH / HL levels
Break of Structure (BOS) for directional bias
EMA-200 trend filter (UP / DOWN / NEUTRAL)
This gives traders a clean structural read without clutter or noise.
2 — Loose FVG Engine (Tolerance-Based ICT Gaps)
A soft-threshold FVG engine detects “loose” Fair Value Gaps using a 0.1% price tolerance.
This method ensures:
Fewer missed imbalances
Cleaner OB/FVG alignment
Higher accuracy on 4H gold displacement legs
FVGs automatically shift to the right side of the chart for clean visualization.
3 — Order Block Engine (Demand/Supply + Strong/Weak Classification)
A simplified ICT-style OB engine scans the past few candles whenever BOS is detected.
It identifies:
Demand OB during bullish BOS
Supply OB during bearish BOS
Strong OB if fully nested inside an active FVG
Weak OB otherwise
OB boxes include:
Clear color coding (strong vs. weak)
Price range labels inside each box
Automatic right-shift for visual clarity
4 — Volume Profile Engine (POC / HVN / LVN / VAH / VAL)
Based on a rolling window (default 120 bars), the script builds a lightweight volume distribution.
It displays:
POC (Point of Control)
HVN (High Volume Node)
LVN (Low Volume Node)
Value Area High / Low
HVN/LVN zones are shown as right-shifted colored boxes with price labels.
These zones help identify:
Institutional accumulation
Low-liquidity rejection points
Areas where price tends to react strongly
5 — Support / Resistance Mapping
The script automatically generates:
OB-based support/resistance
Swing-high/swing-low levels
HVN/LVN structural levels
These are displayed in the HUD for fast reference.
6 — Professional HUD Panel
A compact, easy-to-read HUD summarizes:
Trend direction
Latest HH/HL
OB ranges (Strong/Weak)
HVN/LVN price zones
POC
Multi-layer support & resistance
This turns the script into a fully functional analysis dashboard.
📌 What This Indicator Is NOT
To avoid misunderstanding:
It does not take entries or generate buy/sell signals
It does not auto-detect CHOCH, MSS, SMT, or sweeps
It is not a trading bot
This tool is designed as an institutional-style map and analysis HUD, not a strategy.
📌 Best Use Case
This indicator is ideal for traders who want to:
Read institutional structure on XAUUSD
Identify clean Demand/Supply zones
Visualize FVG/OB/HVN interactions
Track high-value liquidity levels
Build directional bias on 4H before dropping to execution timeframes
⚠ Important Note
This tool is designed exclusively for the 4H timeframe.
Using it on lower timeframes will display a warning.

Confirmation FilterConfirmation Filter – BOS + Follow-Through
Confirmation Filter is a structure tool that only marks validated shifts in price delivery, not every break of structure.
The script:
Builds swing structure from pivots
Identifies the swing low that carried the last bullish leg and the swing high that carried the last bearish leg
Waits for a close through that key swing (your usual BOS)
Then requires follow-through:
Bearish: within N bars, price makes a new low below the break candle’s low
Bullish: within N bars, price makes a new high above the break candle’s high
Only when this follow-through occurs does the indicator print a Confirmation Bullish / Confirmation Bearish line from the originating swing.
Why use it
Filters out many “one-bar” fake BOS moves
Highlights only those breaks that actually extend in the same direction
Keeps the chart clean by tracking a single confirmed state at a time
Inputs
Pivot length – sensitivity of swing detection
Line extension bars – how far the confirmation level is projected
Max bars for follow-through – window (in bars) within which price must extend beyond the break candle
Show labels – toggle on-chart text tags
Best used together with your own BOS / structure tools:
BOS = first break
Confirmation Filter = breaks that proved themselves with follow-through.

Ghost Matrix [Bit2Billions]Ghost Matrix — Institutional Market Structure Engine
*A unified price-mapping system built on original logic, designed for professional-grade market structure analysis.*
Ghost Matrix is a closed-source script engineered to give traders a single, coherent view of liquidity, structure, swings, trend pressure, and institutional behavior across all time horizons.
It is not a mashup of public indicators. Every module is built around the same proprietary internal engines, ensuring consistency, originality, and practical trading value.
The script’s purpose is to solve a common problem among traders: multiple indicators producing conflicting signals.
Ghost Matrix consolidates structure, liquidity, momentum, zone logic, and higher-timeframe context into one synchronized framework.
Ghost Matrix is driven by three custom systems:
1. Proprietary Swing & Pivot Engine (Ghost Swing Engine)
This engine determines market turning points using:
* Adaptive displacement logic
* Dynamic pivot length calculations
* Fractal-strength scoring
* Multi-tier swing confirmation
These swings act as the foundation for BOS, CHoCH, liquidity lines, and zone detection.
This method is not based on standard fractals, ZigZag, or public swing scripts.
2. Structural Mapping Engine (Institutional Model Layer)
This system evaluates structure in the same narrative sequence used by advanced traders:
* Internal vs. external structure
* Trend progression vs. structural failure
* Strength/weakness of highs & lows
* Volatility-based CHoCH/BOS validation
This ensures structure is not drawn based on a single candle pattern, but from a multi-step decision model.
3. Adaptive Confluence Engine
Trend, volume, zones, and momentum modules respond to the structure engine, producing *contextual* signals instead of isolated indicators.
This includes:
* Adaptive moving average engine (custom smoothing + gradient logic)
* Demand/supply zones derived from momentum + displacement + volume footprints
* Ichimoku behavior model (crosses, twists, regime shifts)
* Multi-pivot target engine
This creates a full ecosystem rather than individual tools merged together.
Why This Script Has Genuine Value
✔ A unified structural ecosystem (not a mashup)
Every module connects to the same logic layers so the chart tells one consistent story.
✔ Proprietary decision-making logic
Swing detection, structure interpretation, liquidity lines, and zones are built from original formulas—not from built-ins or simple replications.
✔ A visual-first trading workflow
All visuals are designed for institutional-style reading:
* Structure confirmation
* Liquidity reach & sweep behavior
* Swing-to-fractal alignment
* Momentum vs. structural conflict
* Regime shifts through Ichimoku + MA pressure
✔ Designed for traders who rely on narrative-based execution
The indicator replaces:
* Manual swing marking
* Structure identification
* BOS/CHOCH tracking
* Liquidity mapping
* Zone drawing
* Trend mapping
* Volume context
* HTF candle overlays
All in a single, consistent tool.
Key Components & Intent
Market Structure Module (ICT/SMC Integration)
Detects:
* BOS / CHOCH
* BMS / SMS
* Internal / external structure
* IDM
* Liquidity lines (LQDT / Dynamic LQDT)
* FVG, EQH, EQL
* Strong/weak swing points
Purpose: provide a complete reading of institutional structure transitions.
Swing Visualization
Includes:
* Swing highs/lows
* Horizontal levels
* Connector lines
* Extension shadows
* Swing summary tables
Purpose: show turning points with clarity and narrative continuity.
Demand & Supply Zone Engine
Zones consider:
* Momentum displacement
* Volume presence
* Swing strength
* Structural side (pro-trend vs. corrective)
Purpose: highlight zones institutional traders monitor.
Adaptive Trend Model
Custom gradient-based MA system that reacts to:
* Volatility
* Momentum shifts
* Directional strength
Purpose: provide dynamic trend insight, not static MA interpretation.
Ichimoku Regime State (Modified)
Includes:
* TK Cross
* Kijun Cross
* Chikou interactions
* Kumo breakouts + twists
Purpose: define regime shifts and trend environments.
Aggregated Candles (Enhanced Same-Timeframe View)
Provides a refined, information-rich candle structure using the current chart’s timeframe only, offering deeper behavior insights without switching charts.
Dashboard
Shows:
* Swing direction
* CISD structure state
* Fractal alignment %
* Ichimoku events
* Consolidated signals
Visual Design (Clutter-Free Standard)
* Only real-time labels appear; historical labels stay hidden for clarity.
* Consistent, structured line styles:
* Trendlines: solid green/red
* CHOCH: dashed red/green
* BOS: solid red/green
* LQDT/Dynamic: yellow dotted
* EQH/EQL: red/green dotted
* CISD & IDM: gray dotted
This color logic helps traders read structure quickly.
Recommended Use
* Best on: 15m, 1H, 4H, Daily, Weekly
* Works across: crypto, forex, indices, liquid equities
* Pivot tools may show noise on illiquid markets
Performance Notes
* Heavy modules can draw many objects → disable what you don’t need
* Refresh chart if historical buffer limits are reached
* All TV object limits are handled internally
License
* proprietary script © 2025
* Independently developed logic and visualization system
* Redistribution, resale, sharing, or decompilation strictly prohibited
* Any similarity to public concepts is due to overlap with common trading methodologies
Disclaimer
This tool is for educational and research purposes only.
Not financial advice.
Always test responsibly.
FAQs
* Source is intentionally closed
* Alerts can be manually created
* Modules can be toggled
* Designed for multi-market, multi-timeframe workflow
About Ghost Trading Suite
Author: BIT2BILLIONS
Project: Ghost Trading Suite © 2025
Indicators: Ghost Matrix, Ghost Protocol, Ghost Cipher, Ghost Shadow
Strategies: Ghost Robo, Ghost Robo Plus
Pine Version: V6
The Ghost Trading Suite is designed to simplify and automate many aspects of chart analysis. It helps traders identify market structure, divergences, support and resistance levels, and momentum efficiently, reducing manual charting time.
The suite includes several integrated tools — such as Ghost Matrix, Ghost Protocol, Ghost Cipher, Ghost Shadow, Ghost Robo, and Ghost Robo Plus — each combining analytical modules for enhanced clarity in trend direction, volatility, pivot detection, and momentum tracking.
Together, these tools form a cohesive framework that assists in visualizing market behavior, measuring momentum, detecting pivots, and analyzing price structure effectively.
This project focuses on providing adaptable and professional-grade tools that turn complex market data into clear, actionable insights for technical analysis.
Crafted with 💖 by BIT2BILLIONS for Traders. That's All Folks!
Changelog
v1.0 — Core Release
* Added Custom Heikin-Ashi Candles for dust-free, clutter-free charting.
* Introduced Price Line overlay for clean close-price visualization.
* Implemented Adaptive Moving Averages with smooth transitions and gradient coloring.
* Added Intelligent Swing Detection with horizontal lines, shadow extensions, connectors, labels, and summary tables.
* Introduced full Market Structure (ICT & SMC) Mapping including short-, mid-, and long-term structures, IDM, LQDT, Dynamic LQDT, CISD, FVGs, EQH, EQL, premium/discount zones, weak/strong highs and lows, and order blocks.
* Added Demand & Supply Zones with adaptive institutional detection, highlighted boxes, and auto-labeling.
* Integrated Targets (Pivot Systems) supporting Camarilla, Fibonacci, Woodie, and other pivot levels.
* Added Aggregated Candles combining real-time and historical data for multi-timeframe analysis.
* Added General Dashboard consolidating swing direction, CISD state, structure alignment, Ichimoku signals, and overall market overview.
* Included Trend Lines & Ichimoku Modules for enhanced visual market context.

Breakdown Sniper [Riz]Breakdown Sniper is a complete structural-based price-action system designed to identify and validate three major setups
1. Failed Breakdowns (FBD)
2. Breakouts / Breakdowns (BO)
3. Back-Tests (BT)
The script analyzes swing structure, undercuts, reclaim behavior, channel bias, support/resistance levels, and a multi-layer confluence engine to highlight high-quality long/short signals.
It also includes trade management, target projections, trailing logic, risk models, and an optional dashboard for clarity.
Core Concepts Behind the System
1. Pivot Structure & New Low/High Logic
Breakdown Sniper continuously detects pivot highs and lows using user-defined left/right bars.
These pivots are used to determine
⦁ Recent structural lows/highs
⦁ Undercuts (for failed breakdowns)
⦁ Structural breaks (for FBO/BO setups)
This provides the foundation for all three setup types.
2. Failed Breakdown (FBD) Detection
The primary logic of the script is to detect failed breakdowns, which follow this sequence:
1. Identify an initial pivot low
2. Price undercuts that low
3. Price reclaims the level by a specified number of points
4. Optional: new higher low print confirming strength
5. Once confirmed, the script calculates:
⦁ Entry trigger price
⦁ Stop placement (multiple options: below undercut, below initial low, ATR-based, fixed)
⦁ Three profit targets based on risk multiples
The reverse logic is applied for failed breakouts (FBO).
3. Breakouts & Breakdowns (BO)
The system also captures momentum breakouts/breakdowns defined by:
⦁ Price breaking major support/resistance
⦁ Bar-level strength (close vs range)
⦁ ATR-based expansion
⦁ Holding above/below breakout level for a user-defined number of bars
If confirmed, the script projects T1/T2/T3 targets and stop placement automatically.
4. Back-test Setups (BT)
After a confirmed breakout/breakdown, the script monitors for a return to the breakout level, within a percentage tolerance.
If a clean retest occurs:
⦁ A BT Long or BT Short setup is generated
⦁ Risk and target calculations are performed automatically
This allows identifying continuation setups after strong breaks.
Channel & Levels System (Support/Resistance Engine)
The script builds a hybrid S/R and environment model using:
⦁ Regression channel OR
⦁ Donchian, Keltner, Bollinger channels (user-selectable)
The channel provides:
⦁ Upper/Lower boundaries
⦁ Midline
⦁ Trend bias based on slope
Additionally, a multi-touch support/resistance detector clusters pivot-based levels and scores them by:
⦁ Touch count
⦁ Recency
⦁ Age
⦁ Whether they classify as major levels
This explains where reversals and breakouts are most likely.
Confluence Engine
Every Long/Short signal receives a 0–100 score derived from:
⦁ Market structure: HH/HL or LL/LH
⦁ Trend filter (EMA-based)
⦁ Volatility conditions (ATR range requirements)
⦁ Session bias (Asian / London / New York / Overlap)
⦁ Volume expansion
⦁ Higher-timeframe trend (optional)
⦁ Location inside channel
⦁ Distance to nearest S/R
⦁ Setup-type priority (FBD/BO/BT)
Users can require a minimum score before a signal becomes valid.
Trade Management Logic
Once a trade triggers, the indicator handles:
⦁ Entry execution confirmation
⦁ Stop loss tracking
⦁ Three independent profit targets
⦁ Optional scale-ins
⦁ ATR-based trailing stop
⦁ Risk calculations
⦁ Real-time PnL monitoring
The script does not execute live trades — it only visualizes management levels for analysis.
Visual Components
Breakdown Sniper plots:
⦁ Channels & fills
⦁ Auto-detected S/R levels
⦁ Pivot highs/lows
⦁ Buy/Sell markers
⦁ Entry/Stop/Targets
⦁ Trade dashboard (optional)
⦁ Equity curve (optional)
Everything is toggle-based for clean charting.
How To Use the Indicator
Recommended Use-Case
⦁ Futures (ES/NQ/CL/RTY)
⦁ Indices
⦁ Crypto
⦁ FX
Works well on:
⦁ 5m / 15m / 1H
Signals do not repaint because pivots and reclaim sequences require bar completion.
Basic Usage Steps
1. Enable the setups you want to trade: FBD, BO, BT
2. Optionally turn on filters:
⦁ Trend filter
⦁ Volatility filter
⦁ Market structure filter
⦁ MTF trend filter
3. Wait for a valid long/short signal with sufficient confluence
4. Follow the plotted entry level, stop, and targets
5. Use the dashboard to monitor performance of each setup type
Important Notes
This is a structural/price-action tool, not a prediction model
No guarantee of profitability is provided
The indicator is educational and analytical
Always use independent confirmation and risk management
Disclaimer
This script is for education and analysis. It does not provide financial advice. Markets involve risk. Past behavior of any pattern or study does not imply future results. You are responsible for your own decisions.

Market Structure Trailing Stop MTF [Inspired by LuxAlgo]# Market Structure Trailing Stop MTF
**OPEN-SOURCE SCRIPT**
*208k+ views on original · Modified for MTF Support*
This indicator is a direct adaptation of the renowned **Market Structure Trailing Stop** by **LuxAlgo** (original script: [Market Structure Trailing Stop ]()). The core logic remains untouched, providing dynamic trailing stops based on market structure breaks (CHoCH/BOS). The **only modification** is the addition of **Multi-Timeframe (MTF) support**, allowing users to apply the trailing stops and structures from **higher timeframes (HTF)** directly on their current chart. This enhances usability for traders analyzing cross-timeframe confluence without switching charts.
**Special thanks to LuxAlgo** for releasing this powerful open-source tool under CC BY-NC-SA 4.0. Your contributions to the TradingView community have inspired countless traders—grateful for the solid foundation!
## 🔶 How the Script Works: A Deep Dive
At its heart, this indicator detects **market structure shifts** (bullish or bearish breaks of swing highs/lows) and uses them to generate **adaptive trailing stops**. These stops trail the price while protecting profits and acting as dynamic support/resistance levels. The MTF enhancement pulls this logic from user-specified higher timeframes, overlaying HTF structures and stops on the lower timeframe chart for seamless multi-timeframe analysis.
### Core Logic (Unchanged from LuxAlgo's Original)
1. **Pivot Detection**:
- Uses `ta.pivothigh()` and `ta.pivotlow()` with a user-defined lookback (`length`) to identify swing highs (PH) and lows (PL).
- Coordinates (price `y` and bar index/time `x`) are stored in persistent variables (`var`) for tracking recent pivots.
2. **Market Structure Detection**:
- **Bullish Structure (BOS/CHoCH)**: Triggers when `close > recent PH` (break above swing high).
- If `resetOn = 'CHoCH'`, resets only on major shifts (Change of Character); otherwise, on all breaks.
- Sets trend state `os = 1` (bullish) and highlights the break with a horizontal line (dashed for CHoCH, dotted for BOS).
- Initializes trailing stop at the local minimum (lowest low since the pivot) using a backward loop: `btm = math.min(low , btm)`.
- **Bearish Structure**: Triggers when `close < recent PL`, mirroring the bullish logic (`os = -1`, local maximum for stop).
- Structure state `ms` tracks the break type (1 for bull, -1 for bear, 0 neutral), resetting based on user settings.
3. **Trailing Stop Calculation**:
- Tracks **trailing max/min**:
- On new bull structure: Reset `max = close`.
- On new bear: Reset `min = close`.
- Otherwise: `max = math.max(close, max)` / `min = math.min(close, min)`.
- **Stop Adjustment** (the "trailing" magic):
- On fresh structure: `ts = btm` (bull) or `top` (bear).
- In ongoing trend: Increment/decrement by a percentage of the max/min change:
- Bull: `ts += (max - max ) * (incr / 100)`
- Bear: `ts += (min - min ) * (incr / 100)`
- This creates a **ratcheting effect**: Stops move favorably with the trend but never against it, converging toward price at a controlled rate.
- **Visuals**:
- Plots `ts` line colored by trend (teal for bull, red for bear).
- Fills area between `close` and `ts` (orange on retracements).
- Draws structure lines from pivot to break point.
4. **Edge Cases**:
- Variables like `ph_cross`/`pl_cross` prevent multiple triggers on the same pivot.
- Neutral state (`ms = 0`) preserves prior `max/min` until a new structure.
### MTF Enhancement (Our Addition)
- **request.security() Integration**:
- Wraps the entire core function `f()` in a security call for each timeframe (`tf1`, `tf2`).
- Returns HTF values (e.g., `ts1`, `os1`, structure times/prices) to the chart's context.
- Uses `lookahead=barmerge.lookahead_off` for accurate historical repainting-free data.
- Structures are drawn using `xloc.bar_time` to align HTF lines precisely on the LTF chart.
- **Multi-Output Handling**:
- Separate plots/fills/lines for each TF (e.g., `plot_ts1`, `plot_ts2`).
- Colors and toggles per TF to distinguish HTF1 (e.g., teal/red) from HTF2 (e.g., blue/maroon).
- **Benefits**: Spot HTF bias on LTF entries, e.g., enter longs only if both TF1 (1H) and TF2 (4H) show bullish `os=1`.
This keeps the script lightweight—**no repainting, max 500 lines**, and fully compatible with LuxAlgo's original behavior when TFs are set to the chart's timeframe.
## 🔶 SETTINGS
### Core Parameters
- **Pivot Lookback** (`length = 14`): Bars left/right for pivot detection. Higher = smoother structures, fewer signals; lower = more noise.
- **Increment Factor %** (`incr = 100`): Speed of stop convergence (0-∞). 100% = full ratchet (mirrors max/min exactly); <100% = slower trail, reduces whipsaws.
- **Reset Stop On** (`'CHoCH'`): `'CHoCH'` = Reset only on major reversals (dashed lines); `'All'` = Reset on every BOS/CHoCH (tighter stops).
### MTF Support
- **Timeframe 1** (`tf1 = ""`): HTF for first set (e.g., "1H"). Empty = current chart.
- **Timeframe 2** (`tf2 = ""`): Second HTF (e.g., "4H"). Enables dual confluence.
### Display Toggles
- **Show Structures** (`true`): Draws horizontal lines for breaks (per TF colors).
- **Show Trailing Stop TF1/TF2** (`true`): Plots the stop line.
- **Show Fill TF1/TF2** (`true`): Area fill between close and stop.
### Candle Coloring (Optional)
- **Color Candles** (`false`): Enables custom `plotcandle` for body/wick/border.
- **Candle Color Based On TF** (`"None"`): `"TF1"`, `"TF2"`, or none. Colors bull trend green, bear red.
- **Candle Colors**: Separate inputs for bull/bear body, wick, border (e.g., solid green body, transparent wick).
### Alerts
- **Enable MS Break Alerts** (`false`): Notifies on structure breaks (bull/bear per TF) **only on bar close** (`barstate.isconfirmed` + `alert.freq_once_per_bar_close`).
- **Enable Stop Hit Alerts** (`false`): Triggers on stop breaches (long/short per TF), using `ta.crossunder/crossover`.
### Colors
- **TF1 Colors**: Bullish (teal), Bearish (red), Retracement (orange).
- **TF2 Colors**: Bullish (blue), Bearish (maroon), Retracement (orange).
- **Area Transparency** (`80`): Fill opacity (0-100).
## 🔶 USAGE
Trailing stops shine in **trend-following strategies**:
- **Entries**: Use structure breaks as signals (e.g., long on bullish BOS from HTF1).
- **Exits**: Trail stops for profit-locking; alert on hits for automation.
- **Confluence**: Overlay HTF1 (e.g., 1H) for bias, HTF2 (e.g., Daily) for major levels—enter LTF only on alignment.
- **Risk Management**: Lower `incr` avoids early stops in chop; reset on `'All'` for aggressive trailing.
! (i.imgur.com)
*HTF1 shows bullish structure (teal line), trailing stop ratchets up—long entry confirmed on LTF pullback.*
! (i.imgur.com)
*TF1 (blue) bearish, TF2 (red) neutral—avoid shorts until alignment.*
! (i.imgur.com)
*Colored based on TF1 trend: Green bodies on bull `os=1`.*
Pro Tip: Test on demo—pair with LuxAlgo's other tools like Smart Money Concepts for full structure ecosystem.
## 🔶 DETAILS: Mathematical Breakdown
On bullish break:
- Local min: `btm = ta.lowest(n - ph_x)` (optimized loop equivalent).
- Stop init: `ts = btm`.
- Update: `Δmax = max - max `, `ts_new = ts + Δmax * (incr/100)`.
Bearish mirrors with `Δmin` (negative, so decrements `ts`).
In MTF: HTF `time` aligns lines via `line.new(htf_time, level, current_time, level, xloc.bar_time)`.
No logs/math libs needed—pure Pine v5 efficiency.
## Disclaimer
This is for educational purposes. Not financial advice. Backtest thoroughly. Original by LuxAlgo—modify at your risk. See TradingView's (www.tradingview.com). Licensed under CC BY-NC-SA 4.0 (attribution to LuxAlgo required).

Z-Score Bands + SignalsZ-Score Statistical Market Analyzer
A multi-dimensional market structure indicator based on standardized deviation & regime logic
English Description
Concept
This indicator builds a statistical model of price behaviour by converting every candle’s movement into a Z-score — how many standard deviations each close is away from its moving average.
It visualizes the normal distribution structure of returns and provides adaptive entry signals for both Mean Reversion and Breakout regimes.
Rather than predicting price direction, it measures statistical displacement from equilibrium and dynamically adjusts the decision logic according to the market’s volatility regime.
⚙️ Main Components
Z-Score Bands (±1σ, ±2σ, ±3σ)
– The core structure visualizes volatility boundaries based on rolling mean and standard deviation.
– Price outside ±2σ often indicates statistical extremes.
Dual Signal Systems
Mean Reversion (MRL / MRS): when price (or return z-score) crosses back inside ±2σ bands.
Breakout (BOL / BOS): when price continues to expand beyond ±2σ.
Volatility Regime Classification
The indicator detects whether the market is currently in a low-vol or high-vol regime using percentile statistics of σ.
Low vol → Mean Reversion preferred
High vol → Breakout preferred
🧠 Adaptive Switches
A. Freeze MA/σ - Use previous-bar stats to avoid repainting and lag.
B. Confirm on Close - Only generate signals once the base-timeframe bar closes (eliminates look-ahead bias).
C. Return-based Signal - Use log-return Z-score instead of price deviation — normalizes volatility across assets.
D. Outlier Filter - Exclude bars with abnormal single-bar returns (e.g., >20%). Reduces false spikes.
E. Regime Gating - Automatically switch between Mean Reversion and Breakout logic depending on volatility percentile.
Each module can be toggled individually to test different statistical behaviours or tailor to a specific market condition.
📊 Interpretation
When the histogram of returns approximates a normal distribution, mean-reversion logic is often more effective.
When price persistently drifts beyond ±2σ or ±3σ, the distribution becomes leptokurtic (fat-tailed) — a breakout structure dominates.
Hence, this tool can help you:
Identify whether an asset behaves more “Gaussian” or “fat-tailed”;
Select the correct trading regime (MR or BO);
Quantitatively measure market tension and volatility clusters.
🧩 Recommended Use
Works on any timeframe and any asset.
Best used on liquid instruments (e.g., XAU/USD, indices, major FX pairs).
Combine with volume, sentiment or structural filters to confirm signals.
For strategy automation, pair with the companion script:
🧠 “Z-Score Strategy • Multi-Source Confirm (MRL/MRS/BOL/BOS)”.
⚠️ Disclaimer
This script is designed for educational and research purposes.
Statistical deviation ≠ directional prediction — use with sound risk management.
Past distribution patterns may shift under new volatility regimes.
==================================================================================
中文说明(简体)
概念简介
该指标基于价格的统计分布原理,将每根 K 线的波动转化为标准化的 Z-Score(标准差偏离值),用于刻画市场处于均衡或偏离状态。
它同时支持 均值回归(Mean Reversion) 与 突破延展(Breakout) 两种逻辑,并可根据市场波动结构自动切换策略模式。
⚙️ 主要功能模块
Z-Score 通道(±1σ / ±2σ / ±3σ)
用滚动均值与标准差动态绘制的统计波动带,价格超出 ±2σ 区域通常意味着极端偏离。
双信号系统
MRL / MRS(均值回归多空):价格重新回到 ±2σ 以内时触发。
BOL / BOS(突破延展多空):价格持续运行在 ±2σ 之外时触发。
波动率分层
自动识别市场处于高波动还是低波动区间:
低波动期 → 适合均值回归逻辑;
高波动期 → 适合突破趋势逻辑。
🧠 A–E 模块说明
A. 固定统计参数:使用上一根 K 线的均值和标准差,防止重绘。
B. 收盘确认信号:仅在当前时间框架收盘后生成信号,避免前视偏差。
C. 收益率信号模式:采用对数收益率的 Z-Score,更具普适性。
D. 异常波过滤:忽略单根极端波动(如 >20%)的噪声信号。
E. 波动率调节逻辑:根据市场处于高/低波动区间,自动切换 MRL/MRS 或 BOL/BOS。
📊 应用解读
如果收益率分布接近正态分布 → 市场倾向震荡,MRL/MRS 效果较佳;
若价格频繁偏离 ±2σ 或 ±3σ → 市场呈现“肥尾”分布,趋势延展占主导。
因此,该指标的核心目标是:
识别当前市场的统计结构类型;
根据波动特征自动切换交易逻辑;
提供结构化、可量化的市场状态刻画。
💡 使用建议
适用于所有时间框架与金融品种。
建议结合成交量或结构性指标过滤。
若用于策略回测,可搭配同名 “Z-Score Strategy • Multi-Source Confirm” 策略脚本。
⚠️ 免责声明
本指标仅用于研究与教学,不构成任何投资建议。
统计偏离 ≠ 趋势预测,实际市场行为可能在不同波动结构下改变。
ICT PDA - Gold & BTC (QuickScalp Bias/FVG/OB/OTE + Alerts)What this script does
This indicator implements a complete ICT Price Delivery Algorithm (PDA) workflow tailored for XAUUSD and BTCUSD. It combines HTF bias, OTE zones, Fair Value Gaps, Order Blocks, micro-BOS confirmation, and liquidity references into a single, cohesive tool with early and final alerts. The script is not a mashup for cosmetic plotting; each component feeds the next decision step.
Why this is original/useful
Symbol-aware impulse filter: A dynamic displacement threshold kTune adapts to Gold/BTC volatility (body/ATR vs. per-symbol factor), reducing noise on fast markets without hiding signals.
Scalping preset: “Quick Clean” mode limits drawings to the most recent bars and keeps only the latest FVG/OB zones for a clear chart.
Three display modes: Full, Clean, and Signals-Only to match analysis vs. execution.
Actionable alerts: Early heads-up when price enters OTE in the HTF bias direction, and Final alerts once mitigation + micro-break confirm the setup.
How it works (high-level logic)
HTF Bias: Uses request.security() on a user-selected timeframe (e.g., 240m) and EMA filter. Bias = close above/below HTF EMA.
Dealing Range & OTE: Recent swing high/low (pivot length configurable) define the range; OTE (62–79%) boxes are drawn contextually for up/down ranges.
Displacement: A candle’s body/ATR must exceed kTune and break short-term structure (displacement up/down).
FVG: 3-bar imbalance (bull: low > high ; bear: high < low ). Latest gaps are tracked and extended.
Order Blocks: Last opposite candle prior to a qualifying displacement that breaks recent highs/lows; zones are drawn and extended.
Entry & Alerts:
Long: Bullish bias + price inside buy-OTE + mitigation of a bullish FVG or OB + micro BOS up → “PDA Long (Final)”.
Short: Bearish bias + price inside sell-OTE + mitigation of a bearish FVG or OB + micro BOS down → “PDA Short (Final)”.
Early Alerts: Trigger as soon as price enters OTE in the direction of the active bias.
Inputs & controls (key ones)
Bias (HTF): timeframe minutes, EMA length.
Structure: ATR length, Impulse Threshold (Body/ATR), swing pivot length, OB look-back.
OTE/FVG/OB/LP toggles: show/hide components.
Auto-Tune: per-symbol factors for Gold/BTC + manual tweak.
Display/Performance: View Mode, keep-N latest FVG/OB, limit drawings to last N bars.
Recommended usage (scalping)
Timeframes: Execute on M1–M5 with HTF bias from 120–240m.
Defaults (starting point): ATR=14, Impulse Threshold≈1.6; Gold factor≈1.05, BTC factor≈0.90; Keep FVG/OB=2; last 200–300 bars; View Mode=Clean.
Workflow: Wait for OTE in bias direction → see mitigation (FVG/OB) → confirm with micro BOS → manage risk to nearest liquidity (prev-day H/L or recent swing).
Alerts available
“PDA Early Long/Short”
“PDA Long (Final)” / “PDA Short (Final)”
Attach alerts on “Any alert() function call” or the listed conditions.
Chart & screenshots
Please include symbol and timeframe on screenshots. The on-chart HUD shows the script name and state to help reviewers understand context.
Limitations / notes
This is a discretionary framework. Signals can cluster during news or extreme volatility; use your own risk management. No guarantee of profitability.
Changelog (brief)
v1.2 QuickScalp: added Quick Clean preset, safer array handling, symbol-aware impulse tuning, display modes.
------------------------------
ملخص عربي:
المؤشر يطبق تسلسل PDA عملي للذهب والبتكوين: تحيز من فريم أعلى، مناطق OTE، فجوات FVG، بلوكات أوامر OB، وتأكيد micro-BOS، مع تنبيهات مبكرة ونهائية. تمت إضافة وضع “Quick Clean” لتقليل العناصر على الشارت وحساسية إزاحة تتكيّف مع الأصل. للاستخدام كسكالب: نفّذ على M1–M5 مع تحيز 120–240 دقيقة، وابدأ من الإعدادات المقترحة بالأعلى. هذا إطار سلوكي وليس توصية مالية.

Racktor Analysis Assistant
Racktor Analysis Assistant — Feature Overview
The Racktor Analysis Assistant is a multi-module market-structure toolkit that plots pivots, BoS/ChoCh levels, session breakouts, inside bars, and higher-timeframe BTS/STB trap signals — with complete styling controls and alerting.
Smart Pivot Engine (ZigZag Core)
- Adaptive pivot period switching based on timeframe threshold.
- ZigZag stream tracks pivot types (H/L, HH/HL/LH/LL) with Major & Minor streams.
- Clean visuals: optional ZigZag line & pivot labels with customizable style, width, and color.
Major & Minor Structure Signals
- Detects BoS and ChoCh for both Major and Minor swings.
- Updates External Trend on Major events and Internal Trend on Minor events.
- One-time triggers per level via locking.
- Per-category styling for Major/Minor Bullish & Bearish BoS and ChoCh.
- Alerts with symbol, pivot, timeframe, and time, limited to specific timeframes if desired.
Inside Bar Module
- Toggleable Inside Bar detection.
- Custom colors for bullish and bearish inside bars.
- Optional alerts on detection.
Session Breakout Suite
- Custom session window with shaded box.
- On session close, plots High/Mid/Low breakout lines extendable for N hours.
- Optional previous day & week high/low lines.
- Breakout vs Liquidity Sweep modes (close-based or wick-based confirmation).
- Display styles: Fixed (triangles) or Moving (vertical dotted lines).
- Alerts for “first event” or “every event.”
BTS/STB Trap (Higher-Timeframe ID1/ID2 Logic)
- BTS/STB toggle with selectable check timeframe (default: 4H).
- STB (bullish, Sell→Buy): strict ID1/ID2 relationships, both candles bullish; green circle below HTF ID1 low.
- BTS (bearish, Buy→Sell): strict ID1/ID2 relationships, both candles bearish; red circle above HTF ID1 high.
- Non-repainting; dots appear only at HTF candle close.
- Timeframe-aware rendering (dots show only on selected timeframe).
- Alerts for STB/BTS at HTF close.
Styling & Limits
- Per-feature color/style/width customization.
- Generous limits for boxes, labels, and lines.
- Session tools limited to ≤ 120-minute charts for accuracy.
Anti-Repaint
- HTF signals use lookahead_off and HTF-close gating to avoid repainting.
- BoS/ChoCh and Session logic track prior values and use locks to prevent duplicates.
Quick Start
Set the Timeframe Threshold and pivot periods for lower/higher TFs.
Enable desired Major/Minor BoS/ChoCh lines and customize styles.
Activate Inside Bar Module if required.
Configure Session Breakout window, mode, and alert settings.
Enable BTS/STB detection, keeping 4H default or selecting a custom TF.
Add alerts for chosen signals and let the assistant annotate structure, sessions, and HTF traps.
Best Use with Racktor's Core Trading Strategy
For traders who want structure clarity without clutter, this Analysis-Assistant is built to keep your chart actionable and adaptive.
