ICT Smart Money Trading Suite PRO [SwissAlgo]ICT SMC Trading Suite Pro
Structure Detection. Imbalance Tracking. Trade Planning. Contextual Alerts.
Why This Integrated System Was Built
The ICT/SMC methodology requires tracking multiple analytical components simultaneously - a process prone to manual errors, time inefficiency, and visual clutter . This indicator consolidates these elements into a single, unified system , providing rules-based validation for experienced ICT traders who may struggle with execution speed, consistency, and manual calculations.
-----------------------------------------------------------------
What This Indicator Does
ICT/SMC methodology involves tracking multiple analytical components simultaneously. This indicator consolidates them into a single system.
Common challenges when applying ICT manually:
1️⃣ Structure Identification
Determining which pivots qualify as external (macro) structure versus internal (micro) structure requires consistent rules. Inconsistent structure identification affects the detection of the relevant trading range for entries , Change of Character (ChoCH) , and Break of Structure (BoS) . Accurate structure identification is paramount ; a faulty reading invalidates the entire ICT thesis for the current swing. While no automated system can replace human judgment, the indicator provides you with a rules-based starting point for structural analysis. The key goal is to help you find and map the relevant structural leg to focus on.
2️⃣ Chart Organization
Drawing Fibonacci retracements, Fair Value Gaps, Order Blocks, and other imbalances manually creates visual complexity that can obscure the analysis. The indicator addresses this by striving to show all imbalances in a consistent, unified, and understandable visual way , using color coding and z-order layering to maintain clarity even when multiple components are active.
3️⃣ Imbalance Tracking
ICT methodology requires monitoring a vast array of institutional footprints : Fair Value Gaps (FVG), Order Blocks (OB), Breaker Blocks (BB), Liquidity Pools (LP), Volume Imbalances, Wick Imbalances, and Kill Zone ranges. Tracking all these simultaneously and manually monitoring their mitigation status is highly time-intensive and prone to oversight . The indicator constantly scans and tracks all key imbalance types for you, automatically updating their status and creating a dynamic, real-time visual heatmap of unmitigated institutional inefficiency.
4️⃣ Trade Calculation
Determining structure-based Stop Loss (SL) placement, calculating multiple Take Profit (TP) levels with accurate position-sizing splits, and computing the final blended Risk-to-Reward (R:R) ratio involves multiple time-sensitive, manual calculations per setup . The indicator automates this entire trade calculation process for you, instantly providing the necessary pricing (entry, SL, TP), sizing, and performance projections, and mitigating the risk of execution error .
5️⃣ Condition Monitoring
ICT setups often require specific technical conditions to align: price reaching discount Fibonacci levels (0.618-0.882 for shorts, 0.118-0.382 for longs), EMA crossovers confirming momentum, or structural shifts (ChoCH/BoS). Identifying these moments requires continuous chart observation across multiple assets and timeframes.
This indicator includes an alert system that monitors these technical conditions and sends notifications when they occur (real-time). The alert system is designed to minimize spam. This allows traders to review potential setups on demand rather than through continuous observation - particularly relevant for those monitoring multiple instruments or trading sessions outside their local timezone.
-----------------------------------------------------------------
Intended Use
This indicator is designed for traders who:
♦ Apply ICT/SMC methodology - Familiarity with concepts such as Fair Value Gaps, Order Blocks, Liquidity Pools, market structure, and discount/premium zones is assumed. The indicator does not teach these concepts but provides tools to apply them.
♦ Trade on intraday to swing timeframes - The structure detection and Fibonacci zone mapping work across multiple timeframes. Recommended primary timeframe: 1H (adjustable based on trading approach).
♦ Prefer systematic entry planning - The trade calculation feature computes stop loss, take profit levels, and risk-to-reward ratios based on structure and Fibonacci positioning. Suitable for traders who use defined entry criteria.
♦ Monitor multiple instruments or sessions - The alert functionality notifies when specific technical conditions occur (discount zone entries, EMA crossovers, structure changes), reducing the need for continuous manual monitoring.
♦ Use trade execution platforms - The trade summary table displays pre-formatted values (entry, SL, TP levels with quantity splits) that can be manually input into trading platforms or bot services like 3Commas.
-----------------------------------------------------------------
How To Use
Step 1: Structure Analysis
The indicator automatically detects external and internal market structure using pivot analysis. Structure lines are color-coded: red for bearish structure, green for bullish. External pivots are marked with larger triangles, internal pivots with smaller markers. The pivot length parameters (default: 20/20) can be adjusted in settings to align with your structural analysis approach and the asset you are analyzing.
Step 2: Define Your Trading Zone
Use the "Start Swing" and "End Swing" date inputs to mark the beginning and end of the (external) structural leg you wish to analyze. The indicator calculates Fibonacci retracement levels based on these points and color-codes the zones:
* Green zones: Discount area (0.618-0.882 for bearish / 0.118-0.382 for bullish)
* Yellow zones: Premium area (0.786-1.0 for bearish / 0.0-0.214 for bullish)
* Red zones: Extension area beyond structure (potential fake-out zones)
Step 3: Review Imbalances
The indicator identifies and displays multiple imbalance types:
🔥 Volume imbalances (from displacement candles based on PVSRA methodology)
🔥 Fair Value Gaps (FVG)
🔥 Order Blocks (OB) and Breaker Blocks (BB)
🔥 Liquidity Pools (LP) at equal highs/lows
🔥 Wick imbalances (exceptional wick formations)
🔥 Kill Zone liquidity from specific trading sessions (Asian, London, NY AM)
Volume Imbalances
Fair Value Gaps
Order Blocks
Liquidity Pools
Wick Imbalances
Kill Zone Imbalances
According to ICT methodology, imbalances act as price magnets - areas where price tends to return for mitigation. When multiple imbalances overlap at the same price level, this creates a confluence zone with a higher probability of price reaction .
Imbalances are displayed as gray boxes , creating a visual heatmap of institutional inefficiencies. When imbalances overlap, the zones appear darker due to layering, and labels combine to show confluence (e.g., "FVG + OB" or "Vol + LP").
Heatmap of Imbalances
User can view each type alone, or all together (heatmap)
Each imbalance type is tracked until mitigated by price according to ICT principles and can be toggled on/off independently in settings.
Step 4: Reference Levels & Sessions
The indicator displays additional reference data:
🔥 Daily Pivot Points (PP, R1-R3, S1-S3) calculated from previous day
🔥Average Daily Range (ADR) projected from the current day's extremes
🔥 Daily OHLC levels: Today's Open (DO), Previous Day High (PDH), Previous Day Low (PDL)
🔥Session backgrounds (optional): Color-coded boxes for Asian, London, NY AM, and NY PM sessions
Sessions
While these are not ICT-specific imbalances, they represent widely-watched price levels that often attract institutional activity and can act as additional reference points for support, resistance, and liquidity targeting.
All reference levels can be toggled independently in settings.
Step 5: Momentum Reference
EMA 14 and EMA 21 lines are displayed for momentum analysis. When EMA 14 enters discount zones and crosses EMA 21, a triangle marker appears on the chart. This indicates a potential alignment of structure and momentum conditions.
Step 6: Trade Planning
Input your intended entry price in the "Entry Price" field along with your margin and leverage parameters. The indicator automatically calculates all trade parameters:
* Stop loss level (based on Fibonacci structure - typically at 1.118 extension)
* Three take profit levels (TP1, TP2, TP3) with position quantity splits
* Risk-to-reward ratio (blended across all three targets)
* Projected profit/loss values in both dollars and percentage
All calculated values are displayed both visually on the chart (as horizontal lines with labels) and in a formatted Trade Summary table. The table organizes the information for quick reference: entry details, take profit levels with quantities, stop loss parameters, and performance projections.
This pre-calculated data can be manually copied into trading platforms or bot services (such as 3Commas Smart Trades) without requiring additional calculations.
Step 7: Alert Configuration
Create alerts using TradingView's alert system (select "Any alert() function call"). The indicator sends notifications when:
* Price reaches specific discount Fibonacci levels (0.618, 0.786, 0.882 for shorts / 0.382, 0.214, 0.118 for longs)
* EMA 14/21 crossovers occur within discount zones
* Change of Character (ChoCH) is detected
* Break of Structure (BoS) is detected
Note: Alerts require active TradingView alert functionality. Update alerts when changing your trading zone parameters.
-----------------------------------------------------------------
Key Features
Structure & Zone Analysis
* Automated structure detection with external/internal pivots and zig-zag visualization
* Fibonacci retracement mapping with color-coded discount/premium zones
* Visual zone classification: Green (optimal discount), Yellow (premium), Red (fake-out risk)
ICT Imbalances Heatmap
* Volume imbalances (PVSRA displacement candles)
* Fair Value Gaps (FVG)
* Order Blocks (OB) and Breaker Blocks (BB)
* Liquidity Pools (LP) at equal highs/lows
* Wick imbalances (exceptional wick formations)
* Kill Zone liquidity (Asian, London, NY AM sessions)
* Confluence detection with combined labels and visual layering
Reference Levels
* Daily Pivot Points (PP, R1-R3, S1-S3)
* Average Daily Range (ADR) projections
* Daily OHLC levels (DO, PDH, PDL)
* Session backgrounds for kill zones
Trade Planning Tools
* Automated stop loss calculation based on Fibonacci structure
* Three-tier take profit system with position quantity splits
* Risk-to-reward ratio calculation (blended across all targets)
* P&L projections in dollars and percentages
* Trade Summary table formatted for manual platform entry
Momentum & Signals
* EMA 14/21 overlay for momentum analysis
* Visual crossover markers (triangles) in discount zones
* Change of Character (ChoCH) detection and labels
* Break of Structure (BoS) detection and labels
Chart Enhancements
* Higher timeframe candle overlay (5m to Monthly)
* PVSRA candle coloring (volume-based)
* Symbol legend for quick reference
* Customizable visual elements (toggle all components independently)
Alert System
* Discount zone entry notifications (Fibonacci level monitoring)
* EMA crossover signals within discount zones
* Structure change alerts (ChoCH and BoS)
* Configurable via TradingView alert functionality
Alert Functionality
The indicator includes an alert system that monitors technical conditions continuously.
When configured, alerts notify users when specific events occur:
❗ Discount Zone Monitoring
When EMA 14 crosses into key Fibonacci levels (0.618, 0.786, 0.882 for bearish structure / 0.382, 0.214, 0.118 for bullish structure), an alert is triggered. Example: Trading BTC and ETH simultaneously - instead of monitoring both charts for zone entries, alerts notify when either asset reaches the specified level.
❗ Momentum Alignment
When EMA 14 crosses EMA 21 within discount zones, an alert is sent. Example: Monitoring setups across multiple timeframes (1H, 4H, Daily) - alerts indicate when momentum conditions align on any timeframe being tracked.
❗ Structure Changes
Change of Character (ChoCH) and Break of Structure (BoS) events trigger alerts. Example: Trading during the Asian session while located in a different timezone - alerts notify of structure changes occurring outside active monitoring hours.
Configuration
Alerts are set up through TradingView's native alert system. Select "Any alert() function call" when creating the alert.
⚠️ Note: Alert parameters are captured at creation time, so alerts must be updated when changing trading zone settings (Start/End Swing dates) or any other parameter.
How to Create Alerts
Step 1: Open Alert Creation
Click the "Alert" button (clock icon) in the top toolbar of TradingView, or right-click on the chart and select "Add Alert."
Step 2: Configure Alert Condition
* In the alert dialog, set the Condition dropdown to select this indicator
* Set the alert type to ⚠️ " Any alert() function call "
* This configuration allows the indicator to trigger alerts based on its internal logic
Step 3: Set Alert Timing
* Timeframe: Same as chart
* Expiration: Choose "Open-ended (when triggered)" to keep the alert active until conditions occur
* Message tab: choose a name for the alert
Step 4: Notification Settings
Configure how you want to receive notifications:
* Popup within TradingView
* Email notification
* Mobile app push notification (requires TradingView mobile app)
Step 5: Create
Important Notes:
* Alert parameters are captured at creation time . If you change your trading zone (Start/End Swing dates) or entry price, delete the old alert and create a new one .
* One alert per chart: Create separate alerts for each instrument and timeframe you're monitoring.
* TradingView alert limits apply based on your TradingView subscription tier.
What Triggers Alerts: This indicator sends alerts for four key event types:
1. Discount Zone Entry - EMA 14 crossing key Fibonacci levels
2. Momentum Crossover - EMA 14/21 crossovers within discount zones
3. Change of Character (ChoCH) - Structure reversal detected
4. Break of Structure (BoS) - Trend continuation confirmed
All four conditions are monitored by a single alert configuration .
-----------------------------------------------------------------
Recommended Settings
* Timeframe : 1H works well for most assets
* Theme : Dark mode recommended
* Structural Pivots : Default 20/20 captures reasonable structure; adjust to match your analysis
-----------------------------------------------------------------
Chart Elements Guide
♦ Structure Visualization
Zig-zag lines
Automated structure detection - green lines indicate bullish structure, red lines indicate bearish structure. Thick lines represent external structure , thin faded lines show internal structure .
Triangle markers
Large triangles mark external pivots (swing highs/lows), small triangles mark internal pivots.
Fibonacci Zones
* Green zones: Discount area - potential entry zones (0.618-0.882 for shorts / 0.118-0.382 for longs)
* Yellow zones: Premium area - higher extension zones (0.786-1.0 for shorts / 0.0-0.214 for longs)
* Red zones: Fake-out risk area - price beyond structural extremes (above 1.0 for shorts / below 0.0 for longs)
* White dashed lines: Individual Fibonacci levels (1.0, 0.882, 0.786, 0.618, 0.5, 0.382, 0.214, 0.118, 0.0)
♦ Imbalance Heatmap
Gray boxes with dotted midlines
Unmitigated imbalances create a visual heatmap. Overlapping imbalances appear darker due to layering.
Combined labels
When multiple imbalances overlap, labels show confluence (e.g., "FVG + OB", "Vol + LP + Wick")
Types displayed : Vol (Volume), FVG (Fair Value Gap), OB (Order Block), BB (Breaker Block), LP (Liquidity Pool), Wick, KZ (Kill Zone)
♦ Momentum Indicators
* Red line: EMA 14
* Yellow line: EMA 21
* Small triangles on price: Crossover signals - red triangle (bearish crossover), green triangle (bullish crossover) when occurring within discount zones
♦ Structure Change Markers
* Labels with checkmarks/crosses: ChoCH (Change of Character) and BoS (Break of Structure) events (Green label with ✓: Bullish ChoCH or BoS, Red label with ✗: Bearish ChoCH or BoS)
♦ Trade Planning Lines (when entry price is set)
* Blue horizontal line: Entry price
* Green dashed lines: TP1 and TP2
* Green solid line: TP3 (final target)
* Red horizontal line: Stop Loss level
TP levels and SL are calculated based on the structure range, entry price, and mapped trading zone, and aim to achieve a minimum risk: reward ratio of 1:1.5 (R:R)
♦ Colored background zones:
Green shading between entry and TP3 (profit zone), red shading between entry and SL (loss zone)
♦ Reference Levels
* Orange dotted lines with labels: Daily Pivot Points (PP, R1-R3, S1-S3)
* Purple dotted lines with labels: ADR High and ADR Low projections
* Cyan dotted lines with labels: DO (Daily Open), PDH (Previous Day High), PDL (Previous Day Low)
♦ Session Backgrounds (optional)
* Yellow shaded box: Asian session (19:00-00:00 NY time)
* Blue shaded box: London session (02:00-05:00 NY time)
* Green shaded box: NY AM session (09:30-11:00 NY time)
* Orange shaded box: NY PM session (13:30-16:00 NY time)
♦ Trade Summary Table (top-right corner)
Displays a complete trade plan with sections:
* Sanity Check: Plan validation status
* Setup: Trade type, leverage, entry price, position size
* Take Profit: TP1, TP2, TP3 with prices, percentages, and quantity splits
* Stop Loss: SL price and type
* Performance: Potential profit/loss, ROI, and risk-to-reward ratio
♦ HTF Candle Overlay (optional, displayed to the right of the current price)
* Larger candlesticks representing higher timeframe price action
* Green bodies: Bullish HTF candles
* Red bodies: Bearish HTF candles
* Label shows selected timeframe (e.g., "HTF→ D" for daily)
♦ Legend Table (bottom-right corner)
Quick reference guide explaining all symbol abbreviations and color codes used on the chart.
-----------------------------------------------------------------
Methodology & Calculation Details
This indicator consolidates multiple ICT/SMC analytical components into a single integrated system. While individual elements could be created separately, this integration provides automated coordination between components , consistency, and reduces chart complexity.
Structure Detection External and internal pivots
Are identified using fractal pivot analysis with configurable lookback periods (default: 20 bars for both). A pivot high is confirmed when the high at the pivot bar exceeds all highs within the lookback range on both sides. Pivot lows use inverse logic. Structure lines connect validated pivots, with color coding based on price direction (higher highs/higher lows = bullish, lower highs/lower lows = bearish).
Fibonacci Retracement Calculation
Users define two swing points via date/time inputs. The indicator calculates the price range between these points and applies standard Fibonacci ratios (0.0, 0.118, 0.214, 0.382, 0.5, 0.618, 0.786, 0.882, 1.0, plus extensions at 1.118, 1.272, -0.118, -0.272). Zone classification is based on ICT discount/premium principles: 0.618-1.0 range for bearish setups, 0.0-0.382 for bullish setups.
Imbalance Identification
Volume Imbalances : Detected using PVSRA (Price, Volume, Support, Resistance Analysis) methodology. Candles are classified based on the percentile ranking of volume and price range over a 1344-bar lookback period. Type 1 imbalances require ≥95th percentile in both volume and range; Type 2 requires ≥85th percentile. Additional filters include body-to-range ratio (≥50% for Type 1, ≥30% for Type 2) and ATR validation.
Fair Value Gaps (FVG) : Identified when a three-candle sequence shows a price gap: low > high for bullish FVG, high < low for bearish FVG. The middle candle must close beyond the gap edge. Mitigation occurs when the price retraces into the gap.
Order Blocks (OB) : Detected by identifying the last opposing candle before a significant price move. When price breaks a swing high/low, the algorithm scans backwards to find the candle with the highest high (bearish OB) or lowest low (bullish OB) before the breakout. When an OB is breached, it converts to a Breaker Block (BB).
Liquidity Pools (LP) : Identified by detecting equal highs or equal lows using a tolerance threshold based on ATR. Pivot highs/lows within this tolerance range are grouped. Equal highs create Buy-Side Liquidity (BSL) zones above the level; equal lows create Sell-Side Liquidity (SSL) zones below the level.
Wick Imbalances: Flagged when a candle's wick exceeds 1.0x ATR and comprises >50% of the total candle range. These represent rapid rejections or absorption events.
Kill Zone Liquidity: Tracks the high/low range during specific ICT-defined sessions (Asian: 19:00-00:00 NY, London: 02:00-05:00 NY, NY AM: 09:30-11:00 NY). At session close, BSL and SSL zones are created above/below the session range.
Change of Character (ChoCH) & Break of Structure (BoS)
ChoCH is detected when price breaks counter to the established structure (bearish structure broken upward = bullish ChoCH; bullish structure broken downward = bearish ChoCH). BoS occurs when price breaks in the direction of the established trend (bearish structure breaking lower = bearish BoS; bullish structure breaking higher = bullish BoS).
Trade Calculations
Stop Loss and Take Profit levels are calculated based on the entry position within the Fibonacci zone structure:
* Premium entries (0.786-1.0 for shorts / 0.0-0.214 for longs): SL at 1.118/-0.118 extension, TP structure weighted toward zone extremes
* Golden entries (0.618-0.786 for shorts / 0.214-0.382 for longs): SL at 1.0/0.0 boundary, TP structure balanced across range
Risk-to-reward ratios are calculated as blended values across all three take profit levels, weighted by position quantity splits.
Reference Level Calculations
* Pivot Points: Standard formula using previous day's high, low, and close: PP = (H + L + C) / 3
* Support/Resistance: R1 = 2×PP - L, S1 = 2×PP - H, with R2/S2 and R3/S3 calculated using range extensions
* ADR: 14-period simple moving average of daily high-low range, projected from current day's extremes
Momentum Analysis
EMA 14 and EMA 21 use standard exponential moving average calculations. Crossovers are detected when EMA 14 crosses EMA 21 within user-defined discount zones, with directional confirmation (cross under in bearish discount = short signal; cross over in bullish discount = long signal).
Why This Integration Matters
While components like EMA crossovers, pivot detection, or Fibonacci retracements exist as separate indicators, this system provides:
1. Coordinated Analysis : All components reference the same structural framework (user-defined trading zone)
2. Automated Mitigation Tracking : Imbalances are monitored continuously and removed when mitigated according to ICT principles
3. Contextual Alerts : Notifications are triggered only when conditions align within the defined structural context
4. Trade Parameter Automation : Stop loss and take profit calculations adjust dynamically based on entry positioning within the structure
5. Consistent Visual Display : All elements use a unified color scheme, labeling system, and z-order layering. This eliminates visual conflicts that occur when stacking multiple independent indicators (overlapping lines, label collisions, inconsistent transparency levels, conflicting color schemes).
This consolidation reduces the need to manually coordinate 8-10 separate indicators, eliminates redundant calculations across disconnected tools, and maintains visual clarity even when all components are displayed simultaneously.
-----------------------------------------------------------------
Disclaimer
1. Indicator Functionality and Purpose
This indicator is solely a technical analysis tool built upon established methodologies (Smart Money Concepts/ICT) and statistical calculations (Pivots, Fibonacci, EMAs). It is designed to assist experienced traders in visualizing complex data, streamlining the analytical workflow, and automating conditional alerting.
The indicator is NOT:
♦ Financial Advice: It does not provide personalized investment recommendations, solicited advice, or instruction on buying, selling, or holding any financial instrument.
♦ A Guarantee of Profit: The presence of a signal, alert, or trade plan output by this tool does not guarantee that any trade will be profitable.
♦ A Predictor of Future Prices: The tool calculates probabilities and potential scenarios based on historical data and current structure; it does not predict future market movements.
2. General Trading Risks and Capital Loss
♦ All trading involves substantial risk of loss. You may lose some or all of your initial capital. Leveraged products, such as futures, CFDs, and margin trading, carry a high degree of risk and are not suitable for all investors.
♦ Risk Acknowledgment: By using this indicator, you acknowledge and accept that you are solely responsible for all trading decisions, and you bear the full risk of any resulting profit or loss.
♦ Risk Management is Crucial: This indicator is an analytical tool only. You must employ independent risk management techniques (position sizing, stop-loss orders) tailored to your personal financial situation and risk tolerance.
3. Calculation Limitations and Non-Real-Time Data
The calculations performed by this indicator are based on the data provided by your charting platform (e.g., TradingView).
♦ Data Accuracy: The accuracy of the outputs (e.g., Price Delivery Arrays, Pivots, P&L projections) is dependent on the accuracy and real-time nature of the underlying market data feed.
♦ Latencies: Trade alerts and signals may be subject to minor delays due to server processing, internet connectivity, or charting platform performance. Do not rely solely on alerts for execution.
♦ Backtesting and Performance: Any depiction of past performance, including data visible on the chart, is not indicative of future results. Trading results will vary based on market conditions, liquidity, and execution speed.
4. Software and Platform Disclaimer
"As Is" Basis: The indicator is provided on an "as is" basis without warranties of any kind, whether express or implied. The author does not guarantee the script will be error-free or operate without interruption.
Third-Party Integration: This indicator is not affiliated with, endorsed by, or connected to TradingView, 3Commas, or any other broker or execution platform. All third-party names are trademarks of their respective owners. The formatting of the Trade Summary Table for 3Commas is for user convenience only.
5. Required Competency (User Responsibility)
This indicator is built on the assumption that the user is an experienced trader with a working understanding of the complex concepts being visualized (ICT/SMC, FVG, Order Blocks, Liquidity, etc.). The indicator does not teach these concepts.
You Must Always Do Your Own Research (DYOR) before making any trading decision based on signals or visualization provided by this tool.
By installing and using this indicator, you explicitly agree to these terms and assume full responsibility for all trading activity.
Cerca negli script per "BOS"

Sweep2Trade Pro [CHE]Sweep2Trade Pro \ — Liquidity Sweep → Trend → Confirmation
Sweep2Trade Pro \ helps you catch high-probability reversals or continuations that start with a liquidity sweep, align with the T3 trend, and finalize with a structure confirmation (BOS). It’s designed to reduce noise, time your entries, and keep you out of weak, chop-driven signals.
What’s a “sweep”?
A liquidity sweep happens when price briefly breaks a prior swing high/low (where many stops sit), triggers those stops, and then snaps back. This “stop-hunt” creates liquidity for bigger players and often precedes a sharp move in the opposite direction if the break fails, or fuels continuation if structure actually shifts.
What’s a BOS (Break of Structure)?
A BOS is a price action event where the market takes out a recent swing level in the trend’s direction, signaling continuation and confirming that structure has shifted (bullish BOS through a recent swing high, bearish BOS through a recent swing low).
How the indicator works (at a glance)
1. Regime Filter (T3 + R²)
T3 Moving Average: A smoother, faster-responding moving average that aims to reduce lag while filtering noise, so trend direction changes are clearer.
R² (Coefficient of Determination): Measures how “linear” the recent price path is (0→1). Higher values = stronger, cleaner trend; lower values = more chop. Used here to allow trades only when trend quality exceeds a user-set threshold.
2. Sweep Detection
Bullish sweep: price pokes below a prior swing low and closes back above it.
Bearish sweep: price pokes above a prior swing high and closes back below it.
Lookback length is configurable.
3. Sequence Lock (built-in FSM)
The script manages state in phases so you don’t jump the gun:
Phase 1: Sweep detected → wait for T3 to turn in the corresponding direction.
Phase 2: T3 direction confirmed → show “SWEEP OK” and wait for final confirmation.
Trade Signal: Only fires if confirmation arrives before a timeout.
4. Confirmation Layer
BOS via wick or close (you choose),
Strong close toward the signal (top/bottom quartile of the candle),
Optional “close above/below T3” condition.
These checks help avoid weak sweeps that immediately fade.
5. Alerts & Visuals
“SWEEP OK” markers show when the sweep + T3 direction align.
Final BUY/SELL arrows appear only when the confirmation layer passes.
Ready-made alert conditions for automation.
What you can do with it
Time reversals after sweeps: Enter when a stop-hunt fades and structure confirms.
Ride continuations: Use BOS with the T3 trend to pyramid or re-enter with structure on your side.
Filter chop: Let R² gate entries to periods with cleaner directional drift.
Automate: Use the included alerts with your platform or webhook setup.
Inputs (key settings)
Regime Filter
T3 Length / Volume Factor: Controls smoothness and responsiveness. Smaller length → faster, more sensitive; higher volume factor → smoother curve.
R² Lookback & Threshold: Length of the linear fit window and the minimum “trend quality” required. Higher thresholds mean fewer, cleaner signals.
Sweep / Sequence
Swing Lookback: How far back to define the “reference” high/low for sweeps.
Timeout: Maximum bars allowed between phases to keep signals fresh.
Restart timeout on Phase 2: Optional safety so entries don’t go stale.
Confirmation
BOS Lookback: Micro-pivot window for structure breaks.
Wick vs Close BOS: Conservative traders may prefer close.
Require close above/below T3: Tightens confirmation with trend alignment.
Practical guide (quick start)
1. Timeframe & markets: Works across majors, indices, and crypto. Start with 5m–1h intraday or 1h–4h swing; adjust R² threshold upward on noisier pairs.
2. Entry recipe (Long):
Bullish sweep of a prior low → T3 turns up → BOS/strong close.
Optional: enable “close above T3” for extra confirmation.
3. Entry recipe (Short): Mirror the above.
4. Stops: Common choices are just beyond the sweep wick (tighter) or past the BOS invalidation (safer).
5. Targets: Previous structural levels, measured move, or a T3 trail (exit when price closes back through T3).
6. Avoid low-quality contexts: If R² is very low, market is likely ranging erratically—skip or widen filters.
Tips & best practices
Context first: The same sweep means different things in a strong trend vs. flat regime; that’s why the T3+R² filter exists.
BOS choice: Wick-based BOS is earlier but noisier; close-based BOS is slower but cleaner. Tune per market.
Backtest -> Forward test: Validate settings per symbol/timeframe; then paper trade before going live.
Risk: Fixed fractional risk with asymmetric R\:R (e.g., 1:1.5–1:3) generally performs better than “all-in” discretionary sizing.
Behind the scenes (for the curious)
T3 is a multi-stage EMA construction that produces a smooth curve with reduced lag versus simple/standard EMAs.
R² is the square of correlation (0–1). Here it’s used as a moving gauge of how well price aligns to a linear path—our “trend quality” dial.
Stop-hunts / sweeps are a recognized microstructure phenomenon where clustered stops provide the liquidity that fuels the next move.
Disclaimer
No indicator guarantees profits. Sweep2Trade Pro \ is a decision aid; always combine with solid risk management and your own judgment. Backtest, forward test, and size responsibly.
The content provided, including all code and materials, is strictly for educational and informational purposes only. It is not intended as, and should not be interpreted as, financial advice, a recommendation to buy or sell any financial instrument, or an offer of any financial product or service. All strategies, tools, and examples discussed are provided for illustrative purposes to demonstrate coding techniques and the functionality of Pine Script within a trading context.
Any results from strategies or tools provided are hypothetical, and past performance is not indicative of future results. Trading and investing involve high risk, including the potential loss of principal, and may not be suitable for all individuals. Before making any trading decisions, please consult with a qualified financial professional to understand the risks involved.
By using this script, you acknowledge and agree that any trading decisions are made solely at your discretion and risk.
Enhance your trading precision and confidence 🚀
Happy trading
Chervolino

Contrarian 100 MAPairs nicely with Enhanced-Stock-Ticker-with-50MA-vs-200MA located here:
Description
The Contrarian 100 MA is a sophisticated Pine Script v6 indicator designed for traders seeking to identify key market structure shifts and trend reversals using a combination of a 100-period Simple Moving Average (SMA) envelope and Inner Circle Trader (ICT) Break of Structure (BoS) and Market Structure Shift (MSS) logic. By overlaying a semi-transparent SMA-based shadow on the price chart and plotting bullish and bearish structure signals, this indicator helps traders visualize critical price levels and potential trend changes. It leverages higher timeframe (HTF) pivot points and dynamic logic to adapt to various chart timeframes, making it ideal for swing and contrarian trading strategies. Customizable colors, timeframes, and alert conditions enhance its versatility for manual and automated trading setups.
Key Features
SMA Envelope: Plots a 100-period SMA for high and low prices, creating a semi-transparent (50% opacity) purple shadow to highlight the price range and provide context for price movements.
ICT BoS/MSS Logic: Identifies Break of Structure (BoS) and Market Structure Shift (MSS) signals for both bullish and bearish conditions, based on HTF pivot points.
Dynamic Timeframe Support: Adjusts pivot detection based on user-selected HTF (default: 1D) and chart timeframe (1M, 5M, 15M, 30M, 1H, 4H, 1D), ensuring adaptability across markets.
Visual Signals: Draws dotted lines for BoS (bullish/bearish) and MSS (bullish/bearish) signals at pivot levels, with customizable colors for easy identification.
Contrarian Approach: Signals potential reversals by combining SMA context with ICT structure breaks, ideal for traders looking to capitalize on trend shifts.
Alert Conditions: Supports alerts for bullish/bearish BoS and MSS signals, enabling integration with TradingView’s alert system for automated trading.
Performance Optimization: Uses efficient pivot detection and line management to minimize resource usage while maintaining accuracy.
Technical Details
SMA Calculation:
Computes 100-period SMAs for high (smaHigh) and low (smaLow) prices.
Plots invisible SMAs (fully transparent) and fills the area between them with 50% transparent purple for visual context.
Pivot Detection:
Uses ta.pivothigh and ta.pivotlow to identify HTF swing points, with dynamic lookback periods (rlBars: 5 for daily, 2 for intraday).
Tracks pivot highs (pH, nPh) and lows (pL, nPl) using a custom piv type for price and time.
BoS/MSS Logic:
Bullish BoS: Triggered when price breaks above a pivot high in a bullish trend, drawing a line at the pivot level.
Bearish BoS: Triggered when price breaks below a pivot low in a bearish trend.
Bullish MSS: Occurs when price breaks a pivot high in a bearish trend, signaling a potential trend reversal.
Bearish MSS: Occurs when price breaks a pivot low in a bullish trend.
Lines are drawn using line.new with xloc.bar_time for precise alignment, styled as dotted with customizable colors.
HTF Integration: Fetches HTF close prices and pivot data using request.security with lookahead_on for accurate signal timing.
Line Management: Maintains an array of lines (lin), removing outdated lines when new MSS signals occur to keep the chart clean.
Pivot Reset: Clears broken pivots (e.g., when price exceeds a pivot high or falls below a pivot low) to ensure fresh signal generation.
How to Use
Add to Chart:
Copy the script into TradingView’s Pine Editor and apply it to your chart.
Configure Settings:
SMA Length: Adjust the SMA period (default: 100 bars) to suit your trading style.
Structure Timeframe: Set the HTF for pivot detection (default: 1D).
Chart Timeframe: Select the chart timeframe (1M, 5M, 15M, 30M, 1H, 4H, 1D) to adjust pivot sensitivity.
Colors: Customize bullish/bearish BoS and MSS line colors via input settings.
Interpret Signals:
Bullish BoS: White dotted line (default) at a broken pivot high in a bullish trend, indicating trend continuation.
Bearish BoS: White dotted line at a broken pivot low in a bearish trend.
Bullish MSS: White dotted line at a broken pivot high in a bearish trend, suggesting a reversal to bullish.
Bearish MSS: White dotted line at a broken pivot low in a bullish trend, suggesting a reversal to bearish.
Use the SMA shadow to gauge price position within the recent range.
Set Alerts:
Create alerts for bullish/bearish BoS and MSS signals using TradingView’s alert system.
Customize Visuals:
Adjust line colors or SMA fill transparency via TradingView’s settings for better visibility.
Example Use Cases
Swing Trading: Use MSS signals to enter trades at potential trend reversals, with the SMA envelope confirming price extremes.
Contrarian Trading: Capitalize on BoS and MSS signals to trade against prevailing trends, using the SMA shadow for context.
Automated Trading: Integrate BoS/MSS alerts with trading bots for systematic entries and exits.
Multi-Timeframe Analysis: Combine HTF signals (e.g., 1D) with lower timeframe charts (e.g., 1H) for precise entries.
Notes
Testing: Backtest the indicator on your chosen market and timeframe to validate performance.
Compatibility: Built for Pine Script v6 and tested on TradingView as of June 19, 2025.
Limitations: Signals rely on HTF pivot accuracy, which may lag in fast-moving markets. Adjust rlBars or timeframe for sensitivity.
Optional Enhancements: Consider uncommenting or adding a histogram for SMA divergence (e.g., smaHigh - smaLow) for additional insights.
Acknowledgments
This indicator combines ICT’s market structure concepts with a dynamic SMA envelope to provide a unique contrarian trading tool. Share your feedback or suggestions in the TradingView comments, and happy trading!

Timeframe Titans: Market Structure & MTF Order Blocks🟩 OVERVIEW
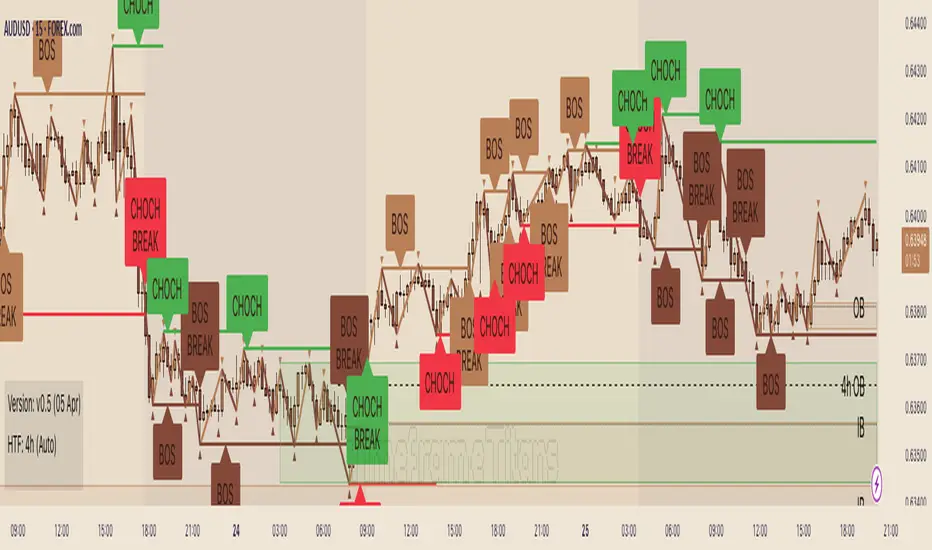
A combined market structure and order block indicator. Displays fractals, zigzags, Break Of Structure and Change Of Character lines. Shows order blocks on the chart and a higher timeframe.
Unique features include:
• The structure rules require counter fractals for BOS. This enables us to use more responsive fractal settings without creating excessive noise.
• Structure is strict. After the initial CHoCH there is always one and only one active CHoCH line.
• Order blocks can be filtered by market structure.
• Order blocks are based entirely on candle patterns (which appear to be unique among all the indicators we tested) instead of using pivots or other configurable calculations.
• Order blocks have separate mitigation levels, not merely the edge of the block, and being partially mitigated is a separate logical state.
🟩 WHAT IS MARKET STRUCTURE?
There are many ways to conceptualise and code market structure — the prevailing trend derived from important price levels. All of them start with identifying highs and lows in price, then use breaks of those levels to assign a trend.
This indicator displays the following market structure features:
• Williams Fractals to derive high and low pivots.
• Zigzag lines, which connect highs and lows.
• Break of Structure (BOS) lines, which are formed from the highest high in an *uptrend* or the lowest low in a *downtrend*. A break of a BOS line signals trend continuation.
• Change of Character (CHoCH) lines, which are formed from the highest high in a *downtrend* or the lowest low in an *uptrend*. A break of a CHoCH line signals trend reversal.
• Market structure bias, which is derived from the break of a CHoCH line. If a CHoCH line is broken to the upside, the trend is bullish, and if to the downside, bearish.
(For more details of the market structure features of this indicator, see the FEATURES OF THIS INDICATOR section.)
This definition of market structure implies that:
• There can only ever be one single active BOS line.
• There can only ever be one single active CHoCH line.
• A break of a BOS line creates a new CHoCH line.
• A break of a CHoCH line creates a new bias, a new BOS line, and a new CHoCH line.
• Before we can create a BOS, we need to know the bias, for which we need the CHoCH, for which we need BOS... just one of the chicken-vs-egg difficulties of coding market structure.
To understand how this indicator differs from other market structure indicators, see the COMPARISON WITH OTHER INDICATORS section.
🟩 WHAT ARE ORDER BLOCKS?
Order blocks are candle patterns that appear at highs and lows. The theory is that these areas are where many orders were filled — too many for the order book, causing an imbalance in buyers and sellers. As such, these areas can form support or resistance levels when price returns to them.
This indicator displays the following features related to order blocks:
• Imbalances, also called Fair Value Gaps.
• Order blocks of two different types (Imbalance Block and Standard Order Blocks)
(For more details of the order block features of this indicator, see the FEATURES OF THIS INDICATOR section.)
There are different patterns that can define order blocks, but the common element is that price should move vigorously away from the area after the pattern forms.
To understand how this indicator differs from other order block indicators, see the COMPARISON WITH OTHER INDICATORS section.
🟩 FEATURES OF THIS INDICATOR
Pivots
Shows Williams high and low fractals, with a configurable lookback. The pivots are always calculated, since they are the building block of all other market structure features. The pivot shape display can be turned on or off, and the display customised.
Zigzag
Draws lines between the highs and lows. The lines can be shown or hidden, and the colour and thickness configured.
Break of Structure
BOS lines are always calculated, but can be shown or hidden. The appearance can be customised. BOS lines are drawn from the candle that has the high or low that defines their level. They always extend until they are broken or the bias changes. The BOS lines have an optional, configurable label. When a BOS line is broken, an optional, configurable label is drawn on that bar.
Change of Character
CHoCH lines can be shown, hidden, and customised. CHoCH lines always extend until they are broken or a new CHoCH line is formed. CHoCH lines have optional labels. A different, customisable label is drawn when a CHoCH line is broken.
Market structure bias
Market structure bias is derived from the break of a CHoCH line. If a CHoCH line is broken to the upside, the trend is bullish, and if to the downside, bearish. The background is shaded a configurable colour based on the trend.
Imbalances
Imbalances are drawn in configurable colours. When they are mitigated, you can choose to change the colour, delete them, or leave them.
Order blocks
Two types of imbalance order blocks are displayed: Standard Order Blocks and Imbalance Blocks. They can be shown or hidden, and customised, independently.
Each order block has a mitigation line with configurable colours and style. If price exceeds the mitigation line, the order block is mitigated and is considered inactive.
The order blocks, or their labels, can be deleted when the order block is mitigated. If not deleted, their colour is changed and they no longer extend with each new bar.
Order blocks on the chart timeframe can be shown conditionally within the context of the market structure: you can choose to show:
• Pro-trend order blocks (bearish order blocks that were created in bearish market structure and vice-versa).
• Counter-trend order blocks (bearish order blocks that were created in bullish market structure and vice-versa).
• All order blocks.
Higher timeframe
Imbalances and order blocks can be independently shown and customised on a single higher timeframe. The HTF functions of this indicator do not repaint because they use confirmed data.
You can choose a custom, fixed higher timeframe, or an "Auto" mode where the script automatically chooses the higher timeframe based on the chart timeframe.
Script information messages
An optional table shows information about the script, including configuration problems, such as if a custom HTF is not actually higher than the chart timeframe.
🟩 HOW TO USE
There are very many ways to use market structure and order blocks in trading and we recommend you study extensively, and if possible get a trusted mentor.
Here is a random example we found on the recent GBPUSD chart. In the screenshot below, the left chart is at 30m and the right is at 5m. We've toggled various settings to make the chart clearer for demonstration purposes.
1 — We get a CHoCH break on the higher timeframe. So our bias (if we are trying to trade with the trend) is bearish. Now we look for some other confluence.
2 — Price revisits the top of the range and mitigates an imbalance block. It wicks the CHoCH (resetting it) but does not break it on close. The bearish market structure is thus preserved. For these reasons, we're thinking about a short, and we switch to the 5m chart on the right to find an entry. We've chosen a Custom HTF of 30m to match the left chart and we can see the mitigated HTF order block, marked "30m IB". We can see when price moves definitively out of the order block area to the downside.
3 — A bearish order block is formed and very quickly price comes back into it. We could enter a short here with a stop above the closest relevant fractal.
4 — Another bearish order block forms and price retests it. Another entry. Two previous 5m bullish order blocks at the bottom of the chart act as support. We could potentially close our short here.
5 — Another test of the same block, which was not mitigated the first time. Another potential short entry. As it happens, price makes a massive run lower here, such that we could trail our stop down one ATR above every single high fractal (marked out using manual rays and a public ATR indicator) for a good R:R, but that's not the point.
This is a made-up, retrofitted example with a fairly generic methodology. It's just to show how some of the features of this indicator could be used in trading:
• Market structure can give a bias. It can also mark interesting levels.
• Using multiple timeframes, while more complex, can level up your trading experience.
• Price trading back into order blocks can be a good R:R entry.
Your actual way of trading, your playbook of setups, your knowledge of your strengths and weakness as a trader, is your own.
🟩 LIMITATIONS
This indicator is intended for use on Forex markets, although order blocks and market structure do form on any reasonably liquid asset.
The HTF uses confirmed data, so you need to wait until the HTF bar is closed before the order block can form. Therefore it does not repaint, in the sense that people worry about repainting, of changing data in the past. We use the latest recommended method of fetching HTF data .
The market structure uses live chart data, so structure and order blocks that are created by conditions on an open realtime bar can appear and disappear as the current bar close changes. This is quite normal .
The Williams pivots are by definition only confirmed after a defined number of bars, and like everyone else we plot them offset into the past.
Similarly, we offset order blocks into the past so that they start on the candle that has the high or low that defines the order block, not the candle that created them. For HTF order blocks, we calculate the number of chart bars back assuming a 24-hour market, which gives accurate offsets only on Forex and other symbols that trade close to 24 hours each day.
🟩 COMPARISON WITH OTHER INDICATORS
There are a great number of market structure and order block indicators already published on TradingView. Since there are only a certain number of highs and lows on the chart from which to produce structure and order blocks, they all look somewhat similar. However, this indicator, written entirely from scratch without reference to the code of any other indicators, is unique and original in two kinds of ways: in patterns and in features.
PRECISE PATTERNS
We believe that edge in trading can be found in, amongst other things, precision in analysis. You can't truly trust your backtests if your system is not repeatable, and your system is repeatable only if its definitions are precise.
We trade with this indicator, and our students trade with it as well. Why did we spend months creating a new indicator instead of using one of the many existing ones, most of which are free and open source?
Because they are not quite how we wanted.
The indicator was created from our proprietary structure rules, which are based on the generally accepted understanding of market structure, with some specific tweaks.
To prepare this description (after the indicator is finished), we searched for "Market Structure", "CHoCH", and "SMC" and list below all popular (with over 3K boosts; excluding invite-only) indicators that show market structure with CHoCH (sometimes called MSS). We configured the settings to most closely match how our indicator works, added both indicators to the same chart, and looked for relevant differences.
The purpose of this section is not to try to say that this indicator is better than any other, but just that it is different. This difference is important for us and our students.
Indicator #1
As you can see, the indicator interpreted the first part of the chart as a downtrend, whereas ours interpreted it as an uptrend. The structure is completely different, because our Williams Fractal lookback is 2, and the minimum "Swing Points" value for Indicator #1 is 10. Although this indicator is deservedly popular, it isn't what we can use for the way we trade.
Indicator #2
Setting the "Zigzag Length" to 2 results in wildly different market structure, as shown below. For many fractals, this indicator does not place the zigzag at the highest high or lowest low, as ours does consistently. It does not highlight the trend in any way. It gives many Market Structure Breaks in a short period. Although it's again wildly popular, it doesn't match our way of encoding market structure.
Indicator #3
Again, setting the "Pivot lb" and "Pivot rb" inputs to 2 gives much too sensitive market structure. This is because this indicator does not require, as we do, a counter-fractal to form after a fractal in order to confirm a BOS. We believe that this rule gives less noisy structure while also being responsive. Most indicators attempt to compensate for this by having a much larger lookback period. While this does of course give fewer pivots and less noise, this is simply a different logic and gives different results. Note also that although this indicator correctly defines the first section of the chart as an uptrend, it does not draw a CHoCH line. As discussed above, our definition of market structure means that there should always be one and only one active CHoCH line, and we draw this at the earliest sensible opportunity.
Indicator #4
Again, the lack of any extra pivot confirmation logic means that this indicator creates different structure with the same lookback period. Also note the lack of initial CHoCH.
Indicator #5
The lowest lookback is 3, and so this indicator too gives very different structure.
Indicator #6
Of course, using a lookback of 2 gives different structure with this indicator too. For variety, here we show a lookback of 5, which is the lowest setting that returns significantly less noisy structure. You can see that the main CHoCH at the top of the chart is similar but not at the same place. Increasing the lookback does not ever result in a CHoCH at the same place, because the logic is simply different. When the lookback increases above 10, no CHoCH lines are drawn at the top at all.
Indicator #7
This indicator uses the highest/lowest price for the last 10 bars (fixed), along with some other bar conditions. You can see the resulting structure is quite different. Among other differences, it does not create a BOS at the top of the chart, even in an uptrend, and it does not create an opposing CHoCH when the existing CHoCH is broken.
Indicator #8
With "Custom" market structure and a length of 2, BOS and CHoCH lines are drawn by this indicator but in incongruous places.
Conclusion
Although we only illustrate the top few alternatives, we did check many, many others.
These market structure indicators may produce useful output, but their structure differs significantly from ours. We didn't even need to get into specific examples because the general approaches are so different. It is up to the user to decide which indicator, and which interpretation of market structure, best suits their needs.
ORDER BLOCKS
Continuing, we illustrate differences with the most popular order block indicators, trying to get them to match our order blocks. Note that some of these are also in the previous list as market structure indicators.
Order blocks are always formed at swings when price moves away with force, so they will be sort of the same across all the very many existing order block indicators. We are looking for precision and differentiation, as we did with market structure.
Indicator #1
This indicator does not have ability to display mitigated order blocks, only active ones. The order blocks do not match at all.
Indicator #2
With a period of 2, this indicator marks many of the same order blocks as ours. It doesn't extend the blocks, and doesn't mark them when mitigated. The logic for choosing the order block candle is also clearly different.
Indicator #3
Even with very sensitive settings, this indicator did not create as many order blocks as ours and they are quite different.
Indicator #4
Again you can see the logic for choosing candles and creating blocks is simply different. This indicator has inadequate protection against empty arrays, which causes runtime errors on charts with not much history (not a problem for Forex charts in general, but noticeable on the testing chart).
Indicator #5
We were unable to get the order blocks to extend with this indicator, although it should be possible. Anyway the blocks are wildly different.
Indicator #6
Even with the most sensitive settings, this indicator showed only one order block on our test chart.
Indicator #7
This indicator incorporates complex price action concepts. Nevertheless, the order blocks are very different indeed.
Indicator #8
This indicator forms quite different blocks to ours. It has several interesting settings including a choice of using the candle body or wick.
Indicator #9
We were not able to configure this indicator to produce the same order blocks as ours.
Indicator #10
On very sensitive settings, this indicator matches many of our order blocks, but at the same time many are different.
Conclusion
None of the indicators tested here (nor the many others we looked at previously) use the same logic as ours. The differences are so obvious that we don't have to call out individual blocks and analyse how they differ.
Fundamentally, other indicators seem to use variable precision for pivots in their order block detection calculations. Our order blocks are pure candle patterns with two different rulesets for Standard Order Blocks and Imbalance Order Blocks, and this logic does not change.
Note that our order blocks do not always automatically extend to the swing high or low, nor allow the user to choose the limit of the block, but use unique rules.
In summary, our indicator differs from other order block indicators in terms of fundamental detection logic, candle placement, boundary definition, mitigation levels, and logical states (see below).
UNIQUE COMBINATION OF FEATURES
In comparison to all other indicators we looked at, our indicator:
• Uses order blocks with three states: active, mitigated, and partially mitigated. Our mitigation lines for order blocks are rules-based. If price touches the mitigation line, the order block is considered fully mitigated. If price goes inside the order block but does not hit the mitigation line, it is only partially mitigated. These three states are visually distinguished.
• Has the most extensive visual customisation options of all those we looked at. We believe that being able to customise how you see indicator outputs is very important for reducing mental load while analysing and trading.
• Has a unique feature that combines market structure and order blocks, where the user can choose to show pro-trend order blocks (bullish blocks that are formed in bullish structure and vice-versa) or counter-trend blocks (bullish blocks that are formed in bearish structure and vice-versa).
• Approximates an initial trend bias very quickly, so we can start creatng BOS, CHoCH, etc.
• Requires a counter pivot to confirm a BOS line. This seemingly small logical step actually creates very different structure, as we saw in the comparison section.
• Uses a sophisticated array-based sorting mechanism to preserve the selected number of imbalances, use the rest of the TradingView box allowance for order blocks, and delete excess order block objects (not just drawings) in reverse historical order.
• Hides order block drawings if they are a configurable distance away from price. Magically redraws them if price moves closer.
• Includes an equivalent to the system "Calculated bars" setting for the high timeframe, to avoid unnecessary processing and improve performance.
🟩 CODING CONSIDERATIONS
This indicator consists of all original code written by @SimpleCryptoLife for Timeframe_Titans.
AI was used for the following purposes:
• Autocomplete
• Checking that bullish and bearish logic is parallel in a given function
• Querying the names and locations of variables hundreds of lines away when we forgot what they're called, like an expensive search-and-replace
• Help with debugging (it usually makes up elaborate and wrong ideas though)
It was not used to replace the coder's expertise and creativity, or to "vibe-code" some black-box functionality we didn't understand. We can recommend that you use AI the same way.
═════════════════════════════════════════════════════════════
TrendPredator ESThe TrendPredator Essential (ES)
Stacey Burke, a seasoned trader and mentor, developed his trading system over the years, drawing insights from influential figures such as George Douglas Taylor, Tony Crabel, Steve Mauro, and Robert Schabacker. His popular system integrates select concepts from these experts into a consistent framework. While powerful, it is highly discretionary, requiring significant real-time analysis, which can be challenging for novice traders.
The TrendPredator ES indicator supports this approach by automating the essential analysis required to trade the system effectively and incorporating a mechanical bias and multi-timeframe concept.
It provides value to traders by significantly reducing the time needed for session preparation and offering relevant chart analysis and signals for live trading through real-time updates and a unique consolidated table format.
The Stacey Burke Master Pattern
Inspired by Taylor’s 3-day cycle and Steve Mauro’s work with “Beat the Market Maker,” Burke’s system views markets as cyclical, driven by the manipulative patterns of market makers. These patterns often trap traders at the extremes of moves above or below significant levels with peak formations, then reverse to utilize their liquidity, initiating the next phase. Breakouts away from these traps often lead to range expansions, as described by Tony Crabel and Robert Schabacker. After multiple consecutive breakouts, especially after the psychological number three, overextension might develop. A break in structure may then lead to reversals or pullbacks. Burke’s system is designed to track these cycles on the daily timeframe and provides signals and trade setups to navigate along them.
Bias Logic and Multi-Timeframe Concept
The indicator covers the basic signals of his system:
- First Red Day (FRD): Bearish break in structure, signalling weak longs in the market.
- First Green Day (FGD): Bullish break in structure signalling weak shorts in the markt.
- Three Days of Longs (3DL): Overextension signalling potential weak longs in the market.
- Three Days of Shorts (3DS): Overextension signalling potential weak shorts in the market.
- Inside Day (ID): Contraction, signalling potential impulsive reversal or range expansion move.
It enhances the original system by introducing:
Structured Bias Logic:
Tracks bias by following how price trades concerning the last previous candle high or low that was hit. For example if the high was hit, we are bullish above and bearish below.
- Bullish state: Breakout (BO), Fakeout Low (FOL)
- Bearish state: Breakdown (BD), Fakeout High (FOH)
Multi-Timeframe Perspective:
- Tracks all signals across H4, H8, D, W, and M timeframes, to look for alignment and follow trends and momentum in a mechanical way.
The indicator monitors the bias and signals of the system across all relevant timeframes and automates the related graphical chart analysis to generate the information needed for the trader to identify key setups. Additional to the SB pattern, the system helps to identify the higher timeframe situation and follow the moves driven by other timeframe traders.
Example: Full Bullish Cycle on the Daily Timeframe with Signals
- The Trap/Peak Formation
The market breaks down from a previous day’s and maybe week’s low—potentially after multiple breakdowns—but fails to move lower and pulls back up to form a peak formation low and closes as a first green day.
Signal: Bullish daily and weekly fakeout low; three consecutive breakdown days (1W Curr FOL, 1D Curr FOL, BO 3S).
- Pullback and Consolidation
The next day pulls further up after first green day signal, potentially consolidates inside the previous day’s range.
Signal: Fakeout low and first green day closing as an inside day (1D Curr IS, Prev FOL, First G).
- Range Expansion/Trend
The following day breaks up through the previous day’s high, launching a range expansion away from the trap.
Signal: Bullish daily breakout of an inside day (1D Curr BO, Prev IS).
- Overextension
After multiple consecutive breakouts, the market reaches a state of overextension, signalling a possible reversal or pullback.
Signal: Three days of breakout longs (1D Curr BO, Prev BO, BO 3L).
Note: This is only one possible scenario; there are many variations and combinations.
Example Chart: Full Bullish Cycle with Correlated Signals
Note: The signals shown along the move are manually added illustrations. The indicator shows these in realtime in the table at the bottom right. This is only one possible scenario; there are many variations and combinations.
Due to the fractal nature of markets, this cycle can be observed across timeframes. The strongest setups show multi-timeframe alignment. For example, a peak formation and potential reversal on the daily timeframe has high probability and follow-through if it also aligns with bearish signals on higher timeframes (e.g., weekly/monthly BD/FOH) and confirmation on lower timeframes (H4/H8 FOH/BD). With this perspective the system enables the trader to follow the trend and momentum and identify rollover points in a very differentiated way.
Detailed Features and Options
1. Historic Highs and Lows
Displays historic highs and lows per timeframe for added context, enabling users to track sequences over time.
Timeframes: H4, H8, D, W, M
Options: Customize for timeframes shown, number of historic candles per timeframe, colors, formats, and labels.
2. Previous High and Low Extensions
Displays extended previous levels (high, low, and close) for each timeframe to assess how price trades relative to these levels.
H4: P4H, P4L, P4C
H8: P8H, P8L, P8C
Daily: PDH, PDL, PDC
Weekly: PWH, PWL, PWC
Monthly: PMH, PML, PMC
Options: Fully customizable for timeframes shown, colors, formats, and labels.
3. Breach Lines
Tracks live market reactions (e.g., breakouts or fakeouts) per timeframe for the last previous high or low that was hit, highlighting these levels originating at the breached candle to indicate bias (color-coded).
Red: Bearish below
Green: Bullish above
H4: 4FOL, 4FOH, 4BO, 4BD
H8: 8FOL, 8FOH, 8BO, 8BD
D: dFOL, dFOH, dBO, dBD
W: wFOL, wFOH, wBO, wBD
M: mFOL, mFOH, mBO, mBD
Options: Fully customizable for timeframes shown, colors, formats, and labels.
4. Multi-Timeframe Table
Provides a real-time view of system signals, including:
Current Timeframe (Curr): Bias states.
- Breakout (green BO): Bullish after breaking above the previous high.
- Fakeout High (red FOH): Bearish after breaking above the previous high but pulling back down.
- Breakdown (red BD): Bearish after breaking below the previous low.
- Fakeout Low (green FOL): Bullish after breaking below the previous low but pulling back up.
- Inside (IS): Price trading neutral inside the previous range, taking the previous bias (color indicates the previous bias).
Previous Timeframe (Prev): Tracks last candle bias state and transitions dynamically.
- Bias for last candle: BO, FOH, BD, FOL in respective colors.
- Inside bar (yellow IS): Indicated as standalone signal.
Note: Also previous timeframes get constantly updated in real time to track the bias state in relation to the level that was hit. This means a BO can still lose the level and become a FOH, and vice versa, and a BD can still become a FOL, and vice versa. This is critical to see for example if traders that are trapped in that timeframe with a FOH or FOL are released. An inside bar stays fixed, though, since no level was hit in that timeframe.
Breakouts (BO): Breakout count 3 longs and 3 shorts.
- 3 Longs (red 3L): Bearish after three breakouts without hitting a previous low.
- 3 Shorts (green 3S): Bullish after three breakdowns without hitting a previous high.
First Countertrend Close (First): Tracks First Red or Green Day.
- First Green (G): After two consecutive red closes.
- First Red (R): After two consecutive green closes.
Options: Customizable font size and label colors.
Overall Options:
Toggle single feature groups on/off.
Customize H8 open/close time as an offset to UTC to be provider independent.
Colour settings for dark or bright backgrounds.
Using the Indicator for Trading
The automated analysis provided by the indicator can be used for thesis generation in preparation for a session as well as for live trading, leveraging the real-time updates. It is recommended to customize the settings accordingly, such as hiding the lower timeframes for thesis generation to keep the charts clean.
1. Setup Identification:
Follow the bias of daily and H8 timeframes. A setup always requires alignment of these.
Setup Types:
- Trend Trade: Trade in alignment with the previous day’s trend.
Example: Price above the previous day’s high → Focus on long setups (dBO, H8 FOL) until overextension or reversal signs appear (H8 BO 3L, First R).
- Reversal Trade: Identify reversal setups when lower timeframes show rollovers after higher timeframe weakness.
Example: Price below the previous day’s high after FOH → Look for reversal signals at the current high of day (H8 FOH, BO 3L, First R).
2. Context Assessment:
Evaluate alignment of higher timeframes (e.g., Month/Week, Week/Day). More alignment → Stronger setups. Conflicting situations → Setups invalidated.
3. Entry Confirmation:
Confirm entries based on H8 and H4 alignment and candle closes (e.g., M15 or M5 close after entering setup zone as confirmation).
Example Chart for Reversal Trade:
1. Setup Identification: FOH continuation after BO 3L overextension, confirmed by H8 FOH, First R.
2. Context Assessment: Month in FOL with bearish First R; Week in BO but bearishly overextended with BO 3L.
3. Entry Confirmation: H4 BD, M5 close.
Further recommendations:
- Higher timeframe context: TPO or volume profile indicators can be used to gain an even better overview.
- Entry confirmation: Momentum indicators like VWAP, Supertrend, or EMA are helpful for increasing precision. Additionally, tracking lower timeframe fakeouts can provide powerful confluence.
- Late session trading: Entries later in the session, such as during the 3rd hour of the NY session, offer better analysis and follow-through on setups.
Limitations:
Data availability using TradingView has its limitations. The indicator leverages only the real-time data available for the specific timeframe being used. This means it cannot access data from timeframes lower than the one displayed on the chart. For example, if you are on a daily chart, it cannot use H8 data. Additionally, on very low timeframes, the historical availability of data might be limited, making higher timeframe signals unreliable.
To address this, the indicator automatically hides the affected columns in these specific situations, preventing false signals.
Disclaimer
This indicator is for educational purposes only and does not guarantee profits.
None of the information provided shall be considered financial advice.
The indicator does not provide final buy or sell signals but highlights zones for potential setups.
Users are fully responsible for their trading decisions and outcomes.

lib_smcLibrary "lib_smc"
This is an adaptation of LuxAlgo's Smart Money Concepts indicator with numerous changes. Main changes include integration of object based plotting, plenty of performance improvements, live tracking of Order Blocks, integration of volume profiles to refine Order Blocks, and many more.
This is a library for developers, if you want this converted into a working strategy, let me know.
buffer(item, len, force_rotate)
Parameters:
item (float)
len (int)
force_rotate (bool)
buffer(item, len, force_rotate)
Parameters:
item (int)
len (int)
force_rotate (bool)
buffer(item, len, force_rotate)
Parameters:
item (Profile type from robbatt/lib_profile/32)
len (int)
force_rotate (bool)
swings(len)
INTERNAL: detect swing points (HH and LL) in given range
Parameters:
len (simple int) : range to check for new swing points
Returns: values are the price level where and if a new HH or LL was detected, else na
method init(this)
Namespace types: OrderBlockConfig
Parameters:
this (OrderBlockConfig)
method delete(this)
Namespace types: OrderBlock
Parameters:
this (OrderBlock)
method clear_broken(this, broken_buffer)
INTERNAL: delete internal order blocks box coordinates if top/bottom is broken
Namespace types: map
Parameters:
this (map)
broken_buffer (map)
Returns: any_bull_ob_broken, any_bear_ob_broken, broken signals are true if an according order block was broken/mitigated, broken contains the broken block(s)
create_ob(id, mode, start_t, start_i, top, end_t, end_i, bottom, break_price, early_confirmation_price, config, init_plot, force_overlay)
INTERNAL: set internal order block coordinates
Parameters:
id (int)
mode (int) : 1: bullish, -1 bearish block
start_t (int)
start_i (int)
top (float)
end_t (int)
end_i (int)
bottom (float)
break_price (float)
early_confirmation_price (float)
config (OrderBlockConfig)
init_plot (bool)
force_overlay (bool)
Returns: signals are true if an according order block was broken/mitigated
method align_to_profile(block, align_edge, align_break_price)
Namespace types: OrderBlock
Parameters:
block (OrderBlock)
align_edge (bool)
align_break_price (bool)
method create_profile(block, opens, tops, bottoms, closes, values, resolution, vah_pc, val_pc, args, init_calculated, init_plot, force_overlay)
Namespace types: OrderBlock
Parameters:
block (OrderBlock)
opens (array)
tops (array)
bottoms (array)
closes (array)
values (array)
resolution (int)
vah_pc (float)
val_pc (float)
args (ProfileArgs type from robbatt/lib_profile/32)
init_calculated (bool)
init_plot (bool)
force_overlay (bool)
method create_profile(block, resolution, vah_pc, val_pc, args, init_calculated, init_plot, force_overlay)
Namespace types: OrderBlock
Parameters:
block (OrderBlock)
resolution (int)
vah_pc (float)
val_pc (float)
args (ProfileArgs type from robbatt/lib_profile/32)
init_calculated (bool)
init_plot (bool)
force_overlay (bool)
track_obs(swing_len, hh, ll, top, btm, bull_bos_alert, bull_choch_alert, bear_bos_alert, bear_choch_alert, min_block_size, max_block_size, config_bull, config_bear, init_plot, force_overlay, enabled, extend_blocks, clear_broken_buffer_before, align_edge_to_value_area, align_break_price_to_poc, profile_args_bull, profile_args_bear, use_soft_confirm, soft_confirm_offset, use_retracements_with_FVG_out)
Parameters:
swing_len (int)
hh (float)
ll (float)
top (float)
btm (float)
bull_bos_alert (bool)
bull_choch_alert (bool)
bear_bos_alert (bool)
bear_choch_alert (bool)
min_block_size (float)
max_block_size (float)
config_bull (OrderBlockConfig)
config_bear (OrderBlockConfig)
init_plot (bool)
force_overlay (bool)
enabled (bool)
extend_blocks (simple bool)
clear_broken_buffer_before (simple bool)
align_edge_to_value_area (simple bool)
align_break_price_to_poc (simple bool)
profile_args_bull (ProfileArgs type from robbatt/lib_profile/32)
profile_args_bear (ProfileArgs type from robbatt/lib_profile/32)
use_soft_confirm (simple bool)
soft_confirm_offset (float)
use_retracements_with_FVG_out (simple bool)
method draw(this, config, extend_only)
Namespace types: OrderBlock
Parameters:
this (OrderBlock)
config (OrderBlockConfig)
extend_only (bool)
method draw(blocks, config)
INTERNAL: plot order blocks
Namespace types: array
Parameters:
blocks (array)
config (OrderBlockConfig)
method draw(blocks, config)
INTERNAL: plot order blocks
Namespace types: map
Parameters:
blocks (map)
config (OrderBlockConfig)
method cleanup(this, ob_bull, ob_bear)
removes all Profiles that are older than the latest OrderBlock from this profile buffer
Namespace types: array
Parameters:
this (array type from robbatt/lib_profile/32)
ob_bull (OrderBlock)
ob_bear (OrderBlock)
_plot_swing_points(mode, x, y, show_swing_points, linecolor_swings, keep_history, show_latest_swings_levels, trail_x, trail_y, trend)
INTERNAL: plot swing points
Parameters:
mode (int) : 1: bullish, -1 bearish block
x (int) : x-coordingate of swing point to plot (bar_index)
y (float) : y-coordingate of swing point to plot (price)
show_swing_points (bool) : switch to enable/disable plotting of swing point labels
linecolor_swings (color) : color for swing point labels and lates level lines
keep_history (bool) : weater to remove older swing point labels and only keep the most recent
show_latest_swings_levels (bool)
trail_x (int) : x-coordinate for latest swing point (bar_index)
trail_y (float) : y-coordinate for latest swing point (price)
trend (int) : the current trend 1: bullish, -1: bearish, to determine Strong/Weak Low/Highs
_pivot_lvl(mode, trend, hhll_x, hhll, super_hhll, filter_insignificant_internal_breaks)
INTERNAL: detect whether a structural level has been broken and if it was in trend direction (BoS) or against trend direction (ChoCh), also track the latest high and low swing points
Parameters:
mode (simple int) : detect 1: bullish, -1 bearish pivot points
trend (int) : current trend direction
hhll_x (int) : x-coordinate of newly detected hh/ll (bar_index)
hhll (float) : y-coordinate of newly detected hh/ll (price)
super_hhll (float) : level/y-coordinate of superior hhll (if this is an internal structure pivot level)
filter_insignificant_internal_breaks (bool) : if true pivot points / internal structure will be ignored where the wick in trend direction is longer than the opposite (likely to push further in direction of main trend)
Returns: coordinates of internal structure that has been broken (x,y): start of structure, (trail_x, trail_y): tracking hh/ll after structure break, (bos_alert, choch_alert): signal whether a structural level has been broken
_plot_structure(x, y, is_bos, is_choch, line_color, line_style, label_style, label_size, keep_history)
INTERNAL: plot structural breaks (BoS/ChoCh)
Parameters:
x (int) : x-coordinate of newly broken structure (bar_index)
y (float) : y-coordinate of newly broken structure (price)
is_bos (bool) : whether this structural break was in trend direction
is_choch (bool) : whether this structural break was against trend direction
line_color (color) : color for the line connecting the structural level and the breaking candle
line_style (string) : style (line.style_dashed/solid) for the line connecting the structural level and the breaking candle
label_style (string) : style (label.style_label_down/up) for the label above/below the line connecting the structural level and the breaking candle
label_size (string) : size (size.small/tiny) for the label above/below the line connecting the structural level and the breaking candle
keep_history (bool) : weater to remove older swing point labels and only keep the most recent
structure_values(length, super_hh, super_ll, filter_insignificant_internal_breaks)
detect (and plot) structural breaks and the resulting new trend
Parameters:
length (simple int) : lookback period for swing point detection
super_hh (float) : level/y-coordinate of superior hh (for internal structure detection)
super_ll (float) : level/y-coordinate of superior ll (for internal structure detection)
filter_insignificant_internal_breaks (bool) : if true pivot points / internal structure will be ignored where the wick in trend direction is longer than the opposite (likely to push further in direction of main trend)
Returns: trend: direction 1:bullish -1:bearish, (bull_bos_alert, bull_choch_alert, top_x, top_y, trail_up_x, trail_up): whether and which level broke in a bullish direction, trailing high, (bbear_bos_alert, bear_choch_alert, tm_x, btm_y, trail_dn_x, trail_dn): same in bearish direction
structure_plot(trend, bull_bos_alert, bull_choch_alert, top_x, top_y, trail_up_x, trail_up, hh, bear_bos_alert, bear_choch_alert, btm_x, btm_y, trail_dn_x, trail_dn, ll, color_bull, color_bear, show_swing_points, show_latest_swings_levels, show_bos, show_choch, line_style, label_size, keep_history)
detect (and plot) structural breaks and the resulting new trend
Parameters:
trend (int) : crrent trend 1: bullish, -1: bearish
bull_bos_alert (bool) : if there was a bullish bos alert -> plot it
bull_choch_alert (bool) : if there was a bullish choch alert -> plot it
top_x (int) : latest shwing high x
top_y (float) : latest swing high y
trail_up_x (int) : trailing high x
trail_up (float) : trailing high y
hh (float) : if there was a higher high
bear_bos_alert (bool) : if there was a bearish bos alert -> plot it
bear_choch_alert (bool) : if there was a bearish chock alert -> plot it
btm_x (int) : latest swing low x
btm_y (float) : latest swing low y
trail_dn_x (int) : trailing low x
trail_dn (float) : trailing low y
ll (float) : if there was a lower low
color_bull (color) : color for bullish BoS/ChoCh levels
color_bear (color) : color for bearish BoS/ChoCh levels
show_swing_points (bool) : whether to plot swing point labels
show_latest_swings_levels (bool) : whether to track and plot latest swing point levels with lines
show_bos (bool) : whether to plot BoS levels
show_choch (bool) : whether to plot ChoCh levels
line_style (string) : whether to plot BoS levels
label_size (string) : label size of plotted BoS/ChoCh levels
keep_history (bool) : weater to remove older swing point labels and only keep the most recent
structure(length, color_bull, color_bear, super_hh, super_ll, filter_insignificant_internal_breaks, show_swing_points, show_latest_swings_levels, show_bos, show_choch, line_style, label_size, keep_history, enabled)
detect (and plot) structural breaks and the resulting new trend
Parameters:
length (simple int) : lookback period for swing point detection
color_bull (color) : color for bullish BoS/ChoCh levels
color_bear (color) : color for bearish BoS/ChoCh levels
super_hh (float) : level/y-coordinate of superior hh (for internal structure detection)
super_ll (float) : level/y-coordinate of superior ll (for internal structure detection)
filter_insignificant_internal_breaks (bool) : if true pivot points / internal structure will be ignored where the wick in trend direction is longer than the opposite (likely to push further in direction of main trend)
show_swing_points (bool) : whether to plot swing point labels
show_latest_swings_levels (bool) : whether to track and plot latest swing point levels with lines
show_bos (bool) : whether to plot BoS levels
show_choch (bool) : whether to plot ChoCh levels
line_style (string) : whether to plot BoS levels
label_size (string) : label size of plotted BoS/ChoCh levels
keep_history (bool) : weater to remove older swing point labels and only keep the most recent
enabled (bool)
_check_equal_level(mode, len, eq_threshold, enabled)
INTERNAL: detect equal levels (double top/bottom)
Parameters:
mode (int) : detect 1: bullish/high, -1 bearish/low pivot points
len (int) : lookback period for equal level (swing point) detection
eq_threshold (float) : maximum price offset for a level to be considered equal
enabled (bool)
Returns: eq_alert whether an equal level was detected and coordinates of the first and the second level/swing point
_plot_equal_level(show_eq, x1, y1, x2, y2, label_txt, label_style, label_size, line_color, line_style, keep_history)
INTERNAL: plot equal levels (double top/bottom)
Parameters:
show_eq (bool) : whether to plot the level or not
x1 (int) : x-coordinate of the first level / swing point
y1 (float) : y-coordinate of the first level / swing point
x2 (int) : x-coordinate of the second level / swing point
y2 (float) : y-coordinate of the second level / swing point
label_txt (string) : text for the label above/below the line connecting the equal levels
label_style (string) : style (label.style_label_down/up) for the label above/below the line connecting the equal levels
label_size (string) : size (size.tiny) for the label above/below the line connecting the equal levels
line_color (color) : color for the line connecting the equal levels (and it's label)
line_style (string) : style (line.style_dotted) for the line connecting the equal levels
keep_history (bool) : weater to remove older swing point labels and only keep the most recent
equal_levels_values(len, threshold, enabled)
detect (and plot) equal levels (double top/bottom), returns coordinates
Parameters:
len (int) : lookback period for equal level (swing point) detection
threshold (float) : maximum price offset for a level to be considered equal
enabled (bool) : whether detection is enabled
Returns: (eqh_alert, eqh_x1, eqh_y1, eqh_x2, eqh_y2) whether an equal high was detected and coordinates of the first and the second level/swing point, (eql_alert, eql_x1, eql_y1, eql_x2, eql_y2) same for equal lows
equal_levels_plot(eqh_x1, eqh_y1, eqh_x2, eqh_y2, eql_x1, eql_y1, eql_x2, eql_y2, color_eqh, color_eql, show, keep_history)
detect (and plot) equal levels (double top/bottom), returns coordinates
Parameters:
eqh_x1 (int) : coordinates of first point of equal high
eqh_y1 (float) : coordinates of first point of equal high
eqh_x2 (int) : coordinates of second point of equal high
eqh_y2 (float) : coordinates of second point of equal high
eql_x1 (int) : coordinates of first point of equal low
eql_y1 (float) : coordinates of first point of equal low
eql_x2 (int) : coordinates of second point of equal low
eql_y2 (float) : coordinates of second point of equal low
color_eqh (color) : color for the line connecting the equal highs (and it's label)
color_eql (color) : color for the line connecting the equal lows (and it's label)
show (bool) : whether plotting is enabled
keep_history (bool) : weater to remove older swing point labels and only keep the most recent
Returns: (eqh_alert, eqh_x1, eqh_y1, eqh_x2, eqh_y2) whether an equal high was detected and coordinates of the first and the second level/swing point, (eql_alert, eql_x1, eql_y1, eql_x2, eql_y2) same for equal lows
equal_levels(len, threshold, color_eqh, color_eql, enabled, show, keep_history)
detect (and plot) equal levels (double top/bottom)
Parameters:
len (int) : lookback period for equal level (swing point) detection
threshold (float) : maximum price offset for a level to be considered equal
color_eqh (color) : color for the line connecting the equal highs (and it's label)
color_eql (color) : color for the line connecting the equal lows (and it's label)
enabled (bool) : whether detection is enabled
show (bool) : whether plotting is enabled
keep_history (bool) : weater to remove older swing point labels and only keep the most recent
Returns: (eqh_alert) whether an equal high was detected, (eql_alert) same for equal lows
_detect_fvg(mode, enabled, o, h, l, c, filter_insignificant_fvgs, change_tf)
INTERNAL: detect FVG (fair value gap)
Parameters:
mode (int) : detect 1: bullish, -1 bearish gaps
enabled (bool) : whether detection is enabled
o (float) : reference source open
h (float) : reference source high
l (float) : reference source low
c (float) : reference source close
filter_insignificant_fvgs (bool) : whether to calculate and filter small/insignificant gaps
change_tf (bool) : signal when the previous reference timeframe closed, triggers new calculation
Returns: whether a new FVG was detected and its top/mid/bottom levels
_clear_broken_fvg(mode, upper_boxes, lower_boxes)
INTERNAL: clear mitigated FVGs (fair value gaps)
Parameters:
mode (int) : detect 1: bullish, -1 bearish gaps
upper_boxes (array) : array that stores the upper parts of the FVG boxes
lower_boxes (array) : array that stores the lower parts of the FVG boxes
_plot_fvg(mode, show, top, mid, btm, border_color, extend_box)
INTERNAL: plot (and clear broken) FVG (fair value gap)
Parameters:
mode (int) : plot 1: bullish, -1 bearish gap
show (bool) : whether plotting is enabled
top (float) : top level of fvg
mid (float) : center level of fvg
btm (float) : bottom level of fvg
border_color (color) : color for the FVG box
extend_box (int) : how many bars into the future the FVG box should be extended after detection
fvgs_values(o, h, l, c, filter_insignificant_fvgs, change_tf, enabled)
detect (and plot / clear broken) FVGs (fair value gaps), and return alerts and level values
Parameters:
o (float) : reference source open
h (float) : reference source high
l (float) : reference source low
c (float) : reference source close
filter_insignificant_fvgs (bool) : whether to calculate and filter small/insignificant gaps
change_tf (bool) : signal when the previous reference timeframe closed, triggers new calculation
enabled (bool) : whether detection is enabled
Returns: (bullish_fvg_alert, bull_top, bull_mid, bull_btm): whether a new bullish FVG was detected and its top/mid/bottom levels, (bearish_fvg_alert, bear_top, bear_mid, bear_btm): same for bearish FVGs
fvgs_plot(bullish_fvg_alert, bull_top, bull_mid, bull_btm, bearish_fvg_alert, bear_top, bear_mid, bear_btm, color_bull, color_bear, extend_box, show)
Parameters:
bullish_fvg_alert (bool)
bull_top (float)
bull_mid (float)
bull_btm (float)
bearish_fvg_alert (bool)
bear_top (float)
bear_mid (float)
bear_btm (float)
color_bull (color) : color for bullish FVG boxes
color_bear (color) : color for bearish FVG boxes
extend_box (int) : how many bars into the future the FVG box should be extended after detection
show (bool) : whether plotting is enabled
Returns: (bullish_fvg_alert, bull_top, bull_mid, bull_btm): whether a new bullish FVG was detected and its top/mid/bottom levels, (bearish_fvg_alert, bear_top, bear_mid, bear_btm): same for bearish FVGs
fvgs(o, h, l, c, filter_insignificant_fvgs, change_tf, color_bull, color_bear, extend_box, enabled, show)
detect (and plot / clear broken) FVGs (fair value gaps)
Parameters:
o (float) : reference source open
h (float) : reference source high
l (float) : reference source low
c (float) : reference source close
filter_insignificant_fvgs (bool) : whether to calculate and filter small/insignificant gaps
change_tf (bool) : signal when the previous reference timeframe closed, triggers new calculation
color_bull (color) : color for bullish FVG boxes
color_bear (color) : color for bearish FVG boxes
extend_box (int) : how many bars into the future the FVG box should be extended after detection
enabled (bool) : whether detection is enabled
show (bool) : whether plotting is enabled
Returns: (bullish_fvg_alert): whether a new bullish FVG was detected, (bearish_fvg_alert): same for bearish FVGs
OrderBlock
Fields:
id (series int)
dir (series int)
left_top (chart.point)
right_bottom (chart.point)
break_price (series float)
early_confirmation_price (series float)
ltf_high (array)
ltf_low (array)
ltf_volume (array)
plot (Box type from robbatt/lib_plot_objects/49)
profile (Profile type from robbatt/lib_profile/32)
trailing (series bool)
extending (series bool)
awaiting_confirmation (series bool)
touched_break_price_before_confirmation (series bool)
soft_confirmed (series bool)
has_fvg_out (series bool)
hidden (series bool)
broken (series bool)
OrderBlockConfig
Fields:
show (series bool)
show_last (series int)
show_id (series bool)
show_profile (series bool)
args (BoxArgs type from robbatt/lib_plot_objects/49)
txt (series string)
txt_args (BoxTextArgs type from robbatt/lib_plot_objects/49)
delete_when_broken (series bool)
broken_args (BoxArgs type from robbatt/lib_plot_objects/49)
broken_txt (series string)
broken_txt_args (BoxTextArgs type from robbatt/lib_plot_objects/49)
broken_profile_args (ProfileArgs type from robbatt/lib_profile/32)
use_profile (series bool)
profile_args (ProfileArgs type from robbatt/lib_profile/32)

Market Structure Overlay🚀 Market Structure Overlay Indicator 🚀
🔍 Overview
The Market Structure Overlay (MSO) is a sophisticated technical analysis tool created to analyze price action and understand market structure in a more precise way. It identifies Break of Structure (BOS), Market Structure Breaks (MSBs), Equal Highs (EQH), and Equal Lows (EQL) with meticulous precision by utilizing both wicks and closing prices for better accuracy. The MSO is suitable for all trading timeframes, providing traders with the flexibility to observe and trade on any scale, from intraday to long-term trends.
⚙️ How It Works
The MSO uses advanced logic to detect critical price levels that highlight structural changes in the market. It calculates swing highs and lows using user-defined settings, allowing for customization in market structure analysis. The indicator further highlights BOS and MSB levels by leveraging supply and demand detection, offering a comprehensive understanding of trend reversals and continuation points.
✨ Key features include:
📈 Bullish and Bearish BOS/MSB Lines: MSO differentiates between bullish and bearish structural events, which helps traders understand the prevailing trend and identify key pivot points.
🎨 Customizable Appearance: Traders can personalize line styles and colors for BOS/MSB, trendlines and EQH/EQL, making the tool integrate seamlessly into any chart setup.
🔄 Swing Length and Demand Memory Settings: MSO allows users to specify the swing length for BOS lookback and how many historical zones should be stored on the chart, enhancing control over how much data is analyzed visually.
📊 Market Structure Elements Explained
Break of Structure (BOS): A BOS occurs when the price breaks through a previous Higher High (HH) or Lower Low (LL), indicating a continuation of the current trend. It helps confirm the prevailing market direction.
Market Structure Break (MSB): occurs when a Higher Low (HL) or Lower High (LH) is broken, signaling a potential shift in the market trend. This typically marks the beginning of a trend reversal.
Equal Highs (EQH) and Equal Lows (EQL): These levels are areas of liquidity where previous highs or lows are tested again by the market, often signifying areas of accumulation or distribution. EQH and EQL are crucial for recognizing potential liquidity traps.
Trendlines: Trendlines are used to connect successive highs or lows, providing a visual representation of the current direction of the market. They help traders understand trend momentum and potential breakouts.
🔥 Key Features and Benefits
✅ Accurate Market Structure Detection
The Market Structure Overlay identifies Break of Structure (BOS) and Market Structure Breaks (MSB) events that indicate potential trend changes or continuations. The indicator also distinguishes between bullish and bearish market structures using color-coded lines and custom labels, which helps in immediately identifying market dynamics.
📊 Supply and Demand Zones for BOS/MSB Detection
The MSO uses Supply and Demand Zones as part of the detection logic for BOS and MSB. Although these zones are not directly plotted, they play a key role in determining when a significant structural break occurs. This unique approach enhances the accuracy of BOS and MSB identification, as it takes into account areas of accumulation or distribution that often serve as precursors to trend shifts.
🔍 Equal Highs and Lows Detection
The MSO features Equal Highs (EQH) and Equal Lows (EQL) detection, which is a significant indicator for liquidity zones where potential orders might be resting. These areas often trigger key price actions as they get tested or broken.
⚙️ Customizable Settings
Users can customize the indicator’s behavior, including choosing whether to use candle wicks or closing prices, setting swing lengths for identifying key levels, and specifying memory for storing past zones. This flexibility allows traders to adjust the indicator to suit their personal trading strategy and preferences.
⏱️ Multi-Timeframe Highs and Lows
The indicator includes multi-timeframe support for significant highs and lows (daily, weekly, monthly, yearly). This helps traders understand where they are in the larger market context, especially when making decisions during intra-session trading.
🔎 Precise Detection Approach
Unlike traditional market structure indicators that rely heavily on simple pivot points, the MSO employs a more advanced and precise detection mechanism for BOS and MSB. Traditional pivot points typically use a lookback function to identify highs and lows over a fixed period, which can lead to false signals due to market noise or temporary price fluctuations. In contrast, the MSO records and checks swing and interim points against stored memory, only signaling structural breaks after a thorough evaluation. This results in a non-repainting and highly accurate depiction of market structure, minimizing false alerts and providing traders with reliable insights based on price action that remains consistent once confirmed.
🎨 Visualization Options
The MSO uses color-coded BOS and MSB lines to easily differentiate between bullish and bearish scenarios. Users also have options to visualize equal highs/lows (EQH/EQL) to recognize potential liquidity points. A detailed breakdown of Supply and Demand Zones helps traders identify high-probability areas for entries and exits. Additionally, the indicator allows traders to toggle visibility of key elements, including trend lines, labels, and multi-timeframe levels.
📝 Summary
The Market Structure Overlay is an essential tool for understanding price behavior and structural shifts in any financial market. Its use of sophisticated logic to detect structural breaks, coupled with customizable visualizations, allows traders to gain a nuanced view of market dynamics. The supply and demand zones, together with the BOS, MSB, EQH, and EQL labels, provide a strong foundation for both trend-following and reversal trading strategies.
MSO is not just a tool for understanding market direction—it's designed to enhance decision-making by delivering reliable and actionable insights into market structure. This indicator provides a seamless blend of market theory with advanced technical features, making it a valuable asset for serious traders.
📊 Key Visual Examples:
📈 Bullish and Bearish BOS/MSB Lines
📸
🌀 Trendlines
📸
⚠️ Note:
This indicator should be used as part of a broader trading strategy. Always confirm your entries and exits with additional tools and analysis methods. 💡

Smart Money Concepts (SMC)Introductions:
Before explaining the functions of this indicator to you, we need to talk about what theoretical knowledge we need to have. Many different price approaches have been developed over the decades with different analysis methods and are still evolving. Some theories used in classical trend analysis methods are interpreted or blended with different perspectives over time and we try to make more successful analyses by having a consistent market reading strategy. While analyzing the classical market structure with the price action method, some issues that are missing and do not fit into place are brought to light with a higher level analysis method known as the smart money concept.
As a result of the research and developments we have done on this subject from many different sources for a long time, I personally think that the most efficient and logical concept is the smart money concept. Of course, no matter which method we use, acting within a risk management and remaining strictly loyal to our conditions should be our first priority so that we can talk about sustainable success in the market. In light of all this, we decided to make an indicator of this concept, which we believe is consistent.
In order to analyze the market structure correctly, we must first draw fractal structures and interpret them correctly. Because the market consists of fractal structures. Regardless of the technique, if we cannot draw fractals correctly or if we make an incorrect interpretation while determining them, our market structure analysis may also be incorrect.
Instead of manually identifying fractal structures, script writers often choose the following method for ease of use; They leave the number of candles to the user's choice, detect the highest and lowest points among x number of candles, and draw fractal structures accordingly, but in fact this is not an accurate detection method. In the visual I have prepared below, you can see how the correct fractal structures should be drawn. Fractal structures should be made based on the previous and next candle levels, not from a certain group of candles.
To identify market structures, we make an interpretation based on these fractal movements.
While classic market structure analysis with traditional price action follows a relatively simpler path as shown in the example below, this situation is a bit more detailed in the smart money concepts.
To explain the situation in the smart money concept in an easily understandable way, it is as follows; imagine an uptrend that progresses by creating levels HH and HL, when the price creates a new HL, we call this point as inducement and we move this level up as each new HL is formed. When drawing structures in this way, when the price falls below the inducement level, the peak is confirmed. To explain it with a different approach, the price must first get liquidity from these last rising bottoms in order to make a break of structure (BOS). The break of structure occurs when the price passes the approved peak. When BOS occurs, the lowest point between this point and the previous peak is defined as the Swing Low and this is the level that needs to be protected in uptrend. When BOS occurs, the last HL point that made this BOS is also defined as inducement and it continues to move as new HL is formed until the new peak is confirmed. If the price somehow "closes" below the Swing Low point that needs to be protected, CHOCH (change of character) has occurred and the trend direction has changed. After CHOCH, we start applying the same logic for the downtrend, the last LH peak formed after is defined as inducement and as the fractal structure continues downward, this level is also carried as the inducement level until the Swing Low level is determined. An important note is; In order for BOS and CHOCH to be valid, "a closing must definitely occur". If it remains in the form of a wick, we call it a liquidity sweep and the end point of this wick is updated as the point where we need to look for a closing in order to be able to say that the BOS or CHOCH level is determined. By the way, We call these liquidity sweep points as "x" in the indicator.
It may be easier to explain this topic with a few sample images that I have shared below.
The thing to consider in the smart money concept is that if you are going to take a long trade in an uptrend, you should wait for the price to fall below the inducement level or if you are going to take a short trade in a downtrend, you should wait for the price to rise above the inducement level and only then look for suitable structures, order flows, order blocks, price gaps and other structures before this are considered traps in this concept. I have some strategies that I personally apply, but since these are my personal preferences, I do not find it right to share them here in order not to affect your opinions, but I am basically careful to act as I stated above.
While preparing this script, we paid attention to the fact that it can be interpreted with a real human eye, provides ease at the speed of machine language and can work extremely flawlessly.
From the first moment we started preparing the script, we went through a long and seriously laborious preparation process that lasted months until now, which we happily share.
We brought this code to life by putting on the table almost everything the user may want in terms of both flawlessly fulfilling the conditions specified by the concept and convenience.
If we touch on the function of the code in order, our code finds the following;
It perfectly identifies the fractals that form the basis of the market structure, within the framework of the rules that I mentioned above, we taught to the script.
According to smart money concepts, as I explained in detail above, it provides great convenience in this regard by skillfully identifying the direction of the market in the time period you are in, rather than traditional methods.
In addition to identifying the direction of the market, it also detects the direction changes taking place in the internal structure. Indicator tries to detect even the slightest direction changes by making a stricter interpretation while determining the trend and bottom-top points in the internal structure. Theoretically, it determines the top point in a downward fractal breakout, and marks the bottom point in an upward fractal breakout.
In this context, it also uniquely identifies the candle flow direction and we can observe it on the table. I explained this issue in the first image about fractal determination, you can read that part again.
When you identify swing structures correctly, you will also determine the area you need to focus on, and we have also included this in the script.
Another one of our favorite features on the chart is that it can show active swing areas live by following the BOS, CHOCH and Inducement lines. So, I believe that this gives it a more professional appearance.
In the light of all these functions, it provides great ease of use while presenting data on the direction of the market in a table not only in the current time frame but also in 6 different time frames that the user can choose according to his/her preference, including seconds timeframes (1 sec., 5 sec., 15 sec., 30 sec. etc.)
In order to speed up the user, it instantly informs the selected parity and all structural changes (Bos, Choch, Inducement, Liquidity Sweeps etc.) that occur on the market structure of this timeframe by setting a single alarm.
In the settings window, you will find the following settings that we have personalized for you:
Main Options;
Fractal Lines box: You can check this box to see whether the fractals that form the basic interpretation structure of the indicator are visible or not.
Swing Lines box: You can use this box to turn on or off the Bos, Choch, Inducement and Liquidity Sweeps lines, which are the main elements of the market structure.
Internal Structures box: You can check this box to observe the H and L points in the internal structure of the graph and therefore the direction in the internal structure.
Live Bos / Choch / Inducement Lines box: You can turn on / off the visibility of the lines belonging to the current and active Bos, Choch and Inducement levels on the chart.
Range Lines box: You can use it to turn on / off the visibility of range lines drawn between the active Swing high and Swing low points on the chart.
Multitimeframe Tables box: It allows you to open and close the table where you can observe the main trend direction of the current parity on the screen, its internal structure and the candle flow direction in 6 different time frames.
Fractal Settings;
In this section, you can choose the colors, style and thickness of the fractal lines as you wish.
Swing Settings;
In this section you can choose the colors of the Swing High and Swing Low points, their shape and size.
Likewise, you can choose the colors, line style, thickness and text size of Bos and Choch lines for bullish and bearish situations.
There are also settings where you can choose the colors, style, line thickness and text size of the Liquidity Sweep and Inducement lines.
Internal Swing Settings;
In this section, you can determine the colors of the High and Low points detected in the internal structure and select the label size, style and thickness of the direction change lines.
Live BOS / CHOCH / IDM Lines;
In this section, you can select the colors, label sizes, line style and thickness of the bos, choch and inducement lines that show the important levels followed in the current status of the chart.
Range Settings;
As mentioned above, you can choose the color, style, thickness of the range lines drawn between the active swing high and swing low points and the size of the price tags of these levels.
Multitimeframe Table Settings;
In this section, there are settings boxes for 6 selectable timeframes, 9 different position alternatives where you can change the position of the table, and a section where you can find 2 different options to express the directions in the table. In addition to these, you will also be able to choose the background color of the table and the color of the text used to express the directions in the table.
We hope that this script will reach a wide audience by becoming a tool that will be used with pleasure and indispensable, while providing convenience to all users, as we have dreamed of and expected from the first moment we started writing it.
DISCLAIMER: No sharing, copying, reselling, modifying, or any other forms of use are authorized for the documents, script / strategy, and the information published with them. This informational planning script / strategy is strictly for individual use and educational purposes only. This is not financial or investment advice. Investments are always made at your own risk and are based on your personal judgement. We are not responsible for any losses you may incur. Please invest wisely.
Best regards and enjoy it.

TrendCraft ICT SwiftEdge// The TrendCraft ICT SwiftEdge is a trend-following indicator that combines Simple Moving Averages (SMAs) with Inner Circle Trader (ICT) concepts, specifically Break of Structure (BOS) and Market Structure Shift (MSS), to generate precise buy and sell signals. This unique mashup leverages the strengths of trend confirmation through SMAs and market structure analysis via ICT to help traders identify high-probability trend entries. The indicator is designed to be intuitive, customizable, and suitable for traders of all levels seeking to align with market trends on various timeframes.
//
// ### What It Does
// The indicator plots two SMAs based on the high and low prices of candles to define the trend direction. It colors the SMAs and fills the area between them to visually indicate whether the price is in a bullish (above both SMAs), bearish (below both SMAs), or neutral (between SMAs) state. Simultaneously, it identifies BOS and MSS levels on a user-defined higher timeframe to confirm trend continuation or reversal points. Buy and sell signals are generated when the price closes above/below the latest BOS or MSS level (based on user preference) while also being correctly positioned relative to the SMAs, ensuring alignment with the trend.
//
// ### Why Combine SMAs and ICT?
// SMAs provide a reliable way to gauge trend direction by smoothing price data, but they can lag or generate false signals in choppy markets. ICT's BOS and MSS concepts address this by focusing on key market structure breaks, offering context for significant price movements. By requiring price to close beyond a BOS or MSS level and align with the SMA-defined trend, the TrendCraft ICT SwiftEdge filters out noise and enhances signal reliability. This combination creates a robust system that balances trend-following simplicity with structural market insights, making it ideal for trend traders.
//
// ### How to Use
// 1. **SMA Length**: Adjust the `SMA Length` (default: 20) to control the sensitivity of the SMAs. Shorter lengths react faster to price changes, while longer lengths provide smoother trends.
// 2. **Structure Timeframe**: Set the `Structure Timeframe` to a higher timeframe (e.g., "1H" on a 15M chart) to calculate BOS and MSS levels. This ensures structural signals are based on significant market moves.
// 3. **Chart Timeframe**: Select the `Chart Timeframe` to optimize pivot point calculations for your current chart (e.g., "30M" for a 30-minute chart).
// 4. **Signal Type**: Choose between "BOS" (default) for signals based on trend continuation breaks or "MSS" for signals based on potential reversal points (breakers).
// 5. **Display Options**: Enable/disable `Show Continuation (BOS)` and `Show Breaker (MSS)` to toggle the visibility of BOS and MSS lines. Customize their colors for better chart clarity.
//
// ### Signals
// - **Buy Signal**: Appears when the close price crosses above the latest BOS or MSS level (based on Signal Type) and is above both SMAs, indicating a bullish trend entry. Marked with a green "Buy" label.
// - **Sell Signal**: Appears when the close price crosses below the latest BOS or MSS level (based on Signal Type) and is below both SMAs, indicating a bearish trend entry. Marked with a red "Sell" label.
//
// ### Originality
// The TrendCraft ICT SwiftEdge stands out by integrating the trend-following reliability of SMAs with the structural precision of ICT's BOS and MSS. Unlike standalone SMA or ICT indicators, this script requires both trend alignment and structural confirmation, reducing false signals. The user-selectable Signal Type (BOS or MSS) adds versatility, allowing traders to adapt the indicator to trend-following or counter-trend strategies. Its dynamic timeframe adjustments and visual clarity make it a unique tool for traders seeking to capture trend entries with confidence.
//
// ### Notes
// - Ensure the `Structure Timeframe` is higher than your chart timeframe to avoid calculation issues.
// - Signals are generated only when the trend state changes to avoid redundant signals in the same trend direction.
// - Past performance is not indicative of future results. Always combine this indicator with other analysis and risk management techniques.

Smart Money Oscillator [ChartPrime]The "Smart Money Oscillator " is a premium and discount zone oscillator with BOS and CHoCH built in for further analysis of price action. This indicator works by first determining the the premium and discount zones by using pivot points and high/lows. The top of this oscillator represents the current premium zone while the bottom half of this oscillator represents the discount zone. This oscillator functionally works like a stochastic oscillator with more sophisticated upper and lower bounds generated using smart money concept theories. We have included a moving average to allow the user to visualize the currant momentum in the oscillator. Another key feature we have included lagging divergences to help traders visualize potential reversal conditions.
Understanding the concepts of Premium and Discount zones, as well as Break of Structure (BoS) and Change of Character (CHoCH), is crucial for traders using the Smart Money Oscillator. These concepts are rooted in market structure analysis, which involves studying price levels and movements.
Premium Zone is where the price is considered to be relatively high or 'overbought'. In this zone, prices have risen significantly and may indicate that the asset is becoming overvalued, potentially leading to a reversal or slowdown in the upward trend.
The Discount Zone represents a 'discount' or 'oversold' area. Here, prices have fallen substantially, suggesting that the asset might be undervalued. This could be an indicator of a potential upward reversal or a pause in the downward trend.
Break of Structure (BoS) is about the continuation of a trend. In a bullish trend, a BoS is identified by the break of a recent higher high. In a bearish trend, it's the break of a recent Lower Low. BoS indicates that the trend is strong and likely to continue in its current direction. It's a sign of strength in the prevailing trend, whether up or down.
Change of Character (CHoCH) is an indication of a potential end to a trend. It occurs when there's a significant change in the market's behavior, contradicting the current trend. For example, in an uptrend characterized by higher highs and higher lows, a CHoCH may occur if a new high is formed but then is followed by an impulsive move downwards. This suggests that the bullish trend may be weakening and a bearish reversal could be imminent. CHoCH is essentially a sign of trend exhaustion and potential reversal.
With each consecutive BoS, the signal line of the oscillator will deepen in color. This allows you to visually see the strength of the current trend. The maximum strength of the trend is found by keeping track of the maximum number of consecutive BoS's within a window of 10. This calculation excludes periods without any BoS's to allow for a more stable max.
Quick Update is a feature that implements a more aggressive algorithm to update the highs and lows. Instead of updating the pivot points exclusively to update the range levels, it will attempt to use the current historical highs/lows to update the bounds. This results in a more responsive range at the cost of stability. There are pros and cons for both settings. With Quick Update disabled, the indicator will allow for strong reversals to register without the indicator maxing out. With Quick Update enabled, the indicator will show shorter term extremes with the risk of the signal being pinned to the extremities during strong trends or large movements. With Quick Update disabled, the oscillator prioritizes stability, using a more historical perspective to set its bounds. When Quick Update is enabled, the oscillator becomes more responsive, adjusting its bounds rapidly to reflect the latest market movements.
The Scale Offset feature allows the indicator to break the boundaries of the oscillator. This can be useful when the market is breaking highs or lows allowing the user to identify extremities in price. With Scale Offset disabled the oscillator will always remain inside of the boundaries because the extremities will be updated instantly. When this feature is enabled it will update the boundaries one step behind instead of updating it instantly. This allows the user to more easily see overbought and oversold conditions at the cost of incurring a single bar lag to the boundaries. Generally this is a good idea as this behavior makes the oscillator more sensitive to recent price spikes or drops, reflecting sudden market movements more accurately. It accentuates the extremities of the market conditions, potentially offering a more aggressive analysis. The main trade-off with the Scale Offset feature is between sensitivity and potential overreaction. It offers a more immediate and exaggerated reflection of market conditions but might also lead to misinterpretations in certain scenarios, especially in highly volatile markets.
Divergence is used to predict potential trend reversals. It occurs when the price of an asset and the reading of an oscillator move in opposite directions. This discrepancy can signal a weakening of the current trend and possibly indicate a potential reversal.
Divergence doesn't always lead to a trend reversal, but it's a warning sign that the current trend might be weakening. Divergence can sometimes give false signals, particularly in strongly trending markets where the oscillator may remain in overbought or oversold conditions for extended periods. The lagging nature of using pivot points to calculate divergences means that all divergences are limited by the pivot look forward input. The upside of using a longer look forward is that the divergences will be more accurate. The obvious con here is that it will be more delayed and might be useless by the time it appears. Its recommended to use the built in divergences as a way to learn how these are formed so you can make your own in real time.
By default, the oscillator uses a smoothing of 3 to allow for a more price like behavior while still being rather smooth compared to raw price data. Conversely, you can increase this value to make this indicator behave smoother. Something to keep in mind is that the amount of delay from real time is equal to half of the smoothing period.
We have included a verity of alerts in this indicator. Here is a list of all of the available alerts: Bullish BOS, Bearish BOS, Bullish CHoCH, Bearish CHoCH, Bullish Divergence, Hidden Bullish Divergence, Bearish Divergence, Hidden Bearish Divergence, Cross Over Average, Cross Under Average.
Below are all of the inputs and their tooltips to get you started:
Settings:
Smoothing: Specifies the degree of smoothing applied to the oscillator. Higher values result in smoother but potentially less responsive signals.
Average Length: Sets the length of the moving average applied to the oscillator, affecting its sensitivity and smoothness.
Pivot Length: Specifies the forward-looking length for pivot points, affecting how the oscillator anticipates future price movements. This directly impacts the delay in finding a pivot.
Max Length: Sets the maximum length to consider for calculating the highest values in the oscillator.
Min Length: Defines the minimum length for calculating the lowest values in the oscillator.
Quick Update: Activates a faster update mode for the oscillator's extremities, which may result in less stable range boundaries.
Scale Offset: When enabled, delays updating minimum and maximum values to enhance signal directionality, allowing the signal to occasionally exceed normal bounds.
Candle Color: Enables coloring of candles based on the current directional signal of the oscillator.
Labels:
Enable BOS/CHoCH Labels: Activates the display of BOS (Break of Structure) and CHoCH (Change of Character) labels on the chart.
Visual Padding: Turns on additional visual padding at the top and bottom of the chart to accommodate labels. Determines the amount of visual padding added to the chart for label display.
Divergence:
Divergence Pivot: Defines the number of bars to the right of the pivot in divergence calculations, influencing the oscillator's responsiveness.
Divergence Pivot Forward: Directly impacts latency. Longer periods results in more accurate results at the sacrifice of delay.
Upper Range: Sets the upper range limit for divergence calculations, influencing the oscillator's sensitivity to larger trends.
Lower Range: Determines the lower range limit for divergence calculations, affecting the oscillator's sensitivity to shorter trends.
Symbol: Allows selection of the label style for divergence indicators, with options for text or symbolic representation.
Regular Bullish: Activates the detection and marking of regular bullish divergences in the oscillator.
Hidden Bullish: Enables the identification and display of hidden bullish divergences.
Regular Bearish: Turns on the feature to detect and highlight regular bearish divergences.
Hidden Bearish: Activates the functionality for detecting and displaying hidden bearish divergences.
Color:
Bullish: Determines the minimum/maximum color gradient for bullish signals, impacting the chart's visual appearance.
Bearish: Defines the minimum/maximum color gradient for bearish signals, affecting their visual representation.
Average: Specifies the color for the average line of the oscillator, enhancing chart readability.
CHoCH: Sets the color for bullish/bearish CHoCH (Change of Character) signals.
Premium/Discount: Determines the color for the premium/discount zone in the oscillator's visual representation.
Text Color: Sets the color for the text in BoS/CHoCH labels.
Regular Bullish: Defines the color used to represent regular bullish divergences.
Hidden Bullish: Specifies the color for hidden bullish divergences.
Regular Bearish: Determines the color for hidden bearish divergences.
Divergence Text Color: Specifies the color for the text in divergence labels.

Momentum Market Structure ProThis first indicator in the Beyond Market Structure Suite gives you clear market structure at a glance, with adaptive support & resistance zones. It's the only SMC-style indicator built from momentum highs & lows, as far as I know. It creates dynamic support & resistance zones that change strength and resize intelligently, and gives you timely alerts when price bounces from support/rejects from resistance.
You’re free to use the provided entry and exit signals as a ready-to-use, self-contained strategy, or plug its structure into your existing system to sharpen your edge :
• Market structure bias may help improve a compatible system's win rate by taking longs only in bullish bias and shorts in bearish structure.
• Support/resistance can help trend traders identify inflection points, and help range traders define ranges.
🟩 HIGHLIGHTS
⭐ Unique market structure with different characteristics than purely price-based models.
⭐ Support and resistance created from only the extreme levels.
⭐ Support & resistance zones adapt to remain relevant. Zones are deactivated when they become too weak.
⭐ Long and short signals for a bounce from support/rejection from resistance.
🟩 WHY "MARKET STRUCTURE FIRST, ALWAYS"?
"There is only one side to the stock market; and it is not the bull side or the bear side, but the right side." — Jesse Livermore, Reminiscences of a Stock Operator (1923)
If the market is structurally against your trade, you're gonna have a bad time. So you must know what the market structure is before you plan your trade. The more precise and relevant your definition of market structure, the better.
🟩 HOW TO TRADE USING THIS INDICATOR (SIMPLE)
• Directional filter : The prevailing bias background can be used for any kind of trades you want to take. For example, you can long a bounce from support in a bullish market structure bias, or short a rejection from resistance in bearish bias.
• Entries : For more conservative entries, you could wait for a Candle Trend flip after a reaction from your chosen zone (see below for more about Candle Trend).
• Stops : The included running stop-loss level based on Average True Range (ATR) can be used for a stop-loss — set the desired multiplier, and use the level from the bar where you enter your trade.
• Take-profit : Similarly, you can set a Risk:Return-based take-profit target. Support and resistance zones can also be used as full or partial take-profit targets.
See the Advanced section below for more ideas.
🟩 SIGNALS
⭐ ENTRIES
You can enable signals and alerts for bounces from support and rejections from resistance (you'll get more signals using Adaptive mode). You can filter these by requiring corresponding market structure bias (it uses the bias you've already set for the background), and by requiring that Candle Trend confirm the move.
I've slipped in my all-time favourite creation to this indicator: Candle Trend. When price makes a Simple Low pivot, the trend flips bullish. When price then makes a Simple High pivot, the trend flips bearish (see my Market Structure library for a full explanation). This tool is so simple, yet I haven't noticed it anywhere else. It shows short-term trends beautifully. I use it mainly as confirmation of a move. You can use it to confirm ANY kind of move, but here we use it for bounces from support/rejections from resistance.
Note that the pivots and Zigzags are structure, not signals.
⭐ STOPS
You can use the supplied running ATR-based stop level to find a stop-loss level that suits your trading style. Set the desired multiplier, and use the level from the bar where you enter your trade.
⭐ TAKE-PROFIT
Similarly, you can set a take-profit target based on Risk:Return (R:R). If this setting is enabled, the indicator calculates the distance between the closing price and your configured stop, then multiplies that by the configured R:R factor to calculate an appropriate take-profit level. Note that while the stop line is reasonably smooth, the take-profit line varies much more, reflecting the fact that if price has moved away from your stop, the trade requires a greater move in order to hit a given R:R ratio.
Since the indicator doesn't know where you were actually able to enter a position, add a ray using the drawing tool and set an alert if you want to be notified when price reaches your stop or target.
🟩 WHAT'S UNIQUE ABOUT THIS INDICATOR
⭐ MOMENTUM PIVOTS
Almost all market structure indicators use simple Williams fractals. A very small number incorporate momentum, either as a filter or to actually derive the highs and lows. However, of those that derive pivots from momentum, I'm not aware of any that then create full market structure from it.
⭐ SUPPORT & RESISTANCE
Some other indicators also adjust S/R zones after creation, some use volume in zone creation, some increase strength for overlap, a few merge zones together, and many use price interactions to classify zones. But my implementation differs from others, as far as I can tell after looking at many many indicators, in seven specific ways:
+ Zones are *created* from purely high-momentum pivots, not derived or filtered from simple Williams pivots (e.g. `ta.pivothigh()`).
+ Zones are *weakened* dynamically as well as strengthened. Many people know that S/R gets stronger if price rejects from it, but this is only half the story. Different price patterns strengthen *or weaken* zones.
+ We use *conviction-weighted candle patterns* to adjust strength. Not simply +1 for price touching the zone, but a set of single-bar and multi-bar patterns which all have different effects.
+ The rolling strength adjustments are all *moderated by volume*. The *relative volume* forms a part of each adjustment pattern. Some of our patterns reward strong volume, some punish it.
+ We do our own candle modelling, and the adjustment patterns take this into account.
+ We *resize* zones as a result of certain candle patterns ("indecision erodes, conviction defends").
+ We shrink overlapping zones to their sum *and* add their strengths.
🟩 HOW TO TRADE USING THIS INDICATOR (ADVANCED)
In addition to the ideas in the How to Trade Using This indicator (Simple) section above, here are some more ideas.
You can use the market structure:
• As a bias for entries given by more reactive momentum resets, or indeed other indicators and systems.
• You could use a change in market structure to close a long-running trend-following position.
You can use the distance from a potential entry to the CHoCH line as a filter to choose higher-potential trades in ranging assets.
Confluence between market structure and your favourite trend indicator can be powerful.
Multi timeframe analysis
This is a bit of a rabbit hole, but you could use a split screen with this indicator on a higher timeframe (HTF) view of the same asset:
• If the 1D structure turns bullish, the next time that the 1H structure also flips bullish might be a good entry.
• Rejection from a HTF zone, confirmed by lower timeframe (LTF) structure, could be a good entry.
None of this is advice. You need to master your own system, and especially know your own strengths and weaknesses, in order to be a successful trader. An indicator, no matter how cool, is not going to one-shot that process for you.
In Adaptive mode, a skillful trader will be able to spot more opportunities to classify and use support and resistance than any algorithm, including mine, now that they've been automatically drawn for you.
If you are doing historical analysis, note that the "Calculated bars" setting is set to a reasonably small number by default, which helps performance. Either increase this number (setting to zero means "use all the bars"), or use Bar Replay to examine further back in the chart's history. If you encounter errors or slow loading, reduce this number.
🟩 SUPPORT & RESISTANCE
A support zone is an area where price is more likely to bounce, and a resistance zone is an area where price is more likely to reject. Marking these zones up on the chart is extremely helpful, but time-consuming. We create them automatically from only high-momentum areas, to cut noise and highlight the zones we consider most important.
In Simple mode, we simply mark S/R zones from momentum and Implied pivots. We don't update them, just deactivate them if price closes beyond them. Use this mode if you're interested in only recent levels.
In Adaptive mode, zones persist after they're traversed. Once the zones are created, we adjust them based on how price and volume interact with them. We display stronger zones with more opaque fills, and weaker zones with more transparent fills. To calculate strength, we first preprocess candles to take into account gaps between candles, because price movement after market is just as important in its own way. The preprocessing also redefines what constitutes upper and lower wicks, so as to better account for order flow and commitment. We use these modelled candle values, as well as their relative amplitude historically, rather than the raw OHLC for all calculations for interactions of price and zones. It's important to understand, when trying to figure out why the indicator strengthened or weakened a zone, that it sees fundamental price action in a different way to what is shown on standard chart candles (and in a way that can't easily be represented accurately on chart candles).
Then, we strengthen or weaken , and resize support and resistance zones dynamically using different formulas for different events, based on principles including these:
• The close is the market's "vote", the momentum shift anchor.
• Defended penetrations reveal validated liquidity clusters.
• Markets contract to defended levels.
• "The wick is the fakeout, but the close tells you if institutions held the level." — ICT (Inner Circle Trader)
Adaptive mode is more powerful, but you might need to tweak some of the Advanced Support & Resistance settings to get a comfortable number of zones on the chart.
🟩 MOMENTUM PIVOTS
The building blocks of market structure are Highs and Lows — places where price hits a temporary extreme and reverses. All the indicators I could find that create full market structure do so from basic price pivots — Williams fractals, being the highest/lowest candle wick for N candles backwards and forwards (there are some notable first attempts on TradingView to use momentum to define pivots, but no full structure). "Highest/lowest out of N bars" is the almost universal method, but it also picks up somewhat arbitrary price movements. Recognising this, programmers and traders often use longer lookbacks to focus on the more significant Highs and Lows. This removes some noise, but can also remove detail.
My indicator uses a completely different way of thinking about High and Low pivots. A High is where *momentum* peaks and falls back, and a low is where it dips and then recovers. While this is happening, we record the extremes in price, and use those prices as the High or Low pivot zones.
This deliberately picks out different, more meaningful pivots than any purely price-based approach, helping you focus on the swings that matter. By design, it also ignores some stray wicks and other price action that doesn't reflect significant momentum. Price action "purists" might not like this at first, but remember, ultimately we want to trade this. Check and see which levels the market later respects. It's very often not simply the numerically higher/lower local maxima and minima, but the levels that held meaning, interpreted here through momentum.
The first-release version uses the humble Stochastic as the structural momentum metric. Yes, I know — it's overlooked by most people, but that's because they're using it wrong. Stochastic is a full-range oscillator with medium excursions, unlike RSI, say, which is a creeping oscillator with reluctant resets. This makes Stoch (at the default period of 14) not quite reactive enough for on-the-ball momentum reset entry signals, but close to perfect (no metric is 100%) for structural pivots.
Stochastic is also a solid choice for structure because divergences are rare and not usually very far away in terms of price. More reactive momentum metrics such as Stochastic RSI produce very noisy structure that would take a whole extra layer of interpreting (see Further Research, below).
For these reasons, I may or may not add other options for momentum. In the initial release, I've added smoothed RSI as an alternative just to show it's possible, which takes even longer than Stochastic to migrate from one extreme to another, creating an interesting, longer-term structure.
🟩 IMPLIED PIVOTS
We want pivots to mark important price levels so that we can compute market direction and support & resistance zones from them.
In this context, we see that some momentum metrics, and Stochastic in particular, tend to give multiple consecutive resets in the same direction. In other words, we get High followed by High, or Low followed by Low, which does not give us the chance to create properly detailed structure. To remedy this, we simply take the most extreme price action between two same-direction pivots, and create an Implied pivot out of it, after the second same-direction pivot is created.
Obviously these pivots are created very late. Recalling why we wanted them, we realise that this is fine. By definition , price has not exceeded the Implied Pivot level when they're created. So they show us an interesting level that is yet untested.
Implied Pivots are thus created indirectly by momentum but defined directly by price. They are for structure only. We choose not to give them a Dow type (HH, HL, LH, LL) and not to include them in the Main Zigzag to emphasise their secondary nature. However, Implied Pivots are not "internal" or "minor" pivots. There is no such concept in the current Momentum Market Structure model.
If you want less responsive, more long-term structure, you can turn Implied Pivots off.
🟩 DOW STRUCTURE
Dow structure is the simplest form of market structure — Higher Highs (HHs) and Higher Lows (HLs) is an uptrend (showing buyer dominance), and vice-versa for a downtrend.
We label all Momentum (not Implied) Pivots with their Dow qualifier. You can also choose to display the background bias according to the Dow trend.
There is an input option to enable a "Ranging" Dow state, which happens when you get Lower Highs in an uptrend or Higher Lows in a downtrend.
🟩 SMC-STYLE STRUCTURE (BOS, CHOCH)
The ideas of trend continuation after taking out prior highs/lows and looking for early signs of possible reversal go back to Dow and Wyckoff, but have been popularised by SMC as Break Of Structure (BOS) and Change of Character (CHoCH).
BOS can be used as a trigger: for example:
• Wait for a bullish break of structure
• Then attempt to buy the pullback
• Cancel if structure breaks bearish (meaning, we get a bearish CHoCH break)
How to buy the pullback? This is the trillion-dollar question. First, you need solid structure. Without structure, you got nothin'. Then, you want some identified levels where price might bounce from.
If only we incorporated intelligent support and resistance into this very indicator 😍
Creating and maintaining correct BOS and CHoCH continuously , without resetting arbitrarily when conditions get difficult, is technically challenging. I believe I've created an implementation of this structure that is at least as solid as any other available.
In general, BOS is fully momentum‑pivot‑driven; CHoCH is anchored to momentum pivots but maintained mainly by raw price extremes relative to those anchors (breaks are obviously pure price). This means that the exact levels will sometimes differ from your previous favourite market structure indicator.
We have made some assumptions here which may or may not match any one person's understanding of the "correct" way to do things, including: BOS is not reset on wicks because, for us, if price cannot close beyond the BOS there is no BOS break, therefore the previous wick level is still important. The candidate for CHoCH on opposing CHoCH break *is* reset on a wick, because we want to be sure to overcome the leftover liquidity at that new extreme before calling a Change of Character. The CHoCH is moved on a BOS break. For a bullish BOS break, the new CHoCH is the lowest price *since the last momentum pivot was confirmed, creating the BOS that just broke*, and vice-versa for bearish. If there's a stray wick before that, which doesn't shift momentum, we don't care about it.
🟩 ZIGZAG
The Major Swing Zigzag dynamically connects momentum highs and lows (e.g., from a Higher Low to the latest Higher High), adjusting as new extremes form to reveal the overall trend leg.
The Implied Structure Zigzag joins momentum pivots and Implied pivots, if enabled.
🟩 REPAINTING
It's really important to understand two things before asking "Does it repaint?":
1. ALL structure indicators repaint, in the sense of drawing things into the past or notifying you of things that happened in past bars, because by definition, structure needs some kind of confirmation, which takes at least one bar, usually several. This is normal.
2. Almost all indicators of ANY kind repaint in that they display unconfirmed values until the current bar closes. This is also normal.
Most features of this indicator repaint in the ordinary, intended ways described above: the pivots (Implied doubly so), BOS and CHoCH lines, and formation of S/R zones.
The Zigzags, by design, adjust themselves to new pivots. The active lines often change and attach themselves to new anchors. This is a form of repainting. It's important to note that the Zigzags are not signals. They're there to help visualise market structure, and structure does change. Therefore, I prioritised clearly explaining what price did rather than preserving its history.
One of the "bad" kinds of repainting is if a signal is printed when the bar closes, but then on a later bar that "confirmed" signal changes. This is a fundamental issue with some high timeframe implementations. It's bad because you might already have entered a trade and now the indicator is pretending that it never signalled it for you. My indicators do not do this (in fact I wrote an entire library to help other authors avoid this).
If you are ever in any doubt, play with an indicator in Bar Replay mode to see exactly what it does.
To understand repainting, see the official docs: www.tradingview.com
🟩 FURTHER RESEARCH
I've attempted to answer two of the tricky problems in technical analysis in Pine: how to do robust and responsive market structure, and how to maintain support and resistance zones once created. However, this just opens up more possibilities. Which momentum metrics are suitable for structure? Can more reactive metrics be used, and how do we account for divergences in a structural model based on key horizontal levels? Which sets of rules give the best results for maintaining support and resistance? Does the market have a long or a short memory? Is bar decay a natural law or a coping mechanism?
🟩 CREDITS
❤️ I'd like to thank my humble trading mentor, whose brilliant ideas inspire me to garble out code. Thanks are also due to @Timeframe_Titans for guidance on the finer points of market structure (all mistakes and distortions are my own), and to @NJPorthos for feedback and encouragement during the months in the wilderness.
Script a pagamento

ICT订单块交易【实时不滞后】Used to identify "Order Blocks" (OB), based on Break of Structure (BOS) and Retest mechanisms. It detects candles in the opposite direction after swing highs/lows to form potential supply/demand zones, confirming and plotting valid OBs only upon price retest. The indicator emphasizes "real" OBs: requiring a strong impulse (> ATR * multiplier) and retest verification.
- **Core Functions**: Detect BOS (Break of Structure); find opposite candles after prior impulses; verify strength and retest; draw OB boxes and labels.
- **Applicable Scenarios**: Suitable for ICT strategies, supply-demand trading, or reversal identification. Helps filter false breakouts and shows only high-probability zones.
- **Display Mode**: Overlaid on the main chart, displaying OBs as boxes, supporting up to 500 boxes.
- **Limitations**: Retest period fixed at 15 bars; based on simple candlesticks (no volume filter); no automatic cleanup of old OBs (manual management required).
The indicator has no built-in alerts but can be extended. ATR is used dynamically to validate strength.
## Input Parameters
Input parameters are concise, divided into core settings and display group. Below explains each parameter’s default value, type, and function.
### Core Settings
- **Structure Lookback** (int, default: 10, min: 3): Lookback period for structure detection (length for ta.highest/lowest). Higher values detect stronger structures.
- **Minimum Impulse Strength (ATR ×)** (float, default: 1.5, min: 0.5): Minimum impulse strength ((high-low) > ATR * this value). Ensures significant movement before OB.
- **Bars to watch for Retest** (int, default: 15, min: 1): Number of bars to monitor for retest. OB is confirmed only if price retests the OB zone within N bars after a breakout.
### Display Settings
- **Show Bullish OBs** (bool, default: true): Show bullish OBs (demand zone, rebounds after retest).
- **Show Bearish OBs** (bool, default: true): Show bearish OBs (supply zone, reverses after retest).
Colors are fixed: green (bullish, 80% transparency), red (bearish, 80% transparency).
## Calculations and Display
### Break of Structure (BOS) Detection
- **ATR Calculation**: ta.atr(14) used for strength verification.
- **Swing High/Low**: ta.highest(high, lookback) / ta.lowest(low, lookback) to identify structure. ...
## Calculation and Display
### Structure Breakout (BOS) Detection
- **ATR Calculation**: `ta.atr(14)` used for strength verification.
- **Swing High/Low**: `ta.highest(high, lookback)` / `ta.lowest(low, lookback)` identify structure.
- **BOS Trigger**:
- **bullBOS**: close > hh (breaks previous high).
- **bearBOS**: close < ll (breaks previous low).
### Order Block Identification
- **getLastOppositeCandle(isBullish)**:
- Search for the most recent "opposite" candle within the lookback period (bullBOS: bearish candle close < open; bearBOS: bullish candle close > open).
- Returns the index (idx); if none, then na.
- **OB Logic** (only when showBullish/Bearish=true):
- **Bullish OB (bullBOS)**:
- Find previous bearish candle (idx), check momentum: (high-low) > ATR * atrMult.
- Calculate obLow = low , obHigh = high .
- Backtest check: within 15 candles low inside → inRetest = true.
- If confirmed: draw green box (from bar_index - idx to current, obLow to obHigh); label "🟩 Bullish OB (Valid)" (top-left, green, 80% transparency, white text).
- Push into bullOBs array.
- **Bearish OB (bearBOS)**: symmetric, red box, label "🟥 Bearish OB (Valid)" (bottom-left).
- **Array Management**: var box bullOBs/bearOBs store all OBs; no automatic cleanup (expandable).
### Display Elements
- **Boxes**: dynamically from idx to current candle, visually showing OB area.
- **Labels**: displayed when confirmed, positioned based on obHigh/obLow.
- No lines/fills; pure boxes + labels.
## Alert Functionality
The indicator has no built-in alerts but can be extended via TradingView alerts, for example:
- **New OB**: bullBOS and inRetest or bearBOS and inRetest.
- **Backtest**: price enters OB range.
It is recommended to add `alertcondition()` for custom alerts. ...
It is recommended to add a custom alertcondition(), such as 'Bullish OB Confirmed'.
## Usage Tips
- **Optimization**: lookback=10 balances sensitivity; atrMult=1.5 filters weak impulses; retestBars=15 is suitable for intraday.
- **Customization**: turn off showBullish/Bearish to hide types; add volume filtering to the fork for better accuracy.
- **Explanation**:
- **BOS + Backtesting**: ensure OB is 'real' (not a false breakout); only draw after backtesting to avoid noise.
- **Strength**: (high-low)>ATR*1.5 indicates strong impulses, making OB more reliable.
- **Application**: Bullish OB = buy zone (support); Bearish OB = sell zone (resistance).
- **Limitations**: fixed backtesting period may miss late retracements; no volume/time filtering; few OBs in low-volatility markets.
- **Extensions**: add OB counts or Fibonacci extensions.
ICT订单块交易指标,用于识别“订单块”(Order Blocks, OB),基于结构突破(Break of Structure, BOS)与回测(Retest)机制。它通过检测摆动高/低点后的相反方向烛台,形成潜在供给/需求区域,仅在价格回测时确认并绘制有效OB。指标强调“真实”OB:需强冲动(> ATR * 乘数)与回测验证。
- **核心功能**:检测BOS(结构突破);查找前冲动相反烛台;验证强度与回测;绘制OB盒子与标签。
- **适用场景**:适合ICT策略、供给需求交易或反转识别。帮助过滤假突破,仅显示高概率区域。
- **显示模式**:叠加在主图上,使用盒子(boxes)显示OB,支持最大500个盒子。
- **限制**:回测期固定15柱;基于简单烛台(无成交量过滤);无自动清理旧OB(手动管理)。
指标无内置警报,但可扩展。数据使用ATR动态验证强度。
## 输入参数
输入参数简洁,分为核心设置与显示组。以下说明每个参数的默认值、类型和作用。
### 核心设置
- **Structure Lookback** (int, 默认: 10, 最小: 3):结构检测回溯期(ta.highest/lowest的长度)。较高值检测更强结构。
- **Minimum Impulse Strength (ATR ×)** (float, 默认: 1.5, 最小: 0.5):最小冲动强度((high-low) > ATR * 此值)。确保OB前有显著移动。
- **Bars to watch for Retest** (int, 默认: 15, 最小: 1):回测监控柱数。突破后N柱内价格回测OB区域才确认。
### 显示设置
- **Show Bullish OBs** (bool, 默认: true):显示看涨OB(需求区,回测后反弹)。
- **Show Bearish OBs** (bool, 默认: true):显示看跌OB(供给区,回测后反转)。
颜色固定:绿(看涨,80%透明)、红(看跌,80%透明)。
## 计算与显示
### 结构突破(BOS)检测
- **ATR计算**:ta.atr(14) 用于强度验证。
- **摆动高/低**:ta.highest(high, lookback) / ta.lowest(low, lookback) 识别结构。
- **BOS触发**:
- **bullBOS**:close > hh (上破前高)。
- **bearBOS**:close < ll (下破前低)。
### 订单块识别
- **getLastOppositeCandle(isBullish)**:
- 查找最近lookback柱内“相反”烛台(bullBOS: 熊烛 close < open;bearBOS: 牛烛 close > open)。
- 返回索引(idx);若无则na。
- **OB逻辑**(仅当showBullish/Bearish=true):
- **看涨OB (bullBOS)**:
- 查找前熊烛(idx),检查冲动:(high-low) > ATR * atrMult。
- 计算obLow=low ,obHigh=high 。
- 回测检查:15柱内low 在 内 → inRetest=true。
- 若确认:绘制绿盒(bar_index-idx 到当前,obLow到obHigh);标签“🟩 Bullish OB (Valid)”(左上,绿,80%透明,白文本)。
- 推入bullOBs数组。
- **看跌OB (bearBOS)**:对称,红盒,标签“🟥 Bearish OB (Valid)”(左下)。
- **数组管理**:var box bullOBs/bearOBs 存储所有OB;无自动清理(可扩展)。
### 显示元素
- **盒子**:动态从idx到当前柱,延伸显示OB区域。
- **标签**:确认时显示,位置基于obHigh/obLow。
- 无线条/填充;纯盒子+标签。
## 警报功能
指标无内置警报,但可通过TradingView警报扩展,例如:
- **新OB**:bullBOS and inRetest 或 bearBOS and inRetest。
- **回测**:价格进入OB范围。
建议添加alertcondition()自定义,如“Bullish OB Confirmed”。
## 使用提示
- **优化**:lookback=10平衡敏感;atrMult=1.5过滤弱冲动;retestBars=15适合日内。
- **自定义**:关闭showBullish/Bearish隐藏类型;fork添加成交量过滤提升准确。
- **解释**:
- **BOS+回测**:确保OB“真实”(非假突破);仅回测后绘制,避免噪音。
- **强度**:(high-low)>ATR*1.5表示强冲动,OB更可靠。
- **应用**:看涨OB=买入区(支撑);看跌OB=卖出区(阻力)。
- **局限**:回测期固定,可能错过晚回测;无成交量/时间过滤;低波动市场少OB。
- **扩展**:添加OB计数或斐波那契扩展。

🔥 SMC Reversal Engine v3.5 – Clean FVG + DashboardSMC Reversal Engine v3.5 – Clean FVG + Dashboard
The SMC Reversal Engine is a precision-built Smart Money Concepts tool designed to help traders understand market structure the single most important foundation in reading price action. It reveals how institutions move liquidity, where structure shifts occur, and how Fair Value Gaps (FVGs) align with these changes to signal potential reversals or continuations.
Understanding How It Works
At its core, the script detects CHoCH (Change of Character) and BOS (Break of Structure)—the two key turning points in institutional order flow. A CHoCH shows that the market has reversed intent (for example, from bearish to bullish), while a BOS confirms a continuation of the current trend. Together, they form the backbone of structure-based trading.
To refine this logic, the engine uses fractal pivots clusters of candles that confirm swing highs and lows. Fractals filter out noise, identifying points where price truly changes direction. The script lets you set this sensitivity manually or automatically adapts it depending on the timeframe. Lower fractal sensitivity captures smaller intraday swings for scalpers, while higher sensitivity locks onto major swing structures for swing and position traders.
The dashboard gives you a real-time reading of the trend, the last high and low, and what the market is likely to do next—for example, “Expect HL” or “Wait for LH.” It even tracks the accuracy of these structure predictions over time, giving an educational feedback loop to help you learn price behavior.
Fair Value Gaps and Tap Entries
Fair Value Gaps (FVGs) mark moments when price moves too quickly, leaving inefficiencies that institutions often revisit. When price taps into an FVG, it often acts as a high-probability entry zone for reversals or continuations. The script automatically detects, extends, and deletes old FVGs, keeping only relevant zones visible for a clean chart.
Traders can enable markTapEntry to visually confirm when an FVG gets filled. This is a simple but powerful trigger that often aligns with CHoCH or BOS moments.
Recommended Settings for Different Traders
For Scalpers, use a lower HTF structure such as 1 minute or 5 minutes. Keep Auto Fractals on for faster reaction, and limit FVG zones to 2–3. This gives you a clean, real-time reflection of order flow.
For Intraday Traders, 15-minute to 1-hour structure gives the perfect balance between reactivity and stability. Fractal sensitivity around 3–5 captures the most actionable levels without excessive noise.
For Swing Traders, use 4-hour, 1-day, or even 3-day structure. The chart becomes smoother, showing higher-order CHoCH and BOS that define true institutional transitions. Combine this with EMA confirmation for higher conviction.
For Position or Macro Traders, select Weekly or Monthly structure. The dynamic label system expands automatically to keep more historical BOS/CHoCH points visible, allowing you to see long-term shifts clearly.
Educational Value
This indicator is built to teach traders how to see structure the way professionals and smart money do. You’ll learn to recognize how markets transition from one phase to another from accumulation to manipulation to expansion. Each CHoCH or BOS helps you decode where liquidity is being taken and where new intent begins.
The included SMC Quick Guide explains each structural cue right on your chart. Within days of using it, you’ll start noticing patterns that reveal how price really moves, instead of guessing based on indicators.
Settings and How to Use Them
Everything in the SMC Reversal Engine is designed to adapt to your trading style and help you read structure like a professional.
When you open the Inputs Panel, you’ll see sections like Fractal Settings, FVG Settings, Buy/Sell Confirmation, and Educational Tools.
Under Fractal Settings, you can choose the higher timeframe (HTF) that defines structure—from minutes to weeks. The Auto Fractal Sensitivity option automatically adjusts how tight or wide swing points are detected. Lower sensitivity captures short-term fluctuations (great for scalpers), while higher values filter noise and isolate major swing highs and lows (perfect for swing traders).
The Fair Value Gap (FVG) options manage imbalance zones—the footprints of institutional orders. You can show or hide these zones, extend them into the future, and control how long they remain before auto-deletion. The Mark Entry When FVG is Tapped option places a small label when price revisits the gap—a potential entry signal that aligns with smart money logic.
EMA Confirmation adds a layer of confluence. The script can automatically scale EMA lengths based on timeframe, or you can input your preferred values (for example, 9/21 for intraday, 50/200 for swing). Require EMA Crossover Confirmation helps filter false moves, keeping you trading only with aligned momentum.
The Educational section gives traders visual reinforcement. When enabled, you’ll see tags like HH (Higher High), HL (Higher Low), LH (Lower High), and LL (Lower Low). These show structure shifts in real time, helping you learn visually what market structure really means. The Cheat Sheet panel summarizes each term, always visible in the corner for quick reference.
Early Top Warnings use wick size and RSI divergence to signal when price may be overextended—a useful heads-up before potential CHoCH formations.
Finally, the Narrative and Accuracy System translates structure into simple English—messages like Trend Bullish → Wait for HL or BOS Bearish → Expect LL. Over time, you can monitor how accurate these expectations have been, training your pattern recognition and confidence.
Pro Tips for Getting the Most Out of the SMC Reversal Engine
1. Start on Higher Timeframes First: Begin on the 4H or Daily chart where structure is cleaner and signals have more weight. Then scale down for entries once you grasp directional intent.
2. Use FVGs for Context, Not Just Entries: Observe how price behaves around unfilled FVGs—they often act as magnets or barriers, offering insight into where liquidity lies.
3. Combine With HTF Bias: Always trade in the direction of your higher timeframe trend. A bullish weekly BOS means lower timeframes should ideally align bullishly for optimal setups.
4. Clean Charts = Clear Mind: Use Minimal Mode when focusing on price action, then toggle the educational tools back on to review structure for learning.
5. Don’t Chase Every CHoCH or BOS: Focus on significant breaks that align with broader context and liquidity sweeps, not minor fluctuations.
6. Accuracy Rate Is a Feedback Tool: Use the accuracy stat as a reflection of consistency—not a trade trigger.
7. Build Narrative Awareness: Read the on-chart narrative messages to reinforce structured thinking and stay disciplined.
8. Practice Replay Mode: Step through past structures to visually connect CHoCH, BOS, and FVG behavior. It’s one of the best ways to train pattern recognition.
Summary
* Detects CHoCH and BOS automatically with fractal precision
* Identifies and manages Fair Value Gaps (FVGs) in real time
* Displays a smart dashboard with accuracy tracking
* Adapts label visibility dynamically by timeframe
* Perfect for both learning and trading with institutional clarity
This tool isn’t about predicting the market—it’s about understanding it. Once you can read structure, everything else in trading becomes secondary.

FVG & Market Structure//@version=5
indicator("FVG & Market Structure", overlay=true)
// Inputs
fvg_lookback = input.int(100, "FVG Lookback Period")
fvg_strength = input.int(1, "FVG Minimum Strength")
show_fvg = input.bool(true, "Show FVG")
show_liquidity = input.bool(true, "Show Liquidity Zones")
show_bos = input.bool(true, "Show BOS")
// Calculate swing highs and lows
swing_high = ta.pivothigh(high, 2, 2)
swing_low = ta.pivotlow(low, 2, 2)
// Detect Fair Value Gaps (FVG)
detect_fvg() =>
// Bullish FVG (current low > previous high + threshold)
bullish_fvg = low > high and show_fvg
// Bearish FVG (current high < previous low - threshold)
bearish_fvg = high < low and show_fvg
= detect_fvg()
// Plot FVG areas
bgcolor(bullish_fvg ? color.new(color.green, 95) : na, title="Bullish FVG")
bgcolor(bearish_fvg ? color.new(color.red, 95) : na, title="Bearish FVG")
// Breach of Structure (BOS) detection
detect_bos() =>
var bool bull_bos = false
var bool bear_bos = false
// Bullish BOS - price breaks above previous swing high
if high > ta.valuewhen(swing_high, high, 1) and not na(swing_high)
bull_bos := true
bear_bos := false
// Bearish BOS - price breaks below previous swing low
if low < ta.valuewhen(swing_low, low, 1) and not na(swing_low)
bear_bos := true
bull_bos := false
= detect_bos()
// Plot BOS signals
plotshape(bull_bos and show_bos, style=shape.triangleup, location=location.belowbar, color=color.green, size=size.small, title="Bullish BOS")
plotshape(bear_bos and show_bos, style=shape.triangledown, location=location.abovebar, color=color.red, size=size.small, title="Bearish BOS")
// Liquidity Zones (Recent Highs/Lows)
liquidity_range = input.int(20, "Liquidity Lookback")
buy_side_liquidity = ta.highest(high, liquidity_range)
sell_side_liquidity = ta.lowest(low, liquidity_range)
// Plot Liquidity Zones
plot(show_liquidity ? buy_side_liquidity : na, color=color.red, linewidth=1, title="Sell Side Liquidity")
plot(show_liquidity ? sell_side_liquidity : na, color=color.green, linewidth=1, title="Buy Side Liquidity")
// Order Block Detection (Simplified)
detect_order_blocks() =>
// Bullish Order Block - strong bullish candle followed by pullback
bullish_ob = close > open and (close - open) > (high - low) * 0.7 and show_fvg
// Bearish Order Block - strong bearish candle followed by pullback
bearish_ob = close < open and (open - close) > (high - low) * 0.7 and show_fvg
= detect_order_blocks()
// Plot Order Blocks
bgcolor(bullish_ob ? color.new(color.lime, 90) : na, title="Bullish Order Block")
bgcolor(bearish_ob ? color.new(color.maroon, 90) : na, title="Bearish Order Block")
// Alerts for key events
alertcondition(bull_bos, "Bullish BOS Detected", "Bullish Breach of Structure")
alertcondition(bear_bos, "Bearish BOS Detected", "Bearish Breach of Structure")
// Table for current market structure
var table info_table = table.new(position.top_right, 2, 4, bgcolor=color.white, border_width=1)
if barstate.islast
table.cell(info_table, 0, 0, "Market Structure", bgcolor=color.gray)
table.cell(info_table, 1, 0, "Status", bgcolor=color.gray)
table.cell(info_table, 0, 1, "Bullish BOS", bgcolor=bull_bos ? color.green : color.red)
table.cell(info_table, 1, 1, bull_bos ? "ACTIVE" : "INACTIVE")
table.cell(info_table, 0, 2, "Bearish BOS", bgcolor=bear_bos ? color.red : color.green)
table.cell(info_table, 1, 2, bear_bos ? "ACTIVE" : "INACTIVE")
table.cell(info_table, 0, 3, "FVG Count", bgcolor=color.blue)
table.cell(info_table, 1, 3, str.tostring(bar_index))

Ultimate SMC Dashboard — Pro v2.1 (ICT/SMC)
🔍 1. General Objective of the Script
This script is a complete visual and algorithmic SMC (Smart Money Concepts) analysis system that:
* Automatically identifies market structures (BOS / CHoCH / Liquidity Grab).
* Detects and dynamically maintains Fair Value Gaps (FVG) according to ICT methodology .
* Draws and tracks the evolution of Order Blocks (OB) and Breaker Blocks (BRK) .
* Calculates MACD / Volume divergences .
* Analyzes trend, volume, and buyer/seller dominance .
* Displays a clear and dynamic dashboard directly on the chart.
* Builds the foundation for reversal / continuation probability models .
---
⚙️ 2. Input Parameters
The script is highly configurable. Inputs are organized by sections:
Structure (ICT)
* Pivot left/right (swing length) → determines the swing size for HH/LL detection.
* OB lookback → number of candles to look back for an Order Block after a BOS.
* Show BOS / CHoCH / Liquidity Grab → enables or disables structural elements.
Imbalances (FVG)
* Enables the display of Fair Value Gaps .
* Manages minimum size, transparency, and **dynamic reduction** when partially filled.
* Limits the maximum number of FVGs displayed simultaneously.
Order Blocks / Breakers
* Enables Order Blocks and Breaker Blocks .
* Defines their colors, opacity , and dynamic behavior .
* Automatically removes outdated OBs exceeding the maximum limit.
Signal & Probabilities
* Sets the lookback period for structure calculation.
* Calculates average volume (MA) to detect dominance and momentum.
* Defines the probability threshold for signals (not yet visible in this snippet).
RSI / EMA / Divergences / Sentiment
* Prepares additional indicator modules, such as:
* MACD divergence detection
* RSI / EMA visualization
* Market sentiment and funding metrics
---
🧠 3. Market Structure Logic (ICT Core)
a. Pivot Detection
Uses ta.pivothigh and ta.pivotlow to detect Higher Highs (HH) and Lower Lows (LL) .
b. Break of Structure (BOS)
A BOS occurs when price breaks a validated swing high or low:
* bullBOS → bullish break.
* bearBOS → bearish break.
c. Change of Character (CHoCH)
A CHoCH is detected when BOS direction changes (e.g., a bullish BOS followed by a bearish BOS).
d. Liquidity Grab
Detection of liquidity sweeps :
* grabUp : wick above the last high, closing below.
* grabDown : wick below the last low, closing above.
All these signals feed into the main trend bias (Bull / Bear / Flat).
---
🧱 4. Fair Value Gaps (FVG)
The FVG logic strictly follows ICT principles :
* Bullish FVG: if `low > high `
* Bearish FVG: if `high < low `
Each FVG becomes a dynamic box :
* Shrinks in real time as price partially fills it.
* Automatically deletes itself once fully closed.
* Color and opacity depend on direction (green = bullish, red = bearish).
This is one of the most complex parts of the code, managing:
* Arrays of box objects (`array`)
* Real-time updates for every candle
* Automatic cleanup to prevent chart overload
---
🧱 5. Order Blocks (OB) and Breaker Blocks
An Order Block is generated:
* After a BOS,
* By identifying the last candle opposite to the trend before the break.
Examples:
* Bullish BOS → Bullish OB = last red candle before the breakout.
* Bearish BOS → Bearish OB = last green candle before the breakdown.
Each OB:
* Is visualized as a colored rectangle (cyan or orange).
* Becomes inactive once mitigated (touched).
* Is removed and converted into a Breaker Block if invalidated (opposite side broken).
The system uses arrays similar to FVGs to maintain visual cleanliness and chart efficiency .
---
📊 6. Volume and Dominance
The script computes:
* A moving average (SMA) of volume.
* Whether the current volume is abnormally high or low .
* Whether candles are buyer- or seller-dominant .
Simplified display:
* 🔥 High Volume
* 📉 Low Volume
* 🟩 Buyers Dominant
* 🟥 Sellers Dominant
* ⚪️ Neutral
---
🧩 7. Textual Dashboard
Text variables such as:
* `struct_txt` → displays BOS, CHoCH, Grab info
* `fvg_txt` → “🟢 Open” or “🔴 Close”
* `ob_txt` → “🟩 Open” or “🟥 Close”
These feed a visual dashboard (not yet displayed in this excerpt), summarizing the entire market state in real time.
---
💡 8. Summary
The script:
* Observes market structure (ICT) .
* Automatically draws institutional imbalance and interest zones (OB, FVG).
* Dynamically manages their evolution.
* Provides visual structural, volume, and sentiment signals .
* Builds a complete foundation for a professional ICT/SMC dashboard .

PowerHouse SwiftEdge AI v2.10 StrategyOverview
The PowerHouse SwiftEdge AI v2.10 Strategy is a sophisticated trading system designed to identify high-probability trade setups in forex, stocks, and cryptocurrencies. By combining multi-timeframe trend analysis, momentum signals, volume confirmation, and smart money concepts (Change of Character and Break of Structure ), this strategy offers traders a robust tool to capitalize on market trends while minimizing false signals. The strategy’s unique “AI” component analyzes trends across multiple timeframes to provide a clear, actionable dashboard, making it accessible for both novice and experienced traders. The strategy is fully customizable, allowing users to tailor its filters to their trading style.
What It Does
This strategy generates Buy and Sell signals based on a confluence of technical indicators and smart money concepts. It uses:
Multi-Timeframe Trend Analysis: Confirms the market’s direction by analyzing trends on the 1-hour (60M), 4-hour (240M), and daily (D) timeframes.
Momentum Filter: Ensures trades align with strong price movements to avoid choppy markets.
Volume Filter: Validates signals with above-average volume to confirm market participation.
Breakout Filter: Requires price to break key levels for added confirmation.
Smart Money Signals (CHoCH/BOS): Identifies reversals (CHoCH) and trend continuations (BOS) based on pivot points.
AI Trend Dashboard: Summarizes trend strength, confidence, and predictions across timeframes, helping traders make informed decisions without needing to analyze complex data manually.
The strategy also plots dynamic support and resistance trendlines, take-profit (TP) levels, and “Get Ready” signals to alert users of potential setups before they fully develop. Trades are executed with predefined take-profit and stop-loss levels for disciplined risk management.
How It Works
The strategy integrates multiple components to create a cohesive trading system:
Multi-Timeframe Trend Analysis:
The strategy evaluates trends on three timeframes (1H, 4H, Daily) using Exponential Moving Averages (EMA) and Volume-Weighted Average Price (VWAP). A trend is considered bullish if the price is above both the EMA and VWAP, bearish if below, or neutral otherwise.
Signals are only generated when the trend on the user-selected higher timeframe aligns with the trade direction (e.g., Buy signals require a bullish higher timeframe trend). This reduces noise and ensures trades follow the broader market context.
Momentum Filter:
Measures the percentage price change between consecutive bars and compares it to a volatility-adjusted threshold (based on the Average True Range ). This ensures trades are taken only during significant price movements, filtering out low-momentum conditions.
Volume Filter (Optional):
Checks if the current volume exceeds a long-term average and shows positive short-term volume change. This confirms strong market participation, reducing the risk of false breakouts.
Breakout Filter (Optional):
Requires the price to break above (for Buy) or below (for Sell) recent highs/lows, ensuring the signal aligns with a structural shift in the market.
Smart Money Concepts (CHoCH/BOS):
Change of Character (CHoCH): Detects potential reversals when the price crosses under a recent pivot high (for Sell) or over a recent pivot low (for Buy) with a bearish or bullish candle, respectively.
Break of Structure (BOS): Confirms trend continuations when the price breaks below a recent pivot low (for Sell) or above a recent pivot high (for Buy) with strong momentum.
These signals are plotted as horizontal lines with labels, making it easy to visualize key levels.
AI Trend Dashboard:
Combines trend direction, momentum, and volatility (ATR) across timeframes to calculate a trend score. Scores above 0.5 indicate an “Up” trend, below -0.5 indicate a “Down” trend, and otherwise “Neutral.”
Displays a table summarizing trend strength (as a percentage), AI confidence (based on trend alignment), and Cumulative Volume Delta (CVD) for market context.
A second table (optional) shows trend predictions for 1H, 4H, and Daily timeframes, helping traders anticipate future market direction.
Dynamic Trendlines:
Plots support and resistance lines based on recent swing lows and highs within user-defined periods (shortTrendPeriod, longTrendPeriod). These lines adapt to market conditions and are colored based on trend strength.
Why This Combination?
The PowerHouse SwiftEdge AI v2.10 Strategy is original because it seamlessly integrates traditional technical analysis (EMA, VWAP, ATR, volume) with smart money concepts (CHoCH, BOS) and a proprietary AI-driven trend analysis. Unlike standalone indicators, this strategy:
Reduces False Signals: By requiring confluence across trend, momentum, volume, and breakout filters, it minimizes trades in choppy or low-conviction markets.
Adapts to Market Context: The ATR-based momentum threshold adjusts dynamically to volatility, ensuring signals remain relevant in both trending and ranging markets.
Simplifies Decision-Making: The AI dashboard distills complex multi-timeframe data into a user-friendly table, eliminating the need for manual analysis.
Leverages Smart Money: CHoCH and BOS signals capture institutional price action patterns, giving traders an edge in identifying reversals and continuations.
The combination of these components creates a balanced system that aligns short-term trade entries with longer-term market trends, offering a unique blend of precision, adaptability, and clarity.
How to Use
Add to Chart:
Apply the strategy to your TradingView chart on a liquid symbol (e.g., EURUSD, BTCUSD, AAPL) with a timeframe of 60 minutes or lower (e.g., 15M, 60M).
Configure Inputs:
Pivot Length: Adjust the number of bars (default: 5) to detect pivot highs/lows for CHoCH/BOS signals. Higher values reduce noise but may delay signals.
Momentum Threshold: Set the base percentage (default: 0.01%) for momentum confirmation. Increase for stricter signals.
Take Profit/Stop Loss: Define TP and SL in points (default: 10 each) for risk management.
Higher/Lower Timeframe: Choose timeframes (60M, 240M, D) for trend filtering. Ensure the chart timeframe is lower than or equal to the higher timeframe.
Filters: Enable/disable momentum, volume, or breakout filters to suit your trading style.
Trend Periods: Set shortTrendPeriod (default: 30) and longTrendPeriod (default: 100) for trendline plotting. Keep below 2000 to avoid buffer errors.
AI Dashboard: Toggle Enable AI Market Analysis to show/hide the prediction table and adjust its position.
Interpret Signals:
Buy/Sell Labels: Green "Buy" or red "Sell" labels indicate trade entries with predefined TP/SL levels plotted.
Get Ready Signals: Yellow "Get Ready BUY" or orange "Get Ready SELL" labels warn of potential setups.
CHoCH/BOS Lines: Aqua (CHoCH Sell), lime (CHoCH Buy), fuchsia (BOS Sell), or teal (BOS Buy) lines mark key levels.
Trendlines: Green/lime (support) or fuchsia/purple (resistance) dashed lines show dynamic support/resistance.
AI Dashboard: Check the top-right table for trend strength, confidence, and CVD. The optional bottom table shows trend predictions (Up, Down, Neutral).
Backtest and Trade:
Use TradingView’s Strategy Tester to evaluate performance. Adjust TP/SL and filters based on results.
Trade manually based on signals or automate with TradingView alerts (set alerts for Buy/Sell labels).
Originality and Value
The PowerHouse SwiftEdge AI v2.10 Strategy stands out by combining multi-timeframe analysis, smart money concepts, and an AI-driven dashboard into a single, user-friendly system. Its adaptive momentum threshold, robust filtering, and clear visualizations empower traders to make confident decisions without needing advanced technical knowledge. Whether you’re a day trader or swing trader, this strategy provides a versatile, data-driven approach to navigating dynamic markets.
Important Notes:
Risk Management: Always use appropriate position sizing and risk management, as the strategy’s TP/SL levels are customizable.
Symbol Compatibility: Test on liquid symbols with sufficient historical data (at least 2000 bars) to avoid buffer errors.
Performance: Backtest thoroughly to optimize settings for your market and timeframe.

Multi Timeframe Market Structure ContinuationOverview
This indicator identifies Break of Structure (BOS) and Change of Character (ChoCh) patterns using multi-timeframe (MTF) analysis to filter high-probability trade setups. By aligning lower timeframe signals with higher timeframe bias, it helps traders enter positions in the direction of the dominant trend while avoiding counter-trend traps.
Multi-Timeframe Analysis
The indicator analyzes market structure on two timeframes simultaneously:
Current Timeframe (CTF): Detects immediate BOS and ChoCh signals for entry timing
Higher Timeframe (HTF): Establishes the overall trend direction (default: 1H, customizable)
Signals only appear when the current timeframe structure aligns with the higher timeframe bias, ensuring you're trading with the momentum, not against it.
Break of Structure (BOS)
BOS signals indicate trend continuation - when price breaks a previous high in an uptrend or a previous low in a downtrend. These are reliable entries that confirm the trend is still active and strong.
Change of Character (ChoCh)
ChoCh signals mark early trend reversals - when market structure shifts from bearish to bullish (or vice versa). When captured in alignment with the higher timeframe trend, ChoCh entries can achieve exceptional risk-to-reward ratios as they allow entry near the beginning of a new impulse move.
Exit Signals
Exit signals are plotted when a ChoCh occurs in the opposite direction of the HTF trend. For example, if the HTF is bullish and a bearish ChoCh forms on the current timeframe, an orange "EXIT" signal appears - warning long traders that the lower timeframe structure is shifting against them. This provides an early warning system to protect profits or minimize losses before the HTF trend itself reverses.
Trading Strategy Recommendations
Trending Markets (Recommended)
In strong trending conditions, both BOS and ChoCh signals can be taken when aligned with the HTF bias. ChoCh entries are particularly powerful as they catch early reversals within the larger trend, offering entries with tight stop losses and extended profit targets.
Ranging Markets
During consolidation or choppy conditions, it's best to be selective and take only BOS entries. BOS signals confirm that the trend is continuing beyond the range, reducing false breakouts and whipsaw trades that are common with counter-trend ChoCh signals in sideways markets.
Customization
Pivot Length: Adjust the sensitivity of structure detection (default: 5). Lower values detect structure more frequently with earlier but potentially noisier signals. Higher values provide cleaner, more significant structural breaks but with some delay.
Higher Timeframe: Customize the HTF to suit your trading style. Day traders might use 1H HTF on 5m charts, while swing traders could use 4H or Daily HTF.
Alert System
Six alert conditions available:
Long BOS Entry / Long ChoCh Entry
Short BOS Entry / Short ChoCh Entry
Long Exit / Short Exit
All alerts fire only on confirmed candle closes to eliminate repainting and false signals.
Visual Features
Color-coded background showing HTF bias
Clear BOS/ChoCh labels with horizontal lines at structure levels
Orange "EXIT" signals when structure breaks against your position
Gray lines tracking current swing highs/lows
HTF trend indicator in the top-right corner
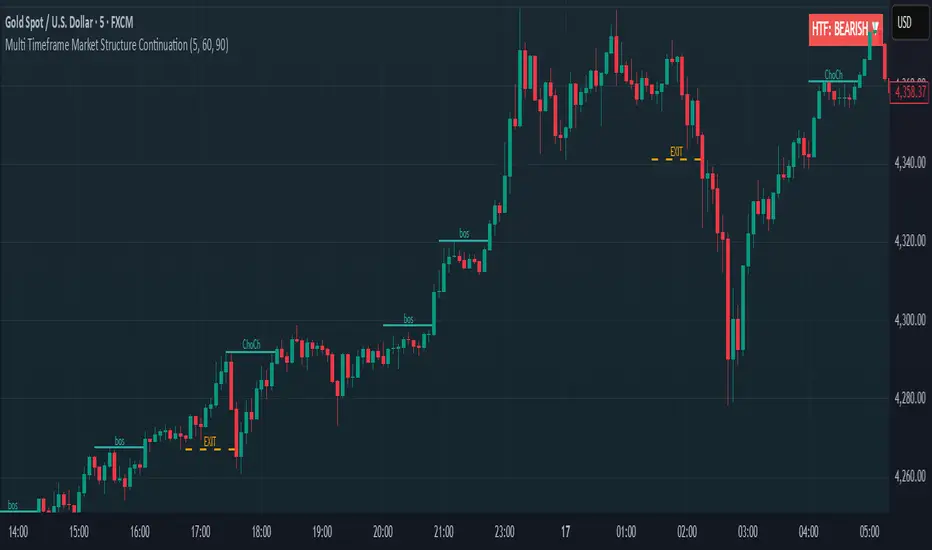
Market structure + TF Bucket Market Structure + TF Bucket
This Pine Script™ indicator, published under the Mozilla Public License 2.0, extends the "Market Structure" script by mickes (), with full credit to mickes. It integrates the enhanced MarketStructure library by Fenomentn (), also based on mickes’ library under MPL 2.0, to provide advanced market structure analysis with multi-timeframe pivot length customization.
Functionality
Market Structure Analysis: Detects internal (orderflow) and swing market structures, visualizing Break of Structure (BOS), Change of Character (CHoCH), Equal High/Low (EQH/EQL), and liquidity zones using the MarketStructure library.
Timeframe Bucket (TF Bucket): Dynamically adjusts pivot lengths for six user-defined timeframes (e.g., 3m, 5m, 10m, 15m, 4h, 12h), optimizing structure detection across different chart timeframes.
Trend Strength Visualization: Displays a trend strength metric (from the library) for internal and swing structures, indicating trend reliability based on pivot frequency and volatility.
Statistics Table: Shows yearly counts of BOS and CHoCH events for internal and swing structures, configurable by a user-defined period.
Screener Support: Outputs BOS and CHoCH signals for TradingView’s screener, with a configurable signal persistence period.
Customizable Alerts: Enables alerts for BOS and CHoCH events, separately configurable for internal and swing structures.
Methodology
Pivot Detection: Uses the library’s Pivot function, which applies a volatility filter (ATR-based) to confirm significant pivots, reducing false signals in low-volatility markets.
TF Bucket: Maps user-selected timeframes to Pine Script’s timeframe.period using f_getTimeframePeriod, applying custom pivot lengths when the chart’s timeframe matches a selected one (or base lengths in Static mode).
Trend Strength: Calculates a score as pivotCount / LeftLength * (currentATR / ATR), displayed via labels to help traders assess trend reliability.
BOS/CHoCH Detection: Identifies BOS when price breaks a pivot in the trend direction and CHoCH when price reverses against the trend, labeling events as “MSF” or “MSF+” based on pivot patterns.
EQH/EQL and Liquidity: Draws boxes for equal high/low zones within ATR-based thresholds and visualizes liquidity levels with confirmation bars.
Statistics and Screener: Tracks BOS/CHoCH events in a yearly table and outputs signals for screener use, with persistence controlled by a user-defined period.
Usage
Integration: Apply the indicator to any chart and import the library via import Fenomentn/MarketStructure/1.
Configuration: Set up to six timeframes with custom pivot lengths, enable/disable internal and swing structures, configure alerts, and adjust statistics years in the settings panel.
Alerts: Enable BOS and CHoCH alerts for real-time notifications, triggered on bar close to avoid repainting.
Screener: Use the plotted signals to monitor BOS/CHoCH events across multiple tickers in TradingView’s screener.
Best Practices: Optimal for forex and crypto charts on 1m to 12h timeframes. Adjust pivot lengths and the library’s volatility threshold for specific market conditions.
Originality
This indicator enhances mickes’ original script with:
Timeframe Bucket: Dynamic pivot length selection for multi-timeframe analysis, not present in the original.
Trend Strength Display: Visualizes the library’s TrendStrength metric for enhanced trend analysis.
Enhanced Library Integration: Leverages Fenomentn/MarketStructure/1, which adds a volatility-based pivot filter, dynamic label sizing, and customizable BOS/CHoCH visualization styles.No additional open-source code was reused beyond mickes’ script and library, fully credited under MPL 2.0.

PowerHouse SwiftEdge AI v2.10 with Custom Filters & AI AnalysisPowerHouse SwiftEdge AI v2.10 with Custom Filters & AI Analysis
Overview
PowerHouse SwiftEdge AI v2.10 is an advanced TradingView Pine Script indicator designed to identify high-probability trading setups by combining pivot-based structure analysis, multi-timeframe trend detection, and adaptive AI-driven signal filtering. The script integrates Change of Character (CHoCH) and Break of Structure (BOS) signals with customizable momentum, volume, breakout, and trend filters to enhance trade precision. Additionally, it offers an optional AI Market Analysis module that predicts future price trends across multiple timeframes, providing traders with a comprehensive market outlook.
The script is highly customizable, allowing users to tailor inputs to their trading style, whether for scalping, swing trading, or long-term strategies. It is suitable for all asset classes, including stocks, forex, crypto, and commodities, and performs optimally on timeframes ranging from 1-minute to daily charts.
Key Features
Pivot-Based Signal Generation:
Identifies pivot highs and lows to detect CHoCH (reversal patterns) and BOS (continuation patterns).
Signals are plotted as "Buy" or "Sell" labels with optional "Get Ready" pre-signals to prepare traders for potential setups.
Take-profit (TP) levels are automatically calculated based on user-defined points, with optional TP box visualization.
Multi-Timeframe Trend Analysis:
Analyzes trends across seven timeframes (1M, 5M, 15M, 30M, 1H, 4H, D) using EMA and VWAP to determine bullish, bearish, or neutral conditions.
Displays a futuristic AI-Trend Matrix dashboard showing trend direction, strength, and confidence levels for quick decision-making.
Customizable Signal Filters:
Momentum Filter: Ensures signals align with significant price changes, adjusted dynamically using ATR-based volatility.
Higher Timeframe Trend Filter: Requires signals to align with the trend of a user-selected higher timeframe (e.g., 1H).
Lower Timeframe Trend Filter: Prevents signals that conflict with the trend of a user-selected lower timeframe (e.g., 5M).
Volume Filter: Optionally requires above-average volume to confirm signals.
Breakout Filter: Optionally requires price to break previous highs/lows for signal validation.
Repeated Signal Restriction: Prevents consecutive signals in the same trend direction until the trend changes on a user-defined timeframe.
AI-Driven Adaptivity:
Incorporates Cumulative Volume Delta (CVD) to assess buying/selling pressure and classify market volatility (Low, Medium, High).
Uses ATR to dynamically adjust momentum thresholds, ensuring signals adapt to current market conditions.
Optional AI Market Analysis module predicts trends across multiple timeframes by combining trend, momentum, and volatility scores.
Visual Elements:
Plots CHoCH and BOS levels as horizontal lines with distinct colors (aqua for CHoCH sell, lime for CHoCH buy, fuchsia for BOS sell, teal for BOS buy).
Draws dynamic support and resistance trendlines based on short and long-term price action, colored by trend strength.
Displays TP levels and pivot highs/lows for easy reference.
How It Works
The script combines several technical analysis concepts to create a robust trading system:
Market Structure Analysis:
Pivot highs and lows are identified using a user-defined lookback period (Pivot Length).
CHoCH occurs when price crosses below a pivot high (bearish reversal) or above a pivot low (bullish reversal).
BOS occurs when price breaks a previous pivot low (bearish continuation) or pivot high (bullish continuation).
Trend and Momentum Integration:
Trends are determined by comparing price to EMA and VWAP on multiple timeframes.
Momentum is calculated as the percentage price change, with thresholds adjusted by ATR to account for volatility.
"Get Ready" signals appear when momentum approaches the threshold, preparing traders for potential CHoCH or BOS signals.
Signal Filtering:
Filters ensure signals align with user-defined criteria (e.g., trend direction, volume, breakouts).
The Restrict Repeated Signals option prevents over-signaling by requiring a trend change on a specified timeframe before generating a new signal in the same direction.
AI Market Analysis:
The optional AI module calculates a score for each timeframe based on trend direction, momentum, and volatility (ATR compared to its SMA).
Scores are translated into predictions (▲ for bullish, ▼ for bearish, — for neutral), displayed in a dedicated table.
CVD and Volatility Context:
CVD tracks buying vs. selling pressure by accumulating volume based on price direction.
Volatility is classified using CVD magnitude, influencing the script’s visual cues and signal sensitivity.
Why This Combination?
The integration of pivot-based structure analysis, multi-timeframe trend filtering, and AI-driven adaptivity addresses common trading challenges:
Precision: CHoCH and BOS signals focus on key market turning points, reducing noise from minor price fluctuations.
Context: Multi-timeframe analysis ensures trades align with broader market trends, improving win rates.
Adaptivity: ATR and CVD adjustments make the script responsive to changing market conditions, avoiding static thresholds that fail in volatile or quiet markets.
Customization: Extensive input options allow traders to adapt the script to their preferred markets, timeframes, and risk profiles.
Predictive Insight: The AI Market Analysis module provides forward-looking trend predictions, helping traders anticipate market moves.
This combination creates a self-contained system that balances responsiveness with reliability, making it suitable for both novice and experienced traders.
How to Use
Add to Chart:
Apply the indicator to your TradingView chart for any asset and timeframe.
Recommended timeframes: 5M to 1H for scalping/day trading, 4H to D for swing trading.
Configure Inputs:
Pivot Length: Adjust (default 5) to control sensitivity to pivot highs/lows. Lower values for faster signals, higher for stronger confirmations.
Momentum Threshold: Set the minimum price change (default 0.01%) for signals. Increase for stricter conditions.
Take Profit Points: Define TP distance (default 10 points). Adjust based on asset volatility.
Signal Filters: Enable/disable filters (momentum, trend, volume, breakout) to match your strategy.
Higher/Lower Timeframe: Select timeframes for trend alignment (e.g., 1H for higher, 5M for lower).
AI Market Analysis: Enable for predictive trend insights across timeframes.
Get Ready Signals: Enable to see pre-signals for potential setups.
Interpret Signals:
Buy/Sell Labels: Act on green "Buy" or red "Sell" labels, confirming with TP levels and trend direction.
Get Ready Labels: Yellow "Get Ready BUY" or orange "Get Ready SELL" indicate potential setups; prepare but wait for confirmation.
CHoCH/BOS Lines: Use aqua/lime (CHoCH) and fuchsia/teal (BOS) lines as key support/resistance levels.
AI-Trend Matrix: Check the top-right dashboard for trend strength (%), confidence (%), and timeframe-specific trends.
AI Market Analysis Table: If enabled, view predictions (▲/▼/—) for each timeframe to anticipate market direction.
Trading Tips:
Combine signals with other indicators (e.g., RSI, MACD) for additional confirmation.
Use higher timeframe trend alignment for higher-probability trades.
Adjust TP and signal distance based on asset volatility and trading style.
Monitor the AI-Trend Matrix for trend strength; values above 50% or below -50% indicate strong directional bias.
Originality
PowerHouse SwiftEdge AI v2.10 stands out due to its unique blend of:
Adaptive Signal Generation: ATR-based momentum thresholds and CVD-driven volatility context ensure signals remain relevant across market conditions.
Multi-Timeframe Synergy: The script’s ability to filter signals based on both higher and lower timeframe trends provides a rare balance of precision and context.
AI-Powered Insights: The AI Market Analysis module offers predictive capabilities not commonly found in traditional indicators, simulating institutional-grade analysis.
Visual Clarity: The futuristic dashboard and color-coded trendlines make complex data accessible, enhancing usability for all trader levels.
Unlike standalone pivot or trend indicators, this script integrates multiple layers of analysis into a cohesive system, reducing false signals and providing actionable insights without requiring external tools or research.
Limitations
False Signals: No indicator is foolproof; signals may fail in choppy or low-volume markets. Use filters to mitigate.
Timeframe Sensitivity: Performance varies by timeframe and asset. Test settings thoroughly.
AI Predictions: The AI Market Analysis is based on historical data and simplified scoring; it’s not a guaranteed forecast.
Resource Usage: Enabling all filters and AI analysis may slow performance on lower-end devices.

RunRox - Advanced SMC⭐️ Introducing Our Advanced SMC Indicator: Elevate Your Smart Money Concept Trading
We are excited to present our innovative indicator, specifically designed for the Smart Money Concept (SMC). Our approach goes beyond the traditional SMC strategy by offering significant enhancements that can help you achieve stronger trading performance.
We employ a more sophisticated SMC structure, incorporating improved IDM (Inducement) logic, both internal and external structures, and four types of order blocks. This allows for deeper insights into market trends and a clearer understanding of how major market participants may be manipulating price action.
🟠 Indicator Features:
Structure
HTF Structure – Choose any timeframe and display its structure on your current chart.
CHoCH | BOS | IDM – Display any components from this structure.
Market Minor Structure – Swing and Minor structure.
BOS/CHoCH Breaking by (Body | Wick) – Choose the principle for building the structure, either by the candle body or by their wicks.
BOS/CHoCH Move if Swept – When liquidity is taken, decide whether to move the structure line higher or consider it a structural break.
Move CHoCH/BOS – Relocate key points on the chart if the structure becomes too large.
FVG Concept
HTF FVG – Choose any timeframe from which you want to display FVG on your current chart
Three Types of FVG – Classic FVG, Double FVG, Implied Imbalance
Reaction to FVG – Show the market’s reaction to FVG on the chart
Mitigation Method – Select the fill method that suits your approach (Touch/Midline/Complete)
Remove Filled FVG – Remove FVGs from the chart once they have been filled
Combine FVG – Merge several consecutive FVGs into one
Length FVG – Adjust the number of candles that define the FVG
OrderBlock Concept
HTF OrderBlock – Choose any timeframe from which you want to display orderblocks on your current chart
Swing and Minor Orderblocks – Display only the orderblocks you need, whether from the Swing or Minor structure
Four Types of Order Blocks – Advanced OB, Classic OB, BTS/STB zones, Extremum Candle
Block Based on – Decide whether to base the orderblock on candle highs/lows or candle open/close
Mitigation Method – Define when an orderblock is considered filled (Touch/Midline/Complete)
Remove Blocks Older – Remove older orderblocks from the chart
Hide Overlap – Disable overlapping orderblocks when they appear in the same area
Eat Young Blocks – Reduce the size of an orderblock until it fully forms
Hide Distant Blocks – Remove orderblocks that are too far from the current price
Previous Highs & Lows
Four Level Types – Day, Week, Month, Quarter
Style Customization – Choose line color, line style, and transparency
Fibonacci Retracements
10 Template Options – Ten different bases on which you can build your Fibonacci grid
Up to 7 Levels – Add up to seven Fibonacci levels for your convenience
Fibo Inversion – Option to invert the Fibonacci grid
Style Customization – Choose line colors, line styles, and transparency
Additional Functions
Premium & Discount Zones – A popular concept we’ve incorporated to help identify potential trading areas within premium or discount prices
Equal Highs & Lows – High-liquidity levels where market makers may seek liquidity
Color Candles – Automatically colors candles based on the current trend
Market Structure ZigZag – Offers a clear visual of the zigzag pattern on which the structure is built
Key Point Labels – Displays important swing high/low points directly on the chart
General Styling – Customize any chart element, including size, style, color, and transparency
Alert Customization – Over 16 types of alerts, easily configured in a few clicks. Receive only the notifications you need. Custom alerts are also available for developers.
Next, we will provide a detailed overview of all the indicator’s features, accompanied by chart examples.
📈 Structure
What Is IDM?
IDM, or the Institutional Distribution Model, is an advanced concept within SMC that focuses on how institutional players distribute their positions in the market. By analyzing IDM, traders can better anticipate price movements and potential turning points, thereby gaining a meaningful edge in their trading.
In our structure concept, IDM can form under specific conditions. The market does not always provide a high-liquidity point to work with, so we’ve adopted a flexible approach. We generate IDM when a certain type of liquidity appears during the impulse and BOS break, allowing for a potential future liquidity sweep.
Below, I will provide an example that illustrates when IDM forms as a liquidity magnet within the structure - and when it does not.
As shown in the example above, we focus on the initial impulse after the BOS. If liquidity forms during this impulse - liquidity that needs to be taken out during the structural move - we mark an IDM level as a price magnet. However, if this liquidity does not appear, we do not create an IDM. In that case, the same point might serve as an FVG or play a different role, depending on your trading approach.
This concept makes the structure more flexible and better able to respond immediately to market movements and key structural points.
Above is an example on the chart illustrating what the structure looks like both with and without IDM. As you can see, when the structural move includes pullbacks and consolidation, there is an opportunity to form an IDM as a price magnet. However, if the impulses are strong and lack pullbacks, FVG becomes the only magnet in that move. Depending on the chart, our indicator adapts to the current market conditions and highlights potential liquidity collection points.
📊 Swing and Minor Structure
In the new version of the indicator, the minor structure and the swing structure differ from each other.
Swing structure - In this structure, as mentioned earlier, the IDM concept remains a price magnet and is formed at certain points on the chart if the conditions allow. If these points do not appear, IDM might not form at all.
Minor structure - Here, we have completely removed IDM and only kept BOS and CHoCH for structure formation. We found that for a minor structure, this approach allows faster reactions to trend changes, depending on market movements.
By making these adjustments, we have resolved the main issue of the advanced structure, which was the large distance between BOS and CHoCH that sometimes resulted in a month-long consolidation between these levels. In this version, those problems no longer occur.
If, for some reason, your settings result in a larger swing structure, you can still work with the minor structure using the same POI as in the swing structure. OrderBlock and FVG remain the primary drivers of order flow.
Shown above is a screenshot of the main structure settings you can adjust. These settings are highly flexible and can be tailored to fit a wide range of trading preferences.
⚖️ FVG Concept
A new feature of our indicator is the FVG concept. We automatically detect three types of FVG at the moment, which will be explained below.
FVG - the standard Fair Value Gap
Double FVG - a double FVG, also referred to as BPR (Balanced Price Range)
Implied Imbalance - a type of imbalance that arises from buyer or seller demand
Below, we will look at examples of the FVG types we currently identify.
All price inefficiencies work in real time, immediately appearing on the chart and allowing traders to quickly respond to FVG reactions.
We have also enhanced this concept by displaying FVG reactions on the chart. If an FVG triggers a reaction and the price responds to that range, we highlight it on the chart, so you can recognize the reaction and make timely trading decisions. A screenshot below shows how this looks in practice.
Below is a screenshot illustrating the main settings of this concept, along with detailed descriptions.
📦 OrderBlock Concept
OrderBlocks provide an effective way to identify areas of interest and make informed decisions. We have dedicated significant effort to refining this section’s functionality and have achieved strong results in doing so.
Order Block Types
Advanced OrderBlock – A specialized type of order block generated by our internal algorithm. This can help traders aim for tighter entries and potentially more favorable risk-reward ratios within a narrow price range.
OrderBlock – The classic type, formed at the highs or lows of a structure when a BOS or CHoCH occurs. It can still be an effective entry method but typically spans a wider price range.
Extremum Candle – Based on liquidity grabs. The candle creating this order block must collect liquidity before making an impulsive move that breaks the BOS or CHoCH.
BTS / STB (Buy To Sell / Sell To Buy) – This concept may appear when market makers manipulate price to buy or sell an asset. It often covers a larger price range because it relies on a brief impulsive move to form.
Each type of order block has its own strengths and weaknesses. We provide traders with the flexibility to choose which types suit their trading style and preferences.
Above is an example of how you can apply OrderFlow alongside our structure and orderblocks, which can produce solid results when combined with the Smart Money concept.
In this demonstration, we have highlighted the Advanced Orderblock as an illustration.
Above is a screenshot of all the settings related to this section. They can be customized to suit your specific needs, ensuring you only see what is genuinely relevant on your chart.
📏 Previous Highs and Lows
You can select four levels to display on the chart as some of the most liquid zones:
Daily Highs and Lows
Weekly Highs and Lows
Monthly Highs and Lows
Quarterly Highs and Lows
This feature helps you identify important levels on lower timeframes and focus on these zones for potential trading opportunities. Below is an example of how it appears on the chart.
Below, you can see the settings available in this section.
📐 Fibonacci Levels
Likewise, a new section in our indicator is Fibonacci Levels, a well-known tool recognized as a reliable source of important levels on the chart. We have added this functionality with the option to choose how you want to generate these levels and which specific levels you want to display.
You can plot Fibonacci levels based on the Swing structure, Minor structure, previous or current day, month, and more. In total, there are 10 different options for constructing the Fibonacci grid.
Above, you can see an example of how it appears on the chart, and below you will find the settings available in this section.
🈹 Premium and Discount
Another useful feature for all traders is the Premium and Discount zones based on structure. This makes it easy to identify areas of interest—whether in a discount or premium zone, or in an equilibrium area.
Below, you can also see the settings available in this section.
✅ Additional Function
We have also separated a few functions into their own section:
Color Candles – Colors the candles according to the current trend.
Market Structure ZigZag – Visually highlights the zigzag used to form the structure.
Key Point Labels – Displays the points on the chart from which the structure is built.
Equal Highs & Lows – Identifies equal highs and lows as areas of potential liquidity for larger market players, as price often aims to sweep these zones.
Below are a few screenshots showing how these features appear on the chart.
Color Candles
Market Structure ZigZag and Key Point Labels
Equal Highs & Lows
Below, you can see a screenshot displaying all the settings available in this section.
🎨 General Styling
We have devoted considerable effort to providing flexible customization for each element on the chart, so you can design the exact look you want. That’s why we created an additional section where you can adjust any element’s size, style, and more.
Combined with extensive color and transparency options, this feature provides a flexible appearance for the indicator on any chart.
Below, you can see the settings available in this section
🔔 Alert Customization
You can configure over 16 types of reactions to various events on the chart. Additionally, you can set up alerts to trigger at specific fill levels and explore numerous other alert options, as shown in the screenshot below.
🟠 Usage Examples
We have also prepared several examples of how to use the indicator. These are standard entry models taken from the classic Smart Money concept.
First Example
In the screenshot above, the market displays a downward structure until a manipulation occurs, followed by a CHoCH break. This is a standard entry model featuring an entry at the nearest FVG, a stop-loss placed beyond the manipulation, and a target at the nearest liquidity zone—whether session-based or, as in our case, a gap (one of the FVG types) that price commonly revisits.
This is considered a more aggressive entry because we only waited for a single confirmation of the trend change—the CHoCH break—and then entered immediately afterward. While the WinRate might be lower in such trades, the Risk-Reward ratio is typically very high if you correctly identify the manipulation.
Second Example
This approach is more conservative and less risky, typically offering a higher WinRate but with a lower Risk-Reward ratio.
Here, we use the 4H FVG as our decision point (POI). With the indicator, we plot the 4-hour FVG on our current chart without needing to switch back and forth between timeframes.
Once price reaches our POI, we look for an entry model that includes three confirmations:
First Confirmation – A CHoCH break.
Second Confirmation – A manipulation.
Third Confirmation – A second BOS break.
We wait for all these confirmations before entering the trade, ensuring our stop-loss is well-protected since the remaining liquidity has been swept and the 4-hour FVG has been fully filled.
Our target is the full fill of a higher timeframe FVG or other high-liquidity levels below.
In a conservative setup, it is crucial to allow a complete OrderFlow to develop, including manipulations and clear breaks of lower levels. This approach helps protect the trade and often results in a higher WinRate.
🟠 Disclaimer
Past performance is not indicative of future results. To trade successfully, it is crucial to have a thorough understanding of the market context and the specific situation at hand. Always conduct your own research and analysis before making any trading decisions.
To gain access to the indicator, please review the author's instructions below this post

Scalping Market Strctures[SumitQuants]🇮🇳🔥 **Scalping Market Structures
**
Built for Scalper and Market Structure Breakout Trader
A clean, lightning-fast market structure engine designed for Indian scalpers who need precise Swing Points, BOS/CHoCH, and True Breakout Signals — without clutter, lag, or noise.
Perfect for 1-min, 3-min, 5-min scalping on indices & stocks.
🧠 Why This Indicator Stands Out
Most structure tools repaint or clutter your chart.
This one is simple, sharp, and brutally effective.
It reveals:
➡ True swing highs & lows
➡ Where structure flips (BOS/CHoCH)
➡ Counter-trend reversals
➡ Buy/Sell pressure points
➡ 0.5 retracement zones for sniper entries
It reads the chart the way scalpers need:
Fast. Clean. Accurate.
🔥 What’s Inside (Complete Feature Stack)
🎯 1. Automatic Swing High/Low Detection (Scalper-Optimized)
Instant swing labeling that adapts to your timeframe:
✔ HH (Higher High)
✔ LH (Lower High)
✔ HL (Higher Low)
✔ LL (Lower Low)
Buy / Sell swing labels appear automatically:
🟥 “Sell ↓” on bearish swing highs
🟩 “Buy ↑” on bullish swing lows
Perfect for reading trend direction in seconds.
⚡ 2. Real BOS & CHoCH Detection
Clean breakout logic that respects your choice:
✔ BOS via Candle Close
✔ BOS via Wick Break
Plus:
✨ CHoCH mode (first counter-trend BOS automatically renamed to CHoCH)
✨ Breakout lines drawn with your color & style
✨ Mid-point BOS labels for perfect visibility
Spot reversals & trend flips with zero confusion.
📏 3. The 0.5 Retracement Tool (Smart Entry Zone)
Beautiful mid-retracement lines drawn ONLY when trend conditions match:
🔹 Appears between recent swing high → low
🔹 Shows ideal 50% pullback zone
🔹 Perfect for sniper re-entries during expansions
Enable/disable anytime. Fully customizable.
🔍 4. Trend Context in One Glance
The script tracks:
✔ Last swing direction
✔ Whether the market is making HH/LH or HL/LL
✔ Bias shift moments
✔ When highs or lows get invalidated
This gives you real structure awareness — the foundation of SMC scalping.
🔔 5. Clean Breakout Visualization
Whenever a swing high or swing low gets taken out:
🔥 A BOS line is drawn
🔥 A BOS/CHoCH label appears
🔥 The previous swing is deactivated
🔥 Trend context is updated instantly
No repaint. No lag. No ambiguity.
🧽 6. Ultra-Clean UI
✔ Minimalist labels
✔ Light/dark-mode friendly
✔ Zero clutter
✔ Focus on price, not drawings
A scalper’s dream: fast, clean, actionable.
🧪 Who Is This Built For?
✔ NIFTY/BANKNIFTY Scalpers
✔ Price Action Traders
✔ SMC Traders
✔ Smart Money Reversal Traders
✔ Anyone who trades 1m–15m charts
✔ Traders who want a simple but powerful structure tool
⚡ Why Indian Traders Love It
🔸 Calls out structure shifts instantly
🔸 Helps spot reversals BEFORE the move starts
🔸 Makes scalping simple & visual
🔸 Eliminates noisy indicators
🔸 Gives pure price-action clarity
🔸 Works on every timeframe & instrument
This is not just a structure tool —
It’s your scalping radar.
🛒 Get Full Access
This indicator is available inside the Courses Section on the official website.
👉 Purchase & Access:
www.ironmindtrader.com
Inside the course:
🔧 Installation Steps
📘 How to Use the Structure System
🎯 Scalping Entry Logic
🔄 Updates Included

Smart Money Flow Index (SMFI) - Advanced SMC [PhenLabs]📊Smart Money Flow Index (SMFI)
Version: PineScript™v6
📌Description
The Smart Money Flow Index (SMFI) is an advanced Smart Money Concepts implementation that tracks institutional trading behavior through multi-dimensional analysis. This comprehensive indicator combines volume-validated Order Block detection, Fair Value Gap identification with auto-mitigation tracking, dynamic Liquidity Zone mapping, and Break of Structure/Change of Character detection into a unified system.
Unlike basic SMC indicators, SMFI employs a proprietary scoring algorithm that weighs five critical factors: Order Block strength (validated by volume), Fair Value Gap size and recency, proximity to Liquidity Zones, market structure alignment (BOS/CHoCH), and multi-timeframe confluence. This produces a Smart Money Score (0-100) where readings above 70 represent optimal institutional setup conditions.
🚀Points of Innovation
Volume-Validated Order Block Detection – Only displays Order Blocks when formation candle exceeds customizable volume multiplier (default 1.5x average), filtering weak zones and highlighting true institutional accumulation/distribution
Auto-Mitigation Tracking System – Fair Value Gaps and Order Blocks automatically update status when price mitigates them, with visual distinction between active and filled zones preventing trades on dead levels
Proprietary Smart Money Score Algorithm – Combines weighted factors (OB strength 25%, FVG proximity 20%, Liquidity 20%, Structure 20%, MTF 15%) into single 0-100 confidence rating updating in real-time
ATR-Based Adaptive Calculations – All distance measurements use 14-period Average True Range ensuring consistent function across any instrument, timeframe, or volatility regime without manual recalibration
Dynamic Age Filtering – Automatically removes liquidity levels and FVGs older than configurable thresholds preventing chart clutter while maintaining relevant levels
Multi-Timeframe Confluence Integration – Analyzes higher timeframe bias with customizable multipliers (2-10x) and incorporates HTF trend direction into Smart Money Score for institutional alignment
🔧Core Components
Order Block Engine – Detects institutional supply/demand zones using characteristic patterns (down-move-then-strong-up for bullish, up-move-then-strong-down for bearish) with minimum volume threshold validation, tracks mitigation when price closes through zones
Fair Value Gap Scanner – Identifies price imbalances where current candle's low/high leaves gap with two-candle-prior high/low, filters by minimum size percentage, monitors 50% fill for mitigation status
Liquidity Zone Mapper – Uses pivot high/low detection with configurable lookback to mark swing points where stop losses cluster, extends horizontal lines to visualize sweep targets, manages lifecycle through age-based removal
Market Structure Analyzer – Tracks pivot progression to identify trend through higher-highs/higher-lows (bullish) or lower-highs/lower-lows (bearish), detects Break of Structure and Change of Character for trend/reversal confirmation
Scoring Calculation Engine – Evaluates proximity to nearest Order Blocks using ATR-normalized distance, assesses FVG recency and distance, calculates liquidity proximity with age weighting, combines structure bias and MTF trend into smoothed final score
🔥Key Features
Customizable Display Limits – Control maximum Order Blocks (1-10), Liquidity Zones (1-10), and FVG age (10-200 bars) to maintain clean charts focused on most relevant institutional levels
Gradient Strength Visualization – All zones render with transparency-adjustable coloring where stronger/newer zones appear more solid and weaker/older zones fade progressively providing instant visual hierarchy
Educational Label System – Optional labels identify each zone type (Bullish OB, Bearish OB, Bullish FVG, Bearish FVG, BOS) with color-coded text helping traders learn SMC concepts through practical application
Real-Time Smart Money Score Dashboard – Top-right table displays current score (0-100) with color coding (green >70, yellow 30-70, red <30) plus trend arrow for at-a-glance confidence assessment
Comprehensive Alert Suite – Configurable notifications for Order Block formation, Fair Value Gap detection, Break of Structure events, Change of Character signals, and high Smart Money Score readings (>70)
Buy/Sell Signal Integration – Automatically plots triangle markers when Smart Money Score exceeds 70 with aligned market structure and fresh Order Block detection providing clear entry signals
🎨Visualization
Order Block Boxes – Shaded rectangles extend from formation bar spanning high-to-low of institutional candle, bullish zones in green, bearish in red, with customizable transparency (80-98%)
Fair Value Gap Zones – Rectangular areas marking imbalances, active FVGs display in bright colors with adjustable transparency, mitigated FVGs switch to gray preventing trades on filled zones
Liquidity Level Lines – Dashed horizontal lines extend from pivot creation points, swing highs in bearish color (short targets above), swing lows in bullish color (long targets below), opacity decreases with age
Structure Labels – "BOS" labels appear above/below price when Break of Structure confirmed, colored by direction (green bullish, red bearish), positioned at 1% beyond highs/lows for visibility
Educational Info Panel – Bottom-right table explains key terminology (OB, FVG, BOS, CHoCH) and score interpretation (>70 high probability) with semi-transparent background for readability
📖Usage Guidelines
General Settings
Show Order Blocks – Default: On, toggles visibility of institutional supply/demand zones, disable when focusing solely on FVGs or Liquidity
Show Fair Value Gaps – Default: On, controls FVG zone display including active and mitigated imbalances
Show Liquidity Zones – Default: On, manages liquidity line visibility, disable on lower timeframes to reduce clutter
Show Market Structure – Default: On, toggles BOS/CHoCH label display
Show Smart Money Score – Default: On, controls score dashboard visibility
Order Block Settings
OB Lookback Period – Default: 20, Range: 5-100, controls bars scanned for Order Block patterns, lower values detect recent activity, higher values find older blocks
Min Volume Multiplier – Default: 1.5, Range: 1.0-5.0, sets minimum volume threshold as multiple of 20-period average, higher values (2.0+) filter for strongest institutional candles
Max Order Blocks to Display – Default: 3, Range: 1-10, limits simultaneous Order Blocks shown, lower settings (1-3) maintain focus on most recent zones
Fair Value Gap Settings
Min FVG Size (%) – Default: 0.3, Range: 0.1-2.0, defines minimum gap size as percentage of close price, lower values detect micro-imbalances, higher values focus on significant gaps
Max FVG Age (bars) – Default: 50, Range: 10-200, removes FVGs older than specified bars, lower settings (10-30) for scalping, higher (100-200) for swing trading
Show FVG Mitigation – Default: On, displays filled FVGs in gray providing visual history, disable to show only active untouched imbalances
Liquidity Zone Settings
Liquidity Lookback – Default: 50, Range: 20-200, sets pivot detection period for swing highs/lows, lower values (20-50) mark shorter-term liquidity, higher (100-200) identify major swings
Max Liquidity Age (bars) – Default: 100, Range: 20-500, removes liquidity lines older than specified bars, adjust based on timeframe
Liquidity Sensitivity – Default: 0.5, Range: 0.1-1.0, controls pivot detection sensitivity, lower values mark only major swings, higher values identify minor swings
Max Liquidity Zones to Display – Default: 3, Range: 1-10, limits total liquidity levels shown maintaining chart clarity
Market Structure Settings
Pivot Length – Default: 5, Range: 3-15, defines bars to left/right for pivot validation, lower values (3-5) create sensitive structure breaks, higher (10-15) filter for major shifts
Min Structure Move (%) – Default: 1.0, Range: 0.1-5.0, sets minimum percentage move required between pivots to confirm structure change
Multi-Timeframe Settings
Enable MTF Analysis – Default: On, activates higher timeframe trend analysis incorporation into Smart Money Score
Higher Timeframe Multiplier – Default: 4, Range: 2-10, multiplies current timeframe to determine analysis timeframe (4x on 15min = 1hour)
Visual Settings
Bullish Color – Default: Green (#089981), sets color for bullish Order Blocks, FVGs, and structure elements
Bearish Color – Default: Red (#f23645), defines color for bearish elements
Neutral Color – Default: Gray (#787b86), controls color of mitigated zones and neutral elements
Show Educational Labels – Default: On, displays text labels on zones identifying type (OB, FVG, BOS), disable once familiar with patterns
Order Block Transparency – Default: 92, Range: 80-98, controls Order Block box transparency
FVG Transparency – Default: 92, Range: 80-98, sets Fair Value Gap zone transparency independently from Order Blocks
Alert Settings
Alert on Order Block Formation – Default: On, triggers notification when new volume-validated Order Block detected
Alert on FVG Formation – Default: On, sends alert when Fair Value Gap appears enabling quick response to imbalances
Alert on Break of Structure – Default: On, notifies when BOS or CHoCH confirmed
Alert on High Smart Money Score – Default: On, alerts when Smart Money Score crosses above 70 threshold indicating high-probability setup
✅Best Use Cases
Order Block Retest Entries – After Break of Structure, wait for price retrace into fresh bullish Order Block with Smart Money Score >70, enter long on zone reaction targeting next liquidity level
Fair Value Gap Retracement Trading – When price creates FVG during strong move then retraces, enter as price approaches unfilled gap expecting institutional orders to continue trend
Liquidity Sweep Reversals – Monitor price approaching swing high/low liquidity zones against prevailing Smart Money Score trend, after stop hunt sweep watch for rejection into premium Order Block/FVG
Multi-Timeframe Confluence Setups – Identify alignment when current timeframe Order Block coincides with higher timeframe FVG plus MTF analysis showing matching trend bias
Break of Structure Continuations – After BOS confirms trend direction, trade pullbacks to nearest Order Block or FVG in direction of structure break using Smart Money Score >70 as entry filter
Change of Character Reversal Plays – When CHoCH detected indicating potential reversal, look for Smart Money Score pivot with opposing Order Block formation then enter on structure confirmation
⚠️Limitations
Lagging Pivot Calculations – Pivot-based features (Liquidity Zones, Market Structure) require bars to right of pivot for confirmation, meaning these elements identify levels retrospectively with delay equal to lookback period
Whipsaw in Ranging Markets – During choppy conditions, Order Blocks fail frequently and structure breaks produce false signals as Smart Money Score fluctuates without clear institutional bias, best used in trending markets
Volume Data Dependency – Order Block volume validation requires accurate volume data which may be incomplete on Forex pairs or limited in crypto exchange feeds
Subjectivity in Scoring Weights – Proprietary 25-20-20-20-15 weighting reflects general institutional behavior but may not optimize for specific instruments or market regimes, user cannot adjust factor weights
Visual Complexity on Lower Timeframes – Sub-hour timeframes generate excessive zones creating cluttered charts, requires aggressive display limit reduction and higher minimum thresholds
No Fundamental Integration – Indicator analyzes purely technical price action and volume without incorporating economic events, news catalysts, or fundamental shifts that override technical levels
💡What Makes This Unique
Unified SMC Ecosystem – Unlike indicators displaying Order Blocks OR FVGs OR Liquidity separately, SMFI combines all three institutional concepts plus market structure into single cohesive system
Proprietary Confidence Scoring – Rather than manual setup assessment, automated Smart Money Score quantifies probability by weighting five institutional dimensions into actionable 0-100 rating
Volume-Filtered Quality – Eliminates weak Order Blocks forming without institutional volume confirmation, ensuring displayed zones represent genuine accumulation/distribution
Adaptive Lifecycle Management – Automatically updates mitigation status and removes aged zones preventing trades on dead levels through continuous validity and age monitoring
Educational Integration – Built-in tooltips, labeled zones, and reference panel make indicator functional for both learning Smart Money Concepts and executing strategies
🔬How It Works
Order Block Detection – Scans for patterns where strong directional move follows counter-move creating last down-candle before rally (bullish OB) or last up-candle before sell-off (bearish OB), validates formations only when candle exhibits volume exceeding configurable multiple (default 1.5x) of 20-bar average volume
Fair Value Gap Identification – Compares current candle’s high/low against two-candles-prior low/high to detect price imbalances, calculates gap size as percentage of close and filters micro-gaps below minimum threshold (default 0.3%), monitors whether subsequent price fills 50% triggering mitigation status
Liquidity Zone Mapping – Employs pivot detection using configurable lookback (default 50 bars) to identify swing highs/lows where retail stops cluster, extends horizontal reference lines from pivot creation and applies age-based filtering to remove stale zones
Market Structure Analysis – Tracks pivot progression using structure-specific lookback (default 5 bars) to determine trend, confirms uptrend when new pivot high exceeds previous by minimum move percentage, detects Break of Structure when price breaks recent pivot level, flags Change of Character for potential reversals
Multi-Timeframe Confluence – When enabled, requests security data from higher timeframe (current TF × HTF multiplier, default 4x), compares HTF close against HTF 20-period MA to determine bias, contributes ±50 points to score ensuring alignment with institutional positioning on superior timeframe
Smart Money Score Calculation – Evaluates Order Block component via ATR-normalized distance producing max 100-point contribution weighted at 25%, assesses FVG factor through age penalty and distance at 20% weight, calculates Liquidity proximity at 20%, incorporates structure bias (±50-100 points) at 20%, adds MTF component at 15%, applies 3-period smoothing to reduce volatility
Visual Rendering and Lifecycle – Draws Order Block boxes, Fair Value Gap rectangles with color coding (green/red active, gray mitigated), extends liquidity dashed lines with fade-by-age opacity, plots BOS labels, displays Smart Money Score dashboard, continuously updates checking mitigation conditions and removing elements exceeding age/display limits
💡Note:
The Smart Money Flow Index combines multiple Smart Money Concepts into unified institutional order flow analysis. For optimal results, use the Smart Money Score as confluence filter rather than standalone entry signal – scores above 70 indicate high-probability setups but should be combined with risk management, higher timeframe bias, and market regime understanding.

SMC pro trend
The PSK FX Structure Indicator (also known as SMC pro trend) is a complete Smart Money Concepts (SMC) toolkit designed for professional structure traders.
It detects and visualizes key price structure elements such as BoS (Break of Structure), CHoCH (Change of Character), HH/HL/LH/LL, IDM zones, SCOB, sweeps, inside bars, and EMA confluence — all with precise non-repainting logic.
This indicator helps traders read price action like an institution — identifying liquidity shifts, order flow direction, and possible reversal or continuation zones.
⸻
⚙️ Core Features
🧭 Structure Detection
• Automatic detection of major structure points:
• HH – Higher High
• HL – Higher Low
• LH – Lower High
• LL – Lower Low
• Confirms BoS (Break of Structure) and CHoCH (Change of Character) events in both bullish and bearish markets.
• Marks each structure change with labels and connecting lines for clarity.
🔁 BoS / CHoCH Logic
• Solid line = BoS
• Dashed line = CHoCH
• Colored by direction:
• 🟩 Bullish = Green
• 🟥 Bearish = Red
• Option to show live BoS/CHoCH lines extending forward for real-time updates.
🧱 IDM (Internal Displacement Model) Zones
• Detects previous and live IDM zones (premium/discount zones).
• Highlights IDM candles that cause structural displacement.
• Labels each detected IDM level automatically.
⚡ Sweeps (Liquidity Grab Detection)
• Detects when price sweeps previous highs/lows.
• Marks these zones with dotted lines and optional “X” markers.
🧩 SCOB Pattern (Smart Candle Order Block)
• Detects and colors special SMC candle structures:
• Bullish SCOB → Aqua
• Bearish SCOB → Fuchsia
• Option to color all bars by trend direction or only highlight SCOB bars.
🧭 Internal Structure & Pivots
• Marks minor highs/lows (internal structure) for better IDM leg visualization.
• Helps identify early momentum shifts before major structure breaks.
🎯 1.618 Target Projection
• Projects 1.618 Fibonacci targets dynamically after BoS or CHoCH confirmation.
• Displays target price level with text label:
• Bullish → Green Target Line
• Bearish → Red Target Line
🧱 Inside Bar Zones
• Highlights inside bar formations (compression zones).
• Draws colored boxes between high/low of inside bar clusters.
• Marks the first and consecutive inside bars with custom bar colors.
📊 EMA Filter
• Includes a toggleable Exponential Moving Average (EMA) for confluence with trend direction.
• Customizable EMA length (default: 50).
🎨 Monochrome Mode
• Toggle between normal color mode and a clean monochrome theme for minimalistic charting setups.
⸻
🧠 How to Use
1. Identify Market Context:
Wait for a confirmed CHoCH to spot potential reversals or structure shifts.
2. Follow Order Flow:
Confirm trend direction via BoS lines and IDM zones.
3. Entry Planning:
Combine sweep detection, inside bar zones, and IDM levels for sniper entries.
4. Take Profit Zones:
Use the 1.618 target projection line to set high-probability TP levels.
5. Trend Filtering:
Use EMA direction to confirm whether to follow continuation or counter-trend setups.
⸻
🧩 Inputs & Settings
Category
Key Settings
Structure
Equal H/L toggle, HH/LL labeling, internal structure
BoS/CHoCH
Enable/disable labels, custom label size, bull/bear colors
IDM
Show previous/live IDM, label size, color options
Sweeps
Show sweep lines, X-markers, sweep line color
Bar Coloring / SCOB
Toggle bar coloring and SCOB pattern
Inside Bars
Highlight and box compression zones
1.618 Targets
Enable Fibonacci target projection
EMA
Toggle EMA and adjust length
Monochrome Mode
Apply single-color chart theme
⚠️ Notes
• This indicator is built for non-repainting structure confirmation.
• Use it on higher timeframes for swing structure or lower timeframes for IDM entry precision.
• Works best with clean price action charts (no cluttered oscillators or extra visuals).
⸻
💡 Recommended Use Cases
✅ SMC traders
✅ ICT/Order Block strategy users
✅ Liquidity and market structure traders
✅ Scalpers and swing traders using BoS/CHoCH logic
⸻
✍️ Author
Developed by PURNA SAMPATH KALUARACHCHI (PSK FX)
Smart Money Concepts researcher and price structure developer.
⸻
