CCI Strategy v2This was a strategy I found based on MT4. It takes CCI readings, then transforms them into a weighted moving average illustration. This is represented as:
Red Line - A six period moving average taken from CCI (NOT PRICE)
Green Line - A sixty-six period moving average taken from CCI (NOT PRICE)
Blue Line - CCI plotted
I have also added some levels and bollinger bands to highlight changes in activity.
The strategy is:
BUY - When the red line crosses upwards over green line.
SELL - When the red line crosses downwards over green line.
Extra confirmation is available by watching the blue line, it should be above red to buy, below red to sell. If the blue line drops in the opposite direction, this may be an opportunity to buy on a pull back.
If you wish for any modications to be applied, please do not hesitate to contact me.
Cerca negli script per "CCI"

CCI RiderThis is my thank you to the TradingView community, for the people who are sharing their scripts, which allowed me to learn Pine Script.
So here is my first creation, feel free to experiment, modify and use it as you wish.
It is a CCI(default value is 100, can be changed), combined with an EMA of that CCI(default 21,changeable) that then colors the background according to the strength of the signal(if selected to do so).
To generate strong signals, it also uses Bollinger Bands to prevent whipsaws in high volatility situations.
The best signals are generated when the CCI crosses the limits set by the user (default is 100/-100), and is above/belov its EMA.
Exit signals are indicated, when the CCI crosses its EMA.
Unfortunately in strong trends, this exit signal is sometimes premature, using a 3x resolution of the indicator will improve this, maybe I will implement this in a later version.
I use it mostly in 15min charts and higher, I found in shorter timeframes still a lot of whipsaws, maybe experimenting with different lengths and levels will improve this.
As the Indicator allows the user to experiment with different lenghts and levels, and the colors will change according the setting, I find it a nice tool to search for the best mixture for different securities and timeframes.
See below an example of a nice signal.
I do suggest to use it in combination with other indicators.

CCI AnalysesThis script analyses the CCI indicator values, showing when a fall in price or a rise in price may happen, or when the CCI is confirming the trend.
The user can personalize:
The period to be used and the range of the CCI bands ( by default)
The slow SMA period to be used and the price percentage variation to react for bullish/bearish
Consecutive number of bullish/bearish in order to consider the CCI as a trend confirmation rather than a price reversal

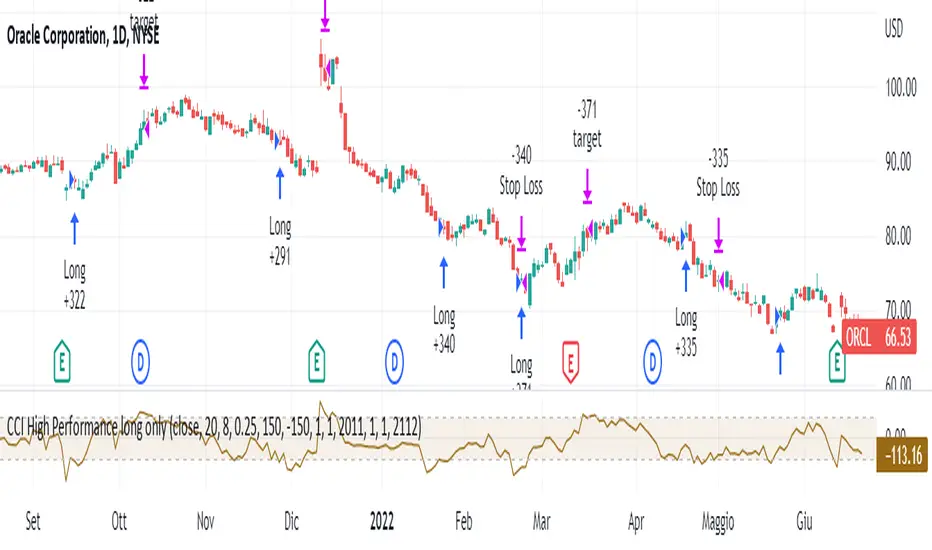
CCI High Performance long onlyThis strategy is based on the classic Commodity Channel Index and only works long.
The system enters the market when this indicator is very low ( CCI <-150 or user-defined threshold) and as soon as it regains strength (i.e. CCI> CCI of the previous candle) with a filter on the "strength" of the prices themselves (i.e. the closing of the candle that provides the signal must be higher than a certain difference - fixed at 0.25% - at the opening of the candle itself).
You exit the market when you either incur a stop loss or when the prices are above the upper band of the CCI.
This system is used to have a high number of profitable operations (well over 50%) with little effort in terms of number of bars, rather than wanting to capture the actual duration of a trend. It is therefore recommended for those who "suffer to see the potential losses".
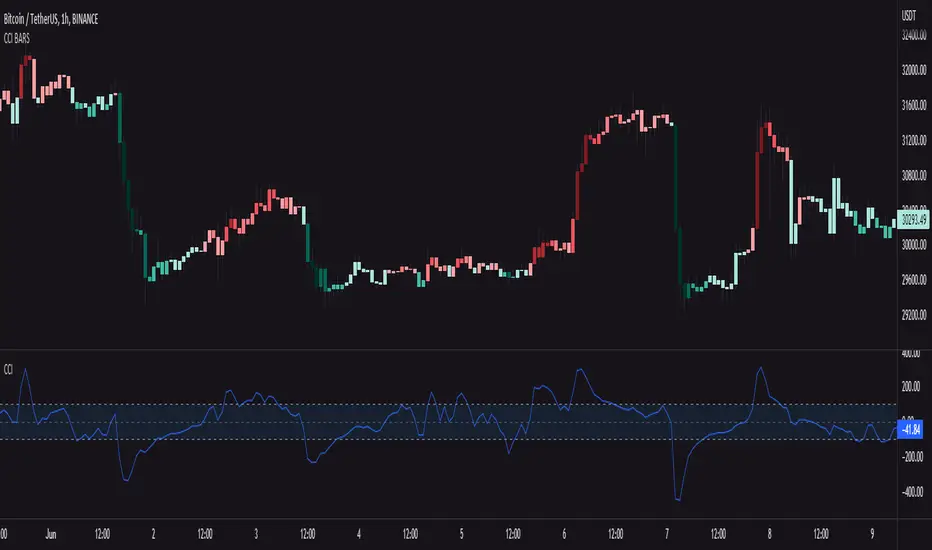
CCI BARSCandlesticks with color of the current CCI value
This script works following: It measures CCI value from -250 to 250 => the lower the value, the darker green candlesticks will be.. it works the same in the opposite direction, but with red color
You can also edit colors of candlesticks and length and source of the CCI indicator
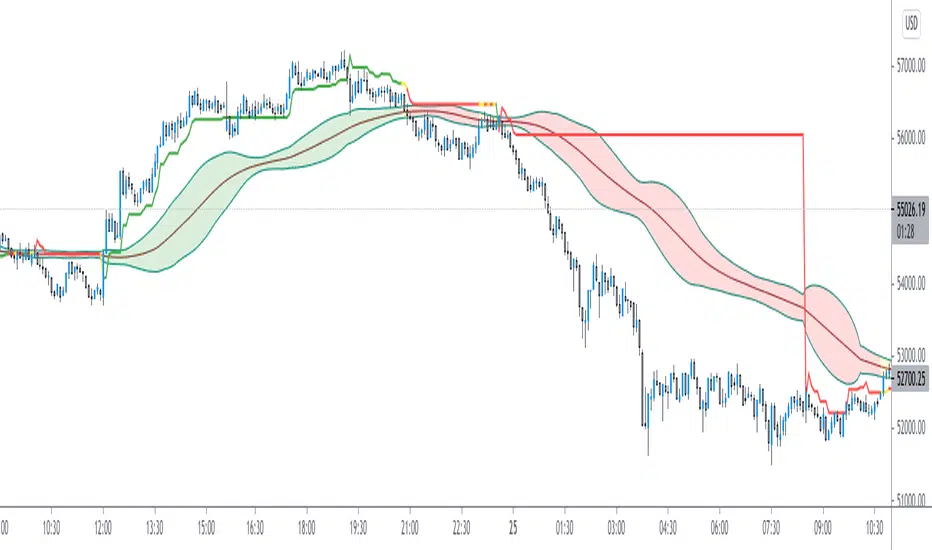
CCI Super BandsCCi Super Bands ,
Is an Indicator to plot Commodity Channel Index Projections over the Price Chart
It's offers interesting price Analysis
There are two major parts to the indicator!
1. The Optimal CCI Line
2. A CCI Standard Deviation Bands
Color Codes Meaning:
Red : Strength in Bearish Intent
Green : Strength in Bullish Intent
Yellow : Consolidation estimations
Try to play with this indicator
and Enjoy
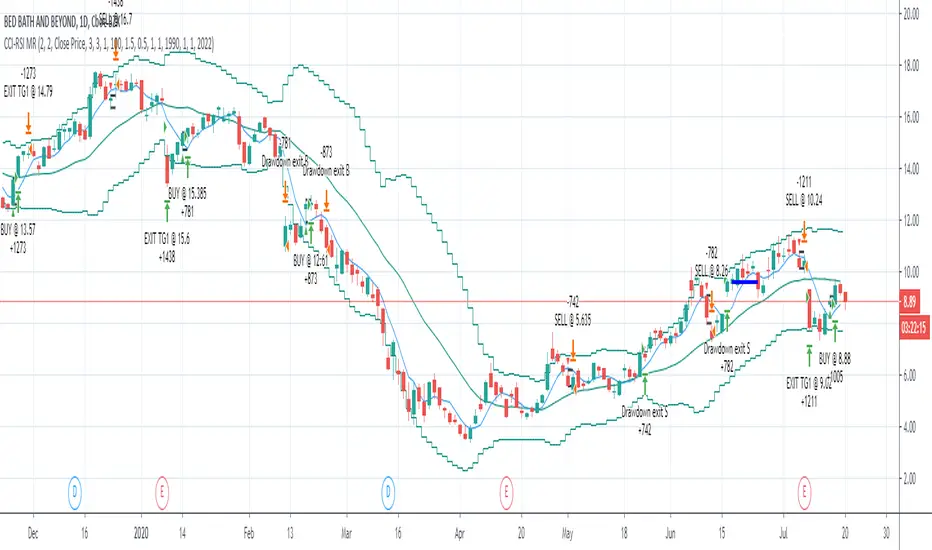
CCI-RSI MR Indicators:
Bollinger Bands (20 period, 2σ)
RSI (14 period) and Simple moving average of RSI (5 period)
CCI (20 period)
SMA (5 period)
Entry Conditions:
Buy when:
Swing low (5) should be lower than the highest of lower BB (3 periods)
Both RSI crossover RSI_5 and CCI crossover -100 should have happened within last 3 candles (including the current candle)
Once all the above conditions are met, the close should be higher than SMA (5) within the next 3 candles
After condition 3 is satisfied, we enter the trade at next candle’s open
Stop loss will be at 1 tick lower than previous swing low
Sell when:
Swing high (5) should be higher than the lowest of upper BB (3 periods)
Both RSI crossunder RSI_5 and CCI crossunder 100 should have happened within last 3 candles (including the current candle)
Once all the above conditions are met, the close should be lower than SMA (5) within the next 3 candles
After condition 3 is satisfied, we enter the trade at next candle’s open
Stop loss will be at 1 tick higher than previous swing high
Exit Conditions:
Since it’s mean reversion strategy we’ll be having only 2 target exits with a trailing stop loss after target price 1 is achieved.
Target exit price 1 & 2 are decided based on the risk ‘R’ for each trade
Depending on the instrument and time frame a trailing stop loss of 0.5R or 1R has opted.
A stop limit is placed @Entry_price +- 2*ATR(20) to offset the risk of losing significantly more than 1xR in a trade
CCI with Volume Weighted EMA Here is an attempt to improve on the CCI using a volume weighted ema which is then plugged into the CCI formula.
Use:
The CCI with VW EMA is an oscillator that gives readings between -100 and +100. The usual use is to 'go long' with values over +100 and short on values less than -100.
Another use of this oscillator is a countertrend indicator where one sells at crosses under +100 and buys on crosses over -100.

CCI StrategyThis CCI strategy will allow you to enter a long or short off a CCI zero line cross or control entries and exits from custom upper and lower band lengths. You can set a custom upper band which it will buy when it crosses up and then a custom upper band exit which it will sell when it crosses down. For a short you can set a custom lower band which it will short when it crosses down and the custom lower band exit which it will exit the short when it crosses up. Be sure to enter slippage and commission into the properties to give you realistic results.
I've also built in backtesting date ranges and the ability to trade only within certain times of day and have it close all trades at the end of that time frame. This is especially useful for day trading stocks. If you check off "Enter First Trade ASAP" then when using the time frame option it will enter the current trade. If however you uncheck that box and instead check off "Wait To Enter First Trade" it will wait for the trend to change and then enter.
You can also specify a % based take profit and stop loss. Also keep in mind that if you have "Enter First Trade ASAP" checked off and use the stop loss and/or take profit then it will re-enter the current trend again.
Finally there's custom alert fields so you can send custom alert messages for strategy entry and exit for use with automated trading services. Simply enter your messages in the fields within the strategy properties and then put {{strategy.order.alert_message}} in your alert message body and it will dynamically pull in the appropriate message.

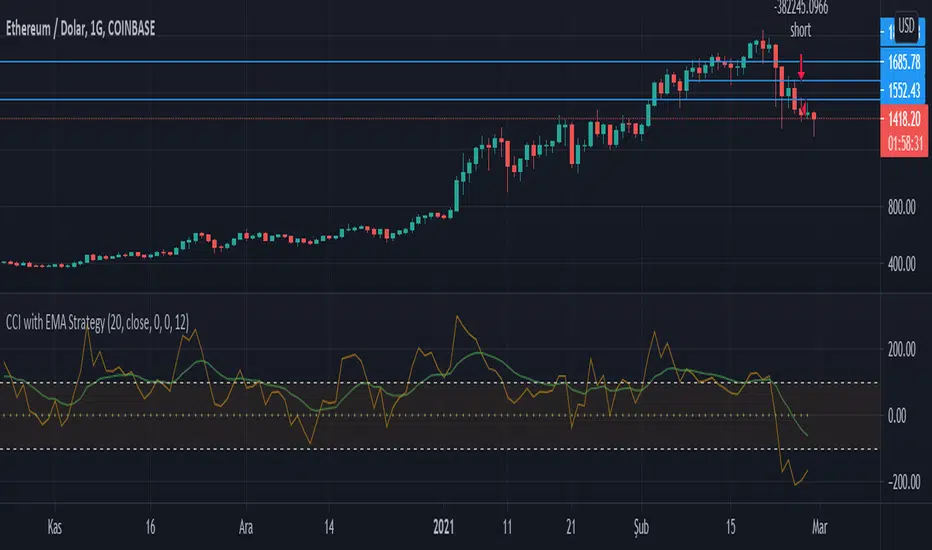
CCI with EMA StrategyI designed it as buy and sell when the cci 0 point cut, but you can optimize it by changing the buy sell points
I used moving average to smooth out cci's movements
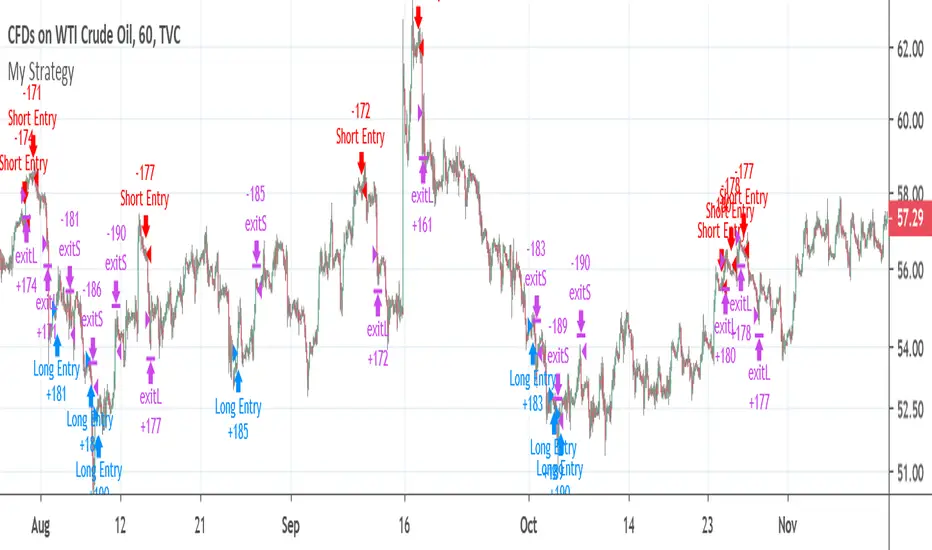
CCI strategy on OIL1HThis indicator is based on Commodity Channel Index.
It buys when CCI on period 200 is under -130 and it´s rising last 12 bars. It closes the position by hitting Take Profit, Stop Loss or opening short position.
It sells when CCI on period 200 is over 130 and it´s falling last 12 bars. It closes the position by hitting Take Profit, Stop Loss or opening short position.
This strategy seems to working just on USOIL on 1 hour chart. This can predict that it´s just luck and not proper strategy or indicator I would use for trading.
This script is just for educational purposes and that´s why the script is open. I will be happy if you will leave comment and try to come up with some ideas how to improve this strategy, so it can be used also on other commodities/forex pairs.
CCI Cycle (Modified Schaff Trend Cycle)This is a modified Schaff Trend Cycle (STC), which is designed to provide quicker entries and exits.
I've been a huge fan of the STC for a long time, but being based on the MACD means its signals often lag by a bar or two (especially in fast moving markets). All I've done here is take the base STC script (all credit to user @LazyBear), and change the source to a modified CCI.
The CCI Cycle provides more timely entries and exits, often by 1-2 bars. The flip side of the increased responsiveness is a prevalence for more false signals (a perfect example is the 17th August on the above chart). It's the nature of the beast! Still, I've been using this for a few months now and it's (in my opinion) an upgrade on the standard STC.
As always, you will need to pair this with another indicator or method of technical analysis to provide a trade bias, as the CCI Cycle (and STC) aren't designed to trade every signal. In my experience, either divergence identification, or using one or more moving averages works particularly well.
The indicator is also MTF capable, so you can get some interesting results from that.
Any queries let me know.
DD

CCI Level Zero Strategy (by Marcoweb) v1.0Hi guys,
My strategy is ready :)
Finally the zero level of the CCI gives the start and stop to my positions. As you could notice, setting up the CCI length to 340 area on 1 minute chart will let the profit factor go up to 20% from an already wonderful 16%. This is a great result cause will let profitable trades run while stopping the wrong ones with a very limited loss. What makes our profit are not several small little positions that are clearly unrepitable in real trade but few and very profitable positions in which jumping in will be easier due to their length (71 bars average).
Please share with me your impressions and suggestions.
Have a nice trade :)

CCI MTF Ob+OsHello Traders,
This is a simple Commodity Channel Index (CCI) indicator with multi-timeframe (MTF) overbought and oversold level.
It can detect overbought and oversold level up to 5 timeframes, which help traders spot potential reversal point more easily.
There are options to select 1-5 timeframes to detect overbought and oversold.
Green Background is "Oversold" , looking for "Long".
Red Background is "Overbought" , looking for "Short".
Have fun :)

CCI Level ZoneThis strategy uses CCI 1000 as zones Buy sell if greater than level 100. will be seen as an uptrend If it's lower, it's a downtrend.
So we will use RSI. To trade in its zones, using the RSI crosses the level line, and when the RSI crosses the level line, it waits to buy with Stochastic.

CCI & EMA strategy by TradeswithashishThis strategy is extremely useful for positional traders or traders using timeframe 15-minute of higher. It uses following combo of values:
VWAP, CCI, Volume and Moving average (simple and exponential)
Caution:
Avoid taking trade if candle size is greater than twice the average candle size. for that wait for the retracement to near trailing stoploss

CCI/MFI/VZO/RSI - HEATMAPHeatmap I made/reverse engineered.
Currently tracks the 4 following oscillators:
- CCI (Channel Commodity Index)
- MFI (Money Flow Index)
- VZO (Volume Zone Oscillator)
- RSI (Relative Strength Index)
Any feedback or suggestions highly appreciated.
/* Inspiration taken from @ByzantineGeneral (TradingView profile: /u/ByzantineGeneral, indicator: /script/keAGdnWO-Byzantium-Oscillator-Heatmap) */

CCI Breakout TraderWorks well on Bitcoin or most altcoins on a 15min chart or higher.
What is this exactly?
This is an indicator that uses horizontal RSI + EMA lines with a CCI line on top of it to provide optimal entry and exit positions for trading. There is also a breakout indicator based on the width of Bollinger Bands.
How to use:
If the blue stream passes upwards on the red heading to the white - it's heading towards a good BUY signal. To be safe you wait until it passes above the white line, then BUY LONG. Another signal to buy long is when the blue stream passes above the white and green lines.
Selling is essentially the opposite, if the blue stream is passing down from the green or white lines, then it's time to sell and exit your trade.
If you need help knowing when to enter and exit a trade the indicator will draw a grey candle on your chart to signal it's time to exit a long trade and it will draw a purple candle when it's time to enter a long.
--
Breakout alert:
If you see a green vertical bar it's a warning that there is a potential breakout in price coming for whichever coin you are looking at. The price breakout could go either direction, so make sure you watch the blue stream.
--
Important tips:
The direction of the green/white/red lines are important - if they are heading down that means it might not be the best time to enter your trade, even if the blue stream crosses up on the red and/or white lines.
The colored horizontal lines are there to let you know if the blue stream is near the bottom of those lines (anywhere from hline 15 to 50) and heading upwards, you will more likely have a longer positive trade. If the blue stream is above 60 hline and it looks like a good trade (passing up on the red and white lines), expect to have a shorter trade.
I use this for swing trading various crypto currencies, once you learn how to read it, you can catch amazing uptrends really early and you can exit trades before some big drops happen.

CCI Indicator [SystemAlpha]This is a CCI indicator enhanced with:
- Show Alert
- Fill on oversold and overbought levels
- Show Regular and Hidden divergence
- Show Divergence Labels


CCI Low/High DivergencesThis CCI Divergences indicator uses the candle low values to find bullish divergences and candle high values to find bearish divergences.


