TraderDemircan Fibonacci + XABCD Formation v1.0This indicator automatically identifies the most recent significant swing low (Point X) and the subsequent swing high (Point A) to plot a comprehensive set of Fibonacci extension levels.
Beyond a standard Fibonacci tool, this script also projects a potential harmonic XABCD pattern. It identifies a retracement level (Point B) and projects a "C" target based on the XA=BC price projection. This provides traders with a complete visual framework of key support/resistance levels and potential price targets based on the last significant impulse move.
How It Works
Swing Detection (X & A Points): The script scans the previous Lookback Bars (user-defined) to find the lowest low, which it labels as Point X. It then finds the highest high that occurred after Point X, labeling it as Point A.
Fibonacci Levels: The price range between X and A (the "XA leg") is used as the basis (0.0 to 1.0) to draw 18 different Fibonacci levels, including key extensions (1.272, 1.618, 2.618, etc.) and retracements.
XABCD Projection (B & C Points):
Point B: The script dynamically identifies Point B at either the 0.382 or 0.5 retracement level of the XA leg, depending on the current price action. This shows the level that is currently acting as support.
Point C (Target): A target (Point C) is projected by adding the price range of the XA leg to the B point. This creates a classic XA=BC (or AB=CD, where the first leg is XA) price projection, offering a potential target for the next upward move.
Key Features
Automatic Swing Detection: Automatically finds and plots the X and A points, adapting to the latest price action.
Comprehensive Fibonacci Suite: Includes 18 toggleable Fibonacci levels (from 0.0 to 4.618) to cover all common retracement and extension targets.
XABCD Pattern & Target: Visually plots the X-A, A-B, and the projected B-C legs, clearly highlighting the C target.
Dynamic "B" Point: The B point label (0.382 or 0.5) updates to reflect which retracement level is currently in play.
On-Screen Info Table: A clean table in the top-right corner displays the exact price values for X, A, B, and the C Target for quick reference.
Full Customization: Users can control the visibility, color, width, and style of every Fibonacci level and pattern line.
Label Options: Toggle price labels (on the right) and percentage/level labels (on the left) for a clean or detailed chart.
Cerca negli script per "Table"

Pivots 15m en 1mThis script is designed for scalpers and day traders who base their entries on low timeframes (like 1m) but reference liquidity levels from higher timeframes (HTF), in this case, 15m.Key Features:HTF Pivots on LTF: It calculates swing highs and swing lows (pivots) from the 15m chart and projects them as horizontal rays onto your 1m chart.Real-Time Mitigation: The rays (representing pending liquidity) are automatically deleted on the 1m candle as soon as the price mitigates (touches or breaks) that level. This allows you to clearly see which levels have already been tested and which have not.Configurable Pivot Strength: Includes an input to define the "Pivot Strength," allowing you to adjust how many candles on each side are needed to confirm a swing point (e.g., a value of 1 creates 3-bar pivots, a value of 2 creates 5-bar pivots, etc.).Info Table: Displays a real-time table with vital information from the current 1m candle:Time remaining until the candle closes.Total range of the candle in ticks.How to Use:This indicator must be loaded exclusively on a 1-minute (1m) chart.Adjust the "Pivot Strength" in the settings according to your strategy (a value of 1 or 2 is recommended).

Trend Duration Forecast [ChartPrime]⯁ OVERVIEW
The Trend Duration Forecast indicator is designed to estimate the probable lifespan of a bullish or bearish trend. Using a Hull Moving Average (HMA) to detect directional shifts, it tracks the duration of each historical trend and calculates an average to forecast how long the current trend is statistically likely to continue. This allows traders to visualize both real-time trend strength and potential exhaustion zones with exceptional clarity.
⯁ KEY FEATURES
Dynamic Trend Detection: Utilizes the Hull Moving Average to identify when price transitions into a new uptrend or downtrend.
Trend Duration Counting: Measures the number of bars in each completed bullish and bearish phase to understand trend persistence.
Forecast Projection: Automatically projects an estimated trend continuation line based on the average length of recent trends.
Real-Time Updates: Continuously updates the “Real Length” label as the trend develops.
Historical Data Table: Displays previous trend durations for both bullish and bearish cycles, along with their averages.
Adaptive Sampling: Uses a customizable sample size to smooth out volatility in the forecast and provide statistically meaningful projections.
Color-Based Clarity: Highlights uptrends in green and downtrends in orange for instant visual interpretation.
⯁ USAGE
Use the Trend Detection Sensitivity setting to control how fast or slow the indicator reacts to trend changes — lower values increase responsiveness, while higher values smooth out noise.
Compare the Real Length of the ongoing trend with the Probable Length forecast to estimate whether the move is nearing exhaustion.
Observe the historical duration table to understand the average lifespan of trends in the current market structure.
Use the color-coded HMA line and projection arrows to identify when momentum strength is fading and prepare for possible reversals.
Ideal for swing or trend-following strategies where trend longevity is crucial to managing entries and exits effectively.
⯁ CONCLUSION
The Trend Duration Forecast gives traders a quantitative edge by combining real-time trend tracking with statistical forecasting. It helps identify not only when a new trend begins, but also how long it’s likely to persist based on past market behavior. This indicator enhances timing precision for both entries and exits, supporting smarter trend-following decisions with clear, data-driven insights.

Ichimoku MultiTF WillyArt v1.0.0What this indicator does
Ichimoku WillyArt turns the Ichimoku lines into angle-based momentum across multiple timeframes (W, D, 4H, 1H, 30m, 5m).
For each TF it computes the slope (angle in degrees) of:
Tenkan-sen
Kijun-sen
Senkou Span A
Senkou Span B
Angles are normalized so they’re comparable across assets and scales. You get a table with the angle per line and a quick emoji direction (↑, →, ↓), optional plots of the chosen line, and ready-to-use alerts.
Why angle?
Slope-as-degrees is an intuitive proxy for momentum/impulse:
Positive angle → line rising (bullish impulse).
Negative angle → line falling (bearish impulse).
Near zero → flat/indecisive.
Two normalization modes
ATR (default): slope / ATR. Robust across instruments; less sensitive to price level.
%Price: slope / price. More sensitive; can highlight subtle turns on low-volatility symbols.
Inputs you’ll actually care about
Timeframes: W, D, 4H, 1H, 30m, 5m (all fetched MTF, independent of chart TF).
Ichimoku lengths: Tenkan (9), Kijun (26), Span B (52) — standard defaults.
Bars for slope (ΔN): How many bars back the slope is measured. Higher = smoother, slower.
Threshold (°) for “strong”: Angle magnitude that qualifies as strong ↑/↓.
What you’ll see
Matrix/Table (top-right): For each TF, the angle (°) of Tenkan, Kijun, Span A, Span B + an emoji:
↑ above threshold, ↓ below −threshold, → in between.
Optional plots: Toggle “Plot angles” to visualize the chosen series’ angle across TFs.
Alerts included (ready to pick in “Create Alert”)
Sustained state: e.g., “Kijun 4H: strong ↑ angle” triggers while angle > threshold.
Threshold cross (one-shot): e.g., “Kijun 1H: upward threshold cross” fires on crossing.
Consensus (multi-TF): “Kijun consensus ↑ (D/4H/1H/30m/5m)” when all selected TFs align up (and the symmetric down case).
Messages are constant strings (TradingView requirement), so they compile cleanly. If you want dynamic text (current angle, threshold value, etc.), enable your own alert() calls—this script structure supports adding them.
How to use it (workflow)
Add to chart. No need to switch chart TF; the script pulls W/D/4H/1H/30m/5m internally.
Pick normalization. Start with ATR. Switch to %Price if you want more sensitivity.
Set ΔN & threshold.
Intraday momentum: try ΔN = 3–5 and threshold ≈ 4–8°.
Swing/position: ΔN = 5–9 and threshold ≈ 3–6° (with ATR).
Scan the table. Look for alignment (multiple TFs with ↑ or ↓ on Kijun/Spans).
Kijun + Span A up together → trending push.
Span B up/down → cloud baseline tilting (trend quality).
Turn on alerts that match your style: reactive cross for entries, sustained for trend follow, consensus to filter noise.
Reading tips
Kijun angle: great “trend backbone.” Strong ↑ on several TFs = higher-probability pullback buys.
Span A vs. Span B:
Span A reacts faster (momentum).
Span B is slower (structure).
When both tilt the same way, the cloud is genuinely rotating.
Mixed signals? Use higher TFs (W/D/4H) as bias, lower TFs (1H/30m/5m) for timing.
Good to know (limits & best practices)
Angles measure rate of change, not overbought/oversold. Combine with price structure and risk rules.
Extremely low volatility or illiquid symbols can produce tiny angles—%Price mode may help.
ΔN and thresholds are contextual: adapt per market (crypto vs FX vs equities).
Want me to bundle a “pro template” of alert presets (intraday / swing) and a heatmap color scale for the table? Happy to ship v2. 🚀

GEX Delta Hedging Lines - v.4.1GEX Delta Hedging Indicator - Institutional Levels
Introduction
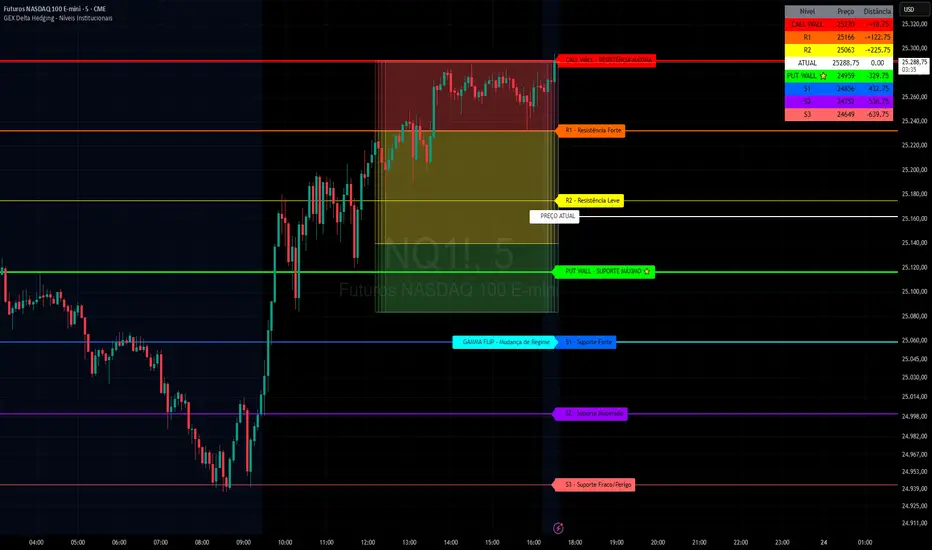
This Pine Script indicator is designed to visualize Gamma Exposure (GEX) levels, Delta Hedging zones, and institutional support/resistance points on your TradingView charts. It helps traders identify key price levels where market makers and institutions might hedge their options positions, potentially leading to price reversals or continuations. The indicator overlays lines for resistances (Call Wall, R1, R2), supports (Put Wall, S1, S2, S3), a Gamma Flip zone, and customizable trading zones (Buy, Neutral, Sell). It also includes alerts for level breaches and a summary table for quick reference.
Key Features
Resistance Levels: Call Wall (maximum resistance), R1 (strong), R2 (light) – all configurable with colors, styles, and widths.
Support Levels: Put Wall (maximum support), S1 (strong), S2 (moderate), S3 (weak/danger) – fully customizable.
Gamma Flip Zone: Indicates potential regime changes in market behavior.
Trading Zones: Visual boxes for Buy (green), Neutral (yellow), and Sell (red) areas, with adjustable boundaries and colors.
Current Price Line: Dotted line for the reference price, with labels.
Alerts: Trigger notifications when levels are tested or broken.
Summary Table: Displays levels, prices, and distances from the current close, positioned customizable.
Style Options: Adjust line widths, styles (solid/dashed/dotted), label sizes, and more for a personalized view.
Luxy Adaptive MA Cloud - Trend Strength & Signal Tracker V2Luxy Adaptive MA Cloud - Professional Trend Strength & Signal Tracker
Next-generation moving average cloud indicator combining ultra-smooth gradient visualization with intelligent momentum detection. Built for traders who demand clarity, precision, and actionable insights.
═══════════════════════════════════════════════
WHAT MAKES THIS INDICATOR SPECIAL?
═══════════════════════════════════════════════
Unlike traditional MA indicators that show static lines, Luxy Adaptive MA Cloud creates a living, breathing visualization of market momentum. Here's what sets it apart:
Exponential Gradient Technology
This isn't just a simple fill between two lines. It's a professionally engineered gradient system with 26 precision layers using exponential density distribution. The result? An organic, cloud-like appearance where the center is dramatically darker (15% transparency - where crossovers and price action occur), while edges fade gracefully (75% transparency). Think of it as a visual "heat map" of trend strength.
Dynamic Momentum Intelligence
Most MA clouds only show structure (which MA is on top). This indicator shows momentum strength in real-time through four intelligent states:
- 🟢 Bright Green = Explosive bullish momentum (both MAs rising strongly)
- 🔵 Blue = Weakening bullish (structure intact, but momentum fading)
- 🟠 Orange = Caution zone (bearish structure forming, weak momentum)
- 🔴 Deep Red = Strong bearish momentum (both MAs falling)
The cloud literally tells you when trends are accelerating or losing steam.
Conditional Performance Architecture
Every calculation is optimized for speed. Disable a feature? It stops calculating entirely—not just hidden, but not computed . The 26-layer gradient only renders when enabled. Toggle signals off? Those crossover checks don't run. This makes it one of the most efficient cloud indicators available, even with its advanced visual system.
Zero Repaint Guarantee
All signals and momentum states are based on confirmed bar data only . What you see in historical data is exactly what you would have seen trading live. No lookahead bias. No repainting tricks. No signals that "magically" appear perfect in hindsight. If a signal shows in history, it would have triggered in real-time at that exact moment.
Educational by Design
Every single input includes comprehensive tooltips with:
- Clear explanations of what each parameter does
- Practical examples of when to use different settings
- Recommended configurations for scalping, day trading, and swing trading
- Real-world trading impact ("This affects entry timing" vs "This is visual only")
You're not just getting an indicator—you're learning how to use it effectively .
═══════════════════════════════════════════════
THE GRADIENT CLOUD - TECHNICAL DETAILS
═══════════════════════════════════════════════
Architecture:
26 precision layers for silk-smooth transitions
Exponential density curve - layers packed tightly near center (where crossovers happen), spread wider at edges
75%-15% transparency range - center is highly opaque (15%), edges fade gracefully (75%)
V-Gradient design - emphasizes the action zone between Fast and Medium MAs
The Four Momentum States:
🟢 GREEN - Strong Bullish
Fast MA above Medium MA
Both MAs rising with momentum > 0.02%
Action: Enter/hold LONG positions, strong uptrend confirmed
🔵 BLUE - Weak Bullish
Fast MA above Medium MA
Weak or flat momentum
Action: Caution - bullish structure but losing strength, consider trailing stops
🟠 ORANGE - Weak Bearish
Medium MA above Fast MA
Weak or flat momentum
Action: Warning - bearish structure developing, consider exits
🔴 RED - Strong Bearish
Medium MA above Fast MA
Both MAs falling with momentum < -0.02%
Action: Enter/hold SHORT positions, strong downtrend confirmed
Smooth Transitions: The momentum score is smoothed using an 8-bar EMA to eliminate noise and prevent whipsaws. You see the true trend , not every minor fluctuation.
═══════════════════════════════════════════════
FLEXIBLE MOVING AVERAGE SYSTEM
═══════════════════════════════════════════════
Three Customizable MAs:
Fast MA (default: EMA 10) - Reacts quickly to price changes, defines short-term momentum
Medium MA (default: EMA 20) - Balances responsiveness with stability, core trend reference
Slow MA (default: SMA 200, optional) - Long-term trend filter, major support/resistance
Six MA Types Available:
EMA - Exponential; faster response, ideal for momentum and day trading
SMA - Simple; smooth and stable, best for swing trading and trend following
WMA - Weighted; middle ground between EMA and SMA
VWMA - Volume-weighted; reflects market participation, useful for liquid markets
RMA - Wilder's smoothing; used in RSI/ADX, excellent for trend filters
HMA - Hull; extremely responsive with minimal lag, aggressive option
Recommended Settings by Trading Style:
Scalping (1m-5m):
Fast: EMA(5-8)
Medium: EMA(10-15)
Slow: Not needed or EMA(50)
Day Trading (5m-1h):
Fast: EMA(10-12)
Medium: EMA(20-21)
Slow: SMA(200) for bias
Swing Trading (4h-1D):
Fast: EMA(10-20)
Medium: EMA(34-50)
Slow: SMA(200)
Pro Tip: Start with Fast < Medium < Slow lengths. The gradient works best when there's clear separation between Fast and Medium MAs.
═══════════════════════════════════════════════
CROSSOVER SIGNALS - CLEAN & RELIABLE
═══════════════════════════════════════════════
Golden Cross ⬆ LONG Signal
Fast MA crosses above Medium MA
Classic bullish reversal or trend continuation signal
Most reliable when accompanied by GREEN cloud (strong momentum)
Death Cross ⬇ SHORT Signal
Fast MA crosses below Medium MA
Classic bearish reversal or trend continuation signal
Most reliable when accompanied by RED cloud (strong momentum)
Signal Intelligence:
Anti-spam filter - Minimum 5 bars between signals prevents noise
Clean labels - Placed precisely at crossover points
Alert-ready - Built-in ALERTS for automated trading systems
No repainting - Signals based on confirmed bars only
Signal Quality Assessment:
High-Quality Entry:
Golden Cross + GREEN cloud + Price above both MAs
= Strong bullish setup ✓
Low-Quality Entry (skip or wait):
Golden Cross + ORANGE cloud + Choppy price action
= Weak bullish setup, likely whipsaw ✗
═══════════════════════════════════════════════
REAL-TIME INFO PANEL
═══════════════════════════════════════════════
An at-a-glance dashboard showing:
Trend Strength Indicator:
Visual display of current momentum state
Color-coded header matching cloud color
Instant recognition of market bias
MA Distance Table:
Shows percentage distance of price from each enabled MA:
Green rows : Price ABOVE MA (bullish)
Red rows : Price BELOW MA (bearish)
Gray rows : Price AT MA (rare, decision point)
Distance Interpretation:
+2% to +5%: Healthy uptrend
+5% to +10%: Getting extended, caution
+10%+: Overextended, expect pullback
-2% to -5%: Testing support
-5% to -10%: Oversold zone
-10%+: Deep correction or downtrend
Customization:
4 corner positions
5 font sizes (Tiny to Huge)
Toggle visibility on/off
═══════════════════════════════════════════════
HOW TO USE - PRACTICAL TRADING GUIDE
═══════════════════════════════════════════════
STRATEGY 1: Trend Following
Identify trend : Wait for GREEN (bullish) or RED (bearish) cloud
Enter on signal : Golden Cross in GREEN cloud = LONG, Death Cross in RED cloud = SHORT
Hold position : While cloud maintains color
Exit signals :
• Cloud turns ORANGE/BLUE = momentum weakening, tighten stops
• Opposite crossover = close position
• Cloud turns opposite color = full reversal
STRATEGY 2: Pullback Entries
Confirm trend : GREEN cloud established (bullish bias)
Wait for pullback : Price touches or crosses below Fast MA
Enter when : Price rebounds back above Fast MA with cloud still GREEN
Stop loss : Below Medium MA or recent swing low
Target : Previous high or when cloud weakens
STRATEGY 3: Momentum Confirmation
Your setup triggers : (e.g., chart pattern, support/resistance)
Check cloud color :
• GREEN = proceed with LONG
• RED = proceed with SHORT
• BLUE/ORANGE = skip or reduce size
Use gradient as confluence : Not as primary signal, but as momentum filter
Risk Management Tips:
Never enter against the cloud color (don't LONG in RED cloud)
Reduce position size during BLUE/ORANGE (transition periods)
Place stops beyond Medium MA for swing trades
Use Slow MA (200) as final trend filter - don't SHORT above it in uptrends
═══════════════════════════════════════════════
PERFORMANCE & OPTIMIZATION
═══════════════════════════════════════════════
Tested On:
Crypto: BTC, ETH, major altcoins
Stocks: SPY, AAPL, TSLA, QQQ
Forex: EUR/USD, GBP/USD, USD/JPY
Indices: S&P 500, NASDAQ, DJI
═══════════════════════════════════════════════
TRANSPARENCY & RELIABILITY
═══════════════════════════════════════════════
Educational Focus:
Detailed tooltips on every input
Clear documentation of methodology
Practical examples in descriptions
Teaches you why , not just what
Open Logic:
Momentum calculation: (Fast slope + Medium slope) / 2
Smoothing: 8-bar EMA to reduce noise
Thresholds: ±0.02% for strong momentum classification
Everything is transparent and explainable
═══════════════════════════════════════════════
COMPLETE FEATURE LIST
═══════════════════════════════════════════════
Visual Components:
26-layer exponential gradient cloud
3 customizable moving average lines
Golden Cross / Death Cross labels
Real-time info panel with trend strength
MA distance table
Calculation Features:
6 MA types (EMA, SMA, WMA, VWMA, RMA, HMA)
Momentum-based cloud coloring
Smoothed trend strength scoring
Conditional performance optimization
Customization Options:
All MA lengths adjustable
All colors customizable (when gradient disabled)
Panel position (4 corners)
Font sizes (5 options)
Toggle any feature on/off
Signal Features:
Anti-spam filter (configurable gap)
Clean, non-overlapping labels
Built-in alert conditions
No repainting guarantee
═══════════════════════════════════════════════
IMPORTANT DISCLAIMERS
═══════════════════════════════════════════════
This indicator is for educational and informational purposes only
Not financial advice - always do your own research
Past performance does not guarantee future results
Use proper risk management - never risk more than you can afford to lose
Test on paper/demo accounts before using with real money
Combine with other analysis methods - no single indicator is perfect
Works best in trending markets; less effective in choppy/sideways conditions
Signals may perform differently in different timeframes and market conditions
The indicator uses historical data for MA calculations - allow sufficient lookback period
═══════════════════════════════════════════════
CREDITS & TECHNICAL INFO
═══════════════════════════════════════════════
Version: 2.0
Release: October 2025
Special Thanks:
TradingView community for feedback and testing
Pine Script documentation for technical reference
═══════════════════════════════════════════════
SUPPORT & UPDATES
═══════════════════════════════════════════════
Found a bug? Comment below with:
Ticker symbol
Timeframe
Screenshot if possible
Steps to reproduce
Feature requests? I'm always looking to improve! Share your ideas in the comments.
Questions? Check the tooltips first (hover over any input) - most answers are there. If still stuck, ask in comments.
═══════════════════════════════════════════════
Happy Trading!
Remember: The best indicator is the one you understand and use consistently. Take time to learn how the cloud behaves in different market conditions. Practice on paper before going live. Trade smart, manage risk, and may the trends be with you! 🚀

Portfolio Strategy TesterThe Portfolio Strategy Tester is an institutional-grade backtesting framework that evaluates the performance of trend-following strategies on multi-asset portfolios. It enables users to construct custom portfolios of up to 30 assets and apply moving average crossover strategies across individual holdings. The model features a clear, color-coded table that provides a side-by-side comparison between the buy-and-hold portfolio and the portfolio using the risk management strategy, offering a comprehensive assessment of both approaches relative to the benchmark.
Portfolios are constructed by entering each ticker symbol in the menu, assigning its respective weight, and reviewing the total sum of individual weights displayed at the top left of the table. For strategy selection, users can choose between Exponential Moving Average (EMA), Simple Moving Average (SMA), Wilder’s Moving Average (RMA), Weighted Moving Average (WMA), Moving Average Convergence Divergence (MACD), and Volume-Weighted Moving Average (VWMA). Moving average lengths are defined in the menu and apply only to strategy-enabled assets.
To accurately replicate real-world portfolio conditions, users can choose between daily, weekly, monthly, or quarterly rebalancing frequencies and decide whether cash is held or redistributed. Daily rebalancing maintains constant portfolio weights, while longer intervals allow natural drift. When cash positions are not allowed, capital from bearish assets is automatically redistributed proportionally among bullish assets, ensuring the portfolio remains fully invested at all times. The table displays a comprehensive set of widely used institutional-grade performance metrics:
CAGR = Compounded annual growth rate of returns.
Volatility = Annualized standard deviation of returns.
Sharpe = CAGR per unit of annualized standard deviation.
Sortino = CAGR per unit of annualized downside deviation.
Calmar = CAGR relative to maximum drawdown.
Max DD = Largest peak-to-trough decline in value.
Beta (β) = Sensitivity of returns relative to benchmark returns.
Alpha (α) = Excess annualized risk-adjusted returns relative to benchmark.
Upside = Ratio of average return to benchmark return on up days.
Downside = Ratio of average return to benchmark return on down days.
Tracking = Annualized standard deviation of returns versus benchmark.
Turnover = Average sum of absolute changes in weights per year.
Cumulative returns are displayed on each label as the total percentage gain from the selected start date, with green indicating positive returns and red indicating negative returns. In the table, baseline metrics serve as the benchmark reference and are always gray. For portfolio metrics, green indicates outperformance relative to the baseline, while red indicates underperformance relative to the baseline. For strategy metrics, green indicates outperformance relative to both the baseline and the portfolio, red indicates underperformance relative to both, and gray indicates underperformance relative to either the baseline or portfolio. Metrics such as Volatility, Tracking Error, and Turnover ratio are always displayed in gray as they serve as descriptive measures.
In summary, the Portfolio Strategy Tester is a comprehensive backtesting tool designed to help investors evaluate different trend-following strategies on custom portfolios. It enables real-world simulation of both active and passive investment approaches and provides a full set of standard institutional-grade performance metrics to support data-driven comparisons. While results are based on historical performance, the model serves as a powerful portfolio management and research framework for developing, validating, and refining systematic investment strategies.

SFC Bollinger Band and Bandit概述 (Overview)
SFC 布林通道與海盜策略 (SFC Bollinger Band and Bandit Strategy) 是一個基於 Pine Script™ v6 的技術分析指標,結合布林通道 (Bollinger Bands)、移動平均線 (Moving Averages) 以及布林海盜 (Bollinger Bandit) 交易策略,旨在為交易者提供多時間框架的趨勢分析與進出場訊號。該腳本支援風險管理功能,並提供視覺化圖表與交易訊號提示,適用於多種金融市場。
This script, written in Pine Script™ v6, combines Bollinger Bands, Moving Averages, and the Bollinger Bandit strategy to provide traders with multi-timeframe trend analysis and entry/exit signals. It includes risk management features and visualizes data through charts and trading signals, suitable for various financial markets.
功能特點 (Key Features)
布林通道 (Bollinger Bands)
提供可調整的標準差參數 (σ1, σ2),支援多層布林通道顯示。
進場訊號基於價格穿越布林通道上下軌,並結合連續K線確認機制。
Provides adjustable standard deviation parameters (σ1, σ2) for multi-layer Bollinger Bands display.
Entry signals are based on price crossing the upper/lower bands, combined with a consecutive bar confirmation mechanism.
移動平均線 (Moving Averages)
支援簡單移動平均線 (SMA) 或指數移動平均線 (EMA),可自訂快、中、慢線週期。
Supports Simple Moving Average (SMA) or Exponential Moving Average (EMA) with customizable fast, medium, and slow line periods.
布林海盜策略 (Bollinger Bandit Strategy)
基於變動率 (ROC) 與布林通道動態止損,提供做多與做空訊號。
包含動態止損均線與平倉天數設定,增強交易靈活性。
Utilizes Rate of Change (ROC) and Bollinger Bands with dynamic stop-loss for long and short signals.
Includes dynamic stop-loss moving average and liquidation days for enhanced trading flexibility.
多時間框架分析 (Multi-Timeframe Analysis)
支援六個時間框架 (5分、15分、1小時、4小時、日線、週線) 的趨勢分析。
通過表格顯示各時間框架的連續上漲/下跌趨勢,輔助交易決策。
Supports trend analysis across six timeframes (5m, 15m, 1h, 4h, daily, weekly).
Displays consecutive up/down trends in a table to aid decision-making.
風險管理 (Risk Management)
提供基於 ATR 或布林通道的停利/停損設定。
自動計算交易手數,根據報價貨幣匯率調整風險敞口。
Offers take-profit/stop-loss settings based on ATR or Bollinger Bands.
Automatically calculates trading lots, adjusting risk exposure based on quote currency exchange rates.
視覺化與提示 (Visualization and Alerts)
繪製布林通道、移動平均線、海盜策略動態止損線及交易訊號。
提供多時間框架趨勢表格、交易手數標籤及浮水印。
支援交易訊號快訊,方便即時監控。
Plots Bollinger Bands, Moving Averages, Bandit strategy stop-loss lines, and trading signals.
Includes multi-timeframe trend tables, trading lot labels, and watermark.
Supports alert conditions for real-time trade monitoring.
使用說明 (Usage Instructions)
設置參數 (Parameter Setup)
布林通道 (Bollinger Bands): 可調整週期 (預設21)、標準差 (σ1=1, σ2=2) 及停利/停損依據 (ATR 或 BAND)。
移動平均線 (Moving Averages): 可選擇顯示快線 (10)、中線 (20)、慢線 (60),並切換 SMA/EMA。
布林海盜 (Bollinger Bandit): 調整通道週期 (50)、平倉均線週期 (50) 及 ROC 週期 (30)。
時間框架 (Timeframes): 自訂六個時間框架,預設為 5分、15分、1小時、4小時、日線、週線。
Adjust Bollinger Band period (default 21), standard deviations (σ1=1, σ2=2), and take-profit/stop-loss basis (ATR or BAND).
Configure Moving Averages (fast=10, medium=20, slow=60) and toggle SMA/EMA.
Set Bollinger Bandit parameters: channel period (50), liquidation MA period (50), ROC period (30).
Customize six timeframes (default: 5m, 15m, 1h, 4h, daily, weekly).
交易訊號 (Trading Signals)
買入訊號 (Buy): 價格穿越下軌且滿足連續K線條件。
賣出訊號 (Sell): 價格穿越上軌且滿足連續K線條件。
海盜策略訊號: 基於 ROC 與布林通道穿越,結合動態止損。
Buy signal: Price crosses below lower band with consecutive bar confirmation.
Sell signal: Price crosses above upper band with consecutive bar confirmation.
Bandit strategy signals: Based on ROC and band crossings with dynamic stop-loss.
視覺化 (Visualization)
布林通道以不同顏色顯示上下軌與中軌。
移動平均線以快、中、慢線區分顏色。
趨勢表格顯示各時間框架的趨勢狀態 (🔴上漲, 🟢下跌, ⚪中性)。
海盜策略顯示動態止損線與交易狀態。
Bollinger Bands display upper, lower, and middle bands in distinct colors.
Moving Averages use different colors for fast, medium, and slow lines.
Trend table shows timeframe trends (🔴 up, 🟢 down, ⚪ neutral).
Bandit strategy displays dynamic stop-loss and trading status.

Jensen Alpha RS🧠 Jensen Alpha RS (J-Alpha RS)
Jensen Alpha RS is a quantitative performance evaluation tool designed to compare multiple assets against a benchmark using Jensen’s Alpha — a classic risk-adjusted return metric from modern portfolio theory.
It helps identify which assets have outperformed their benchmark on a risk-adjusted basis and ranks them in real time, with optional gating and visual tools. 📊
✨ Key Features
• 🧩 Multi-Asset Comparison: Evaluate up to four assets simultaneously.
• 🔀 Adaptive Benchmarking: TOTALES mode uses CRYPTOCAP:TOTALES (total crypto market cap ex-stablecoins). Dynamic mode automatically selects the strongest benchmark among BTC, ETH, and TOTALES based on rolling momentum.
• 📐 Jensen’s Alpha Calculation: Uses rolling covariance, variance, and beta to estimate α, showing how much each asset outperformed its benchmark.
• 📈 Z-Score & Consistency Metrics: Z-Score highlights statistical deviations in alpha; Consistency % shows how often α has been positive over a chosen window.
• 🚦 Trend & Zero Gates: Optional filters that require assets to be above EMA (trend) and/or have α > 0 for confirmation.
• 🏆 Leaders Board Table: Displays α, Z, Rank, Consistency %, and Gate ✓/✗ for all assets in a clear visual layout.
• 🔔 Dynamic Alerts: Get notified whenever the top alpha leader changes on confirmed (non-repainting) data.
• 🎨 Visual Enhancements: Smooth α with an SMA or color bars by the current top-performing asset.
🧭 Typical Use Cases
• 🔄 Portfolio Rotation & Relative Strength: Identify which assets consistently outperform their benchmark to optimize capital allocation.
• 🧮 Alpha Persistence Analysis: Gauge whether a trend’s performance advantage is statistically sustainable.
• 🌐 Market Regime Insight: Observe how asset leadership rotates as benchmarks shift across market cycles.
⚙️ Inputs Overview
• 📝 Assets (1–4): Select up to four tickers for evaluation.
• 🧭 Benchmark Mode: Choose between static TOTALES or Dynamic auto-selection.
• 📏 Alpha Settings: Adjustable lookback, smoothing, and consistency windows.
• 🚦 Gates: Optional trend and alpha filters to refine results.
• 🖥️ Display: Enable/disable table and customize colors.
• 🔔 Alerts: Toggle notifications on leadership changes.
🔎 Formula Basis
Jensen’s Alpha (α) is estimated as:
α = E − β × E
where β = Cov(Ra, Rb) / Var(Rb), and Ra/Rb represent asset and benchmark returns, respectively.
A positive α indicates outperformance relative to the risk-adjusted benchmark expectation. ✅
⚠️ Disclaimer
This script is for educational and analytical purposes only.
It is NOT a signal. 🚫📉
It does not constitute financial advice, trading signals, or investment recommendations. 💬
The author is not responsible for any financial losses or trading decisions made based on this indicator. 🙏
Always perform your own analysis and use proper risk management. 🛡️

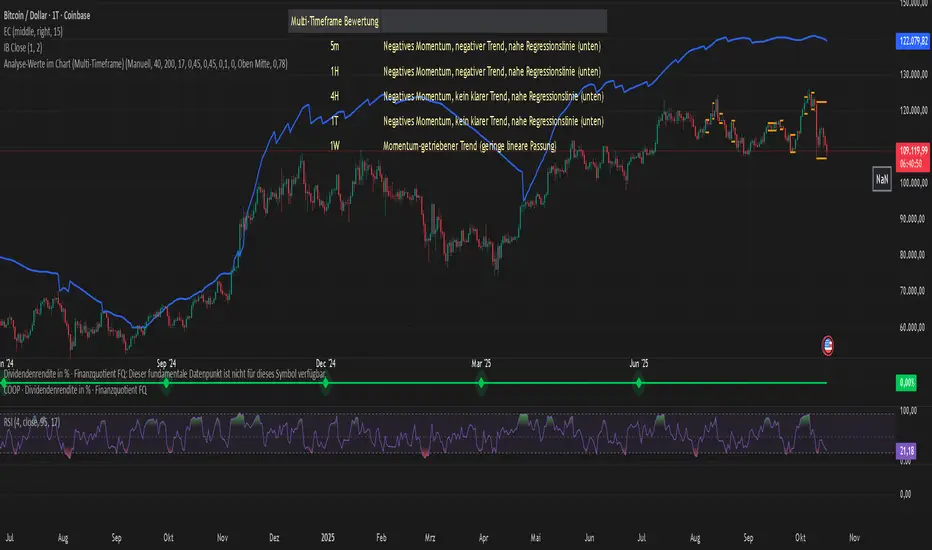
Analyse-Werte im Chart (Multi-Timeframe)Core Components
The indicator evaluates a trend based on four main pillars, which are combined into an overall score:
Momentum (Rate of Change / Standard Deviation): Measures the strength and speed of the current price movement. High momentum indicates a strong, directional move.
Trend Stability (R² - R-Squared): This is the heart of the analysis. The indicator searches for the best-fitting linear regression line within a user-defined period. The R² value (0-100%) indicates how well the price action fits this straight line. A high value signals a very stable, "clean" trend.
Stability/Risk (Rate of Change / Ulcer Index): Compares the trend strength to the pullbacks (drawdowns) it has experienced. A trend that rises steadily without suffering deep declines receives a high rating here.
RSI Proximity to 60: A small bonus factor based on the assumption that strong uptrends often use the 60 RSI level as support.
## The Output Table
The result of this analysis is displayed in a clear table:
Score Value: An overall grade from 0 to 100 that provides a weighted summary of the four components mentioned above.
R2 Value (%): Indicates the percentage of "linearity" of the identified trend.
Regression Length: The number of candles over which the most stable trend was found.
Channel Z-Value: Measures how many standard deviations the current price is away from the trend line. A high positive value (> 1.8) can indicate an over-extended or "overheated" condition.
Evaluation: An auto-generated text that translates the mathematical values into a human-readable assessment. It distinguishes between stable trends, momentum-driven (unstable) trends, corrections, and sideways phases.
Multi-Timeframe Analysis: Shows the "Evaluation" for various timeframes (from 5 minutes to 1 week), allowing for a quick overview of the asset's overall picture.
## Flexibility through Profiles and Manual Control
One of the indicator's greatest strengths is its customizability:
Profiles: You can switch between three predefined analysis profiles with a single click:
Short-Term: Focuses on high momentum for day trading.
Mid-Term: A balanced setting for swing trading (Standard).
Long-Term: Focuses on the stability of the primary trend for investors.
Manual Mode: Allows you to adjust every single setting (R2 lengths, score weights) yourself to perfectly tailor the indicator to your own strategy and the specific chart.
RPT Position Sizer🎯 Purpose
This indicator is a position sizing and stop-loss calculator designed to help traders instantly determine:
How many shares/contracts to buy,
How much risk (₹) they are taking per trade,
How much capital will be deployed, and
The precise stop-loss price level based on user-defined parameters.
It displays all key values in a compact on-chart table (bottom-left corner) for quick trade planning.
💡 Use Case
Perfect for discretionary swing traders, systematic position traders, and risk managers who want instant visual feedback of trade sizing metrics directly on the chart — eliminating manual calculations and improving discipline.
⚙️ Key Features
Dynamic Inputs
Trading Capital (₹) — total available capital for trading.
RPT % — risk-per-trade as a percentage of total capital.
SL % — stop-loss distance in percent below CMP (Current Market Price).
CMP Source — can be linked to close, hl2, etc.
Rounding Style — round position size to Nearest, Floor, or Ceil.
Decimals Show — control number formatting precision in the table.
Core Calculations
SL Points: CMP × SL%
SL Price: CMP − SL Points
Risk Amount (₹): Capital × RPT%
Position Size: Risk ÷ SL Points
Capital Used: Position Size × CMP
Clean On-Chart Table Display
Displays:
Trading Capital
RPT %
Risk Amount (₹)
Position Size (shares/contracts)
Capital Required (₹)
Stop-Loss % & SL Price
The table uses a minimalistic white-on-black design with clear labeling and rupee formatting for quick reference.
Data Window Integration
Plots hidden values (Position Size, Risk Amount, SL Points, Capital Used) for use in TradingView’s Data Window—ideal for strategy testing and exporting values.

Adaptive Trend Breaks Adaptive Trend Breaks
## WHAT IT DOES
This script is a modified and enhanced version of "Trendline Breakouts With Targets" concept by ChartPrime.
Adaptive Trend Breaks (ATB) is a trendline breakout system optimized for scalping liquid futures contracts. The indicator automatically draws dynamic support and resistance trendlines based on pivot points, then generates trade signals when price breaks through these levels with confirmation filters. It includes automated target and stop-loss placement with real-time P&L tracking in dollars.
## HOW IT WORKS
**Trendline Detection Method:**
The indicator uses pivot high/low detection to identify significant price turning points. When a new pivot forms, it calculates the slope between consecutive pivots to draw dynamic trendlines. These lines extend forward based on the established trend angle, creating actionable support and resistance zones.
**Band System:**
Around each trendline, the script creates a "band" using a volatility-adjusted calculation: `ATR(14) * 0.2 * bandwidth multiplier / 2`. This adaptive band accounts for current market conditions - wider during volatile periods, tighter during quiet markets.
**Breakout Logic:**
A breakout signal triggers when:
1. Price closes beyond the trendline + band zone
2. Volume exceeds the 20-period moving average by your set multiplier (default 1.2x)
3. Price is within Regular Trading Hours (9:30-16:00 EST) if session filter enabled
4. Current ATR meets minimum volatility threshold (prevents trading dead markets)
**Target & Stop Calculation:**
Upon breakout confirmation:
- **Entry**: Trendline breach point
- **Target**: Entry ± (bandwidth × target multiplier) - default 8x for quick scalps
- **Stop**: Entry ± (bandwidth × stop multiplier) - default 8x for 1:1 risk/reward
- Multipliers adjust automatically to market volatility through the ATR-based band
**P&L Conversion:**
The script converts point movements to dollars using:
```
Dollar P&L = (Price Points × Contract Point Value × Quantity)
```
For example, a 10-point NQ move with 2 contracts = 10 × $20 × 2 = $400
## HOW TO USE IT
**Setup:**
1. Select your instrument (NQ/ES/YM/RTY) - point values auto-configure
2. Set contract quantity for accurate dollar P&L
3. Choose pivot period (lower = more signals but more noise, default 5 for scalping)
4. Adjust bandwidth multiplier if trendlines are too tight/loose (1-5 range)
**Filters Configuration:**
- **Volume Filter**: Requires breakout volume > moving average × multiplier. Increase multiplier (1.5-2.0) for higher conviction trades
- **Session Filter**: Enable to trade only RTH. Disable for 24-hour trading
- **ATR Filter**: Prevents signals during low volatility. Increase minimum % for more active markets only
**Risk Management:**
- Set target/stop multipliers based on your risk tolerance
- 8x bandwidth = approximately 1:1 risk/reward for most liquid futures
- Enable trailing stops for trend-following approach (moves stop to protect profits)
- Adjust line length to see targets further into the future
**Statistics Table:**
- Choose timeframe to analyze: all-time, today, this week, custom days
- Monitor win rate, profit factor, and net P&L in dollars
- Track long vs short performance separately
- See real-time unrealized P&L on active trades
**Reading Signals:**
- **Green triangle below bar** = Long breakout (resistance broken)
- **Red triangle above bar** = Short breakout (support broken)
- **White dashed line** = Entry price
- **Orange line** = Take profit target with dollar value
- **Red line** = Stop loss with dollar value
- **Green checkmark (✓)** = Target hit, winning trade
- **Red X (✗)** = Stop hit, losing trade
## WHAT IT DOES NOT DO
**Limitations to Understand:**
- Does not predict future trendline formations - it reacts to breakouts after they occur
- Historical trendlines disappear after breakout (not kept on chart for clarity)
- Requires sufficient volatility - may not signal in extremely quiet markets
- Volume filter requires exchange volume data (not available on all symbols)
- Statistics are indicator-based simulations, not actual trading results
- Does not account for slippage, commissions, or order fills
## BEST PRACTICES
**Recommended Settings by Market:**
- **NQ (Nasdaq)**: Default settings work well, consider volume multiplier 1.3-1.5
- **ES (S&P 500)**: Slightly slower, try period 7-8, volume 1.2
- **YM (Dow)**: Lower volatility, reduce bandwidth to 1.5-2
- **RTY (Russell)**: Higher volatility, increase bandwidth to 3-4
**Risk Management:**
- Never risk more than 2-3% of account per trade
- Use contract quantity calculator: Max Risk $ ÷ (Stop Distance × Point Value)
- Start with 1 contract while learning the system
- Backtest your specific timeframe and instrument before live trading
**Optimization Tips:**
- Increase pivot period (7-10) for fewer but higher-quality signals
- Raise volume multiplier (1.5-2.0) in choppy markets
- Lower target/stop multipliers (5-6x) for tighter profit taking
- Use trailing stops in strong trending conditions
- Disable session filter for overnight gaps and Asia session moves
## TECHNICAL DETAILS
**Key Calculations:**
- Pivot Detection: `ta.pivothigh(high, period, period/2)` and `ta.pivotlow(low, period, period/2)`
- Slope Calculation: `(newPivot - oldPivot) / (newTime - oldTime)`
- Adaptive Band: `min(ATR(14) * 0.2, close * 0.002) * multiplier / 2`
- Breakout Confirmation: Price crosses trendline + 10% of band threshold
**Data Requirements:**
- Minimum bars in view: 500 for proper pivot calculation
- Volume data required for volume filter accuracy
- Intraday timeframes recommended (1min - 15min) for scalping
- Works on any timeframe but optimized for fast execution
**Performance Metrics:**
All statistics calculate based on indicator signals:
- Tracks every signal as a trade from entry to TP/SL
- P&L in actual contract dollar values
- Win rate = (Winning trades / Total trades) × 100
- Profit factor = Gross profit / Gross loss
- Separates long/short performance for bias analysis
## IDEAL FOR
- Futures scalpers and day traders
- Traders who prefer visual trendline breakouts
- Those wanting automated TP/SL placement
- Traders tracking performance in dollar terms
- Multiple timeframe analysis (compare 1min vs 5min signals)
## NOT SUITABLE FOR
- Swing trading (targets too close)
- Stocks/forex without modifying point values
- Extremely low timeframes (<30 seconds) - too much noise
- Markets without volume data if using volume filter
- Illiquid contracts (signals may not execute at shown prices)
---
**Settings Summary:**
- Core: Period, bandwidth, extension, trendline style
- Filters: Volume, RTH session, ATR volatility
- Risk: R:R ratio, target/stop multipliers, trailing stop
- Display: Stats table position, size, colors
- Stats: Timeframe selection (all-time to custom days)
**License:** This indicator is published open-source under Mozilla Public License 2.0. You may use and modify the code with proper attribution.
**Disclaimer:** This indicator is for educational purposes. Past performance does not guarantee future results. Always practice proper risk management and test thoroughly before live trading.
---
## CREDITS & ATTRIBUTION
This script builds upon the "Trendline Breakouts With Targets" concept by ChartPrime with significant enhancements:
**Major Improvements Added:**
- **Futures-Specific Calculations**: Automated dollar P&L conversion using actual contract point values (NQ=$20, ES=$50, YM=$5, RTY=$50)
- **Advanced Statistics Engine**: Comprehensive performance tracking with customizable timeframe analysis (today, week, month, custom ranges)
- **Multi-Layer Filtering System**: Volume confirmation, RTH session filter, and ATR volatility filter to reduce false signals
- **Professional Trade Management**: Enhanced visual trade tracking with separate TP/SL lines, dollar value labels, and optional trailing stops
- **Optimized for Scalping**: Faster pivot periods (5 vs 10), tighter bands, and reduced extension bars for quick entries
Original trendline detection methodology by ChartPrime - used with modification under Mozilla Public License 2.0.

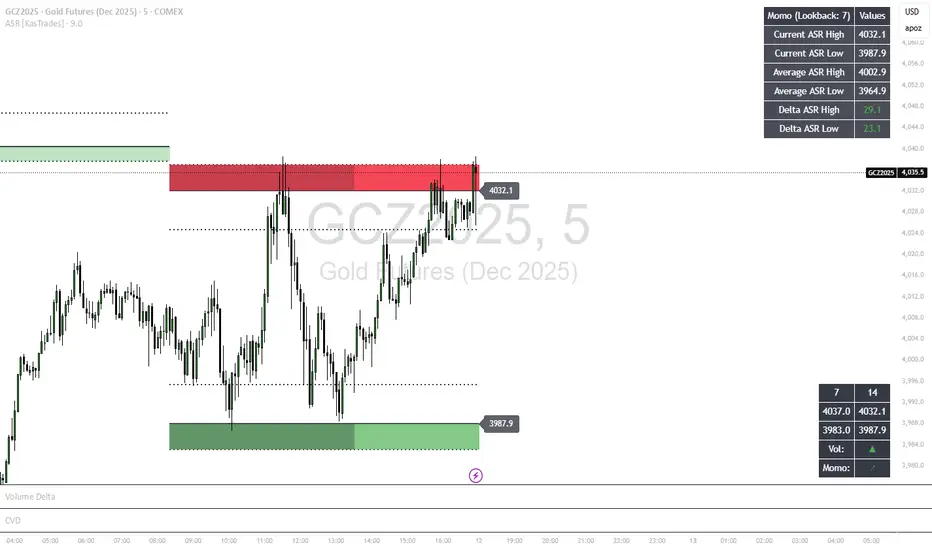
ASR - Average Session Range [KasTrades]This indicator displays the Average Session Range based on the session of your choice.
You can turn the tables off if you don't want to see a table version of the ASR levels. There is also a momentum table showing the current momentum, which you can also turn off.
Position Size CalculatorPosition Size CalculatorRisk Management Made Simple – Size Your Trades Like a Pro!Tired of guessing position sizes and blowing up your account on oversized trades? This Pine Script indicator automates position sizing based on your risk tolerance, ensuring every trade risks only what you've predefined. Perfect for stocks, forex, crypto, or futures—works for long or short setups. Overlay it on your candlestick chart and watch the math do the work.Key Features:Smart Risk Control: Input your account size (e.g., $70k) and risk % (e.g., 1%). It caps your max loss per trade automatically.
Dynamic Entry & Stop: Use live chart close as entry, or click to set a manual entry level (green solid line). For stops, toggle manual placement (red broken line) or use a % distance—auto-calculates the effective % for precision.
Visual Markers: Green line for entry price, red dashed line for stop loss—spans your chart for easy spotting.
Customizable Table: Floating info panel shows Account Size, Risk Amount, Stop Distance %, and Position Size (shares/lots). Drag its position via settings (top-right default).
No More Guesswork: Formula: Position Size = (Account × Risk %) ÷ Stop Distance. Handles edge cases like tiny distances to avoid div-by-zero.
How to Use:Add to your chart via Pine Editor.
In settings: Set account size/risk %. Toggle "Use Manual Entry Price" and click chart to place green line. Do the same for stop (red line) or use % input.
Table updates live—grab the position size and execute!
Pro Tip: For shorts/longs, the abs distance keeps risk symmetric. Test on demo first.
Built for v6—clean, lightweight, and 100% customizable. Share your tweaks in comments! Remember, this is a tool, not advice—trade responsibly. (Inspired by classic Kelly Criterion vibes, but simplified for daily grinders.)

CVD Divergences (cdikici71 x tncylyv)CVD Divergence
Summary
This indicator brings the powerful and creative divergence detection logic from @cdikici71's popular "cd_RSI_Divergence_Cx" script to the world of volume analysis.
While RSI is a fantastic momentum tool, I personally choose to rely on volume as a primary source of truth. This script was born from the desire to see how true buying and selling pressure—measured by Cumulative Volume Delta (CVD)—diverges from price action. It takes the brilliant engine built by @cdikici71 and applies it to CVD, offering a unique look into market conviction.
What is Cumulative Volume Delta (CVD)?
CVD is a running total of volume that transacted at the ask price (buying) minus volume that transacted at the bid price (selling). In simple terms, it shows whether buyers or sellers have been more aggressive over a period. A rising CVD suggests net buying pressure, while a falling CVD suggests net selling pressure.
Core Features
• Divergence Engine by @cdikici71: The script uses the exact same two powerful methods for finding divergences as the original RSI version:
o Alignment with HTF Sweep: The default, cleaner method for finding high-probability divergences.
o All: A more sensitive method that finds all possible divergences.
• Anchored CVD Periods: You can choose to reset the CVD calculation on a Daily, Weekly, or Monthly basis to analyze buying and selling pressure within specific periods. Or, you can leave it on Continuous to see the all-time flow.
• Automatic Higher Timeframe (HTF) Alignment: To remove the guesswork, the "Auto-Align HTF" option will automatically select a logical higher timeframe for divergence analysis based on your current chart (e.g., 15m chart uses 4H for divergence, 1H chart uses 1D, etc.). You can also turn this off for full manual control.
• Fully Customizable Information Table: An on-screen table keeps you updated on the divergence status. You can easily adjust its Position and Size in the settings to fit your chart layout.
• Built-in Alerts: Alerts are configured for both Bullish and Bearish divergences to notify you as soon as they occur.
How to Use This Indicator
The principle is the same as any divergence strategy, but with the conviction of volume behind it.
• 🔴 Bearish Divergence: Price makes a Higher High, but the CVD makes a Lower High or an equal high. This suggests that the buying pressure is weakening and may not be strong enough to support the new price high.
• 🟢 Bullish Divergence: Price makes a Lower Low, but the CVD makes a Higher Low or an equal low. This suggests that selling pressure is exhausting and the market may be ready for a reversal.
Always use divergence signals as a confluence with your own analysis, support/resistance levels, and market structure.
Huge Thanks and Credit
This script would not exist without the brilliant and creative work of @cdikici71. The entire divergence detection engine, the visualization style, and the core logic are based on his original masterpiece, "cd_RSI_Divergence_Cx". I have simply adapted his framework to a different data source.
If you find this indicator useful, please go and show your support for his original work!
________________________________________
Disclaimer: This is a tool for analysis, not a financial advice signal service. Please use it responsibly as part of a complete trading strategy.

Trend Fib Zone Bounce (TFZB) [KedArc Quant]Description:
Trend Fib Zone Bounce (TFZB) trades with the latest confirmed Supply/Demand zone using a single, configurable Fib pullback (0.3/0.5/0.6). Trade only in the direction of the most recent zone and use a single, configurable fib level for pullback entries.
• Detects market structure via confirmed swing highs/lows using a rolling window.
• Draws Supply/Demand zones (bearish/bullish rectangles) from the latest MSS (CHOCH or BOS) event.
• Computes intra zone Fib guide rails and keeps them extended in real time.
• Triggers BUY only inside bullish zones and SELL only inside bearish zones when price touches the selected fib and closes back beyond it (bounce confirmation).
• Optional labels print BULL/BEAR + fib next to the triangle markers.
What it does
Finds structure using confirmed swing highs/lows (you choose the confirmation length).
Builds the latest zone (bullish = demand, bearish = supply) after a CHOCH/BOS event.
Draws intra-zone “guide rails” (Fib lines) and extends them live.
Signals only with the trend of that zone:
BUY inside a bullish zone when price tags the selected Fib and closes back above it.
SELL inside a bearish zone when price tags the selected Fib and closes back below it.
Optional labels print BULL/BEAR + Fib next to triangles for quick context
Why this is different
Most “zone + fib + signal” tools bolt together several indicators, or fire counter-trend signals because they don’t fully respect structure. TFZB is intentionally minimal:
Single bias source: the latest confirmed zone defines direction; nothing else overrides it.
Single entry rule: one Fib bounce (0.3/0.5/0.6 selectable) inside that zone—no counter-trend trades by design.
Clean visuals: you can show only the most recent zone, clamp overlap, and keep just the rails that matter.
Deterministic & transparent: every plot/label comes from the code you see—no external series or hidden smoothing
How it helps traders
Cuts decision noise: you always know the bias and the only entry that matters right now.
Forces discipline: if price isn’t inside the active zone, you don’t trade.
Adapts to volatility: pick 0.3 in strong trends, 0.5 as the default, 0.6 in chop.
Non-repainting zones: swings are confirmed after Structure Length bars, then used to build zones that extend forward (they don’t “teleport” later)
How it works (details)
*Structure confirmation
A swing high/low is only confirmed after Structure Length bars have elapsed; the dot is plotted back on the original bar using offset. Expect a confirmation delay of about Structure Length × timeframe.
*Zone creation
After a CHOCH/BOS (momentum shift / break of prior swing), TFZB draws the new Supply/Demand zone from the swing anchors and sets it active.
*Fib guide rails
Inside the active zone TFZB projects up to five Fib lines (defaults: 0.3 / 0.5 / 0.7) and extends them as time passes.
*Entry logic (with-trend only)
BUY: bar’s low ≤ fib and close > fib inside a bullish zone.
SELL: bar’s high ≥ fib and close < fib inside a bearish zone.
*Optionally restrict to one signal per zone to avoid over-trading.
(Optional) Aggressive confirm-bar entry
When do the swing dots print?
* The code confirms a swing only after `structureLen` bars have elapsed since that candidate high/low.
* On a 5-min chart with `structureLen = 10`, that’s about 50 minutes later.
* When the swing confirms, the script plots the dot back on the original bar (via `offset = -structureLen`). So you *see* the dot on the old bar, but it only appears on the chart once the confirming bar arrives.
> Practical takeaway: expect swing markers to appear roughly `structureLen × timeframe` later. Zones and signals are built from those confirmed swings.
Best timeframe for this Indicator
Use the timeframe that matches your holding period and the noise level of the instrument:
* Intraday :
* 5m or 15m are the sweet spots.
* Suggested `structureLen`:
* 5m: 10–14 (confirmation delay \~50–70 min)
* 15m: 8–10 (confirmation delay \~2–2.5 hours)
* Keep Entry Fib at 0.5 to start; try 0.3 in strong trends, 0.6 in chop.
* Tip: avoid the first 10–15 minutes after the open; let the initial volatility set the early structure.
* Swing/overnight:
* 1h or 4h.
* `structureLen`:
* 1h: 6–10 (6–10 hours confirmation)
* 4h: 5–8 (20–32 hours confirmation)
* 1m scalping: not recommended here—the confirmation lag relative to the noise makes zones less reliable.
Inputs (all groups)
Structure
• Show Swing Points (structureTog)
o Plots small dots on the bar where a swing point is confirmed (offset back by Structure Length).
• Structure Length (structureLen)
o Lookback used to confirm swing highs/lows and determine local structure. Higher = fewer, stronger swings; lower = more reactive.
Zones
• Show Last (zoneDispNum)
o Maximum number of zones kept on the chart when Display All Zones is off.
• Display All Zones (dispAll)
o If on, ignores Show Last and keeps all zones/levels.
• Zone Display (zoneFilter): Bullish Only / Bearish Only / Both
o Filters which zone types are drawn and eligible for signals.
• Clean Up Level Overlap (noOverlap)
o Prevents fib lines from overlapping when a new zone starts near the previous one (clamps line start/end times for readability).
Fib Levels
Each row controls whether a fib is drawn and how it looks:
• Toggle (f1Tog…f5Tog): Show/hide a given fib line.
• Level (f1Lvl…f5Lvl): Numeric ratio in . Defaults active: 0.3, 0.5, 0.7 (0 and 1 off by default).
• Line Style (f1Style…f5Style): Solid / Dashed / Dotted.
• Bull/Bear Colors (f#BullColor, f#BearColor): Per-fib color in bullish vs bearish zones.
Style
• Structure Color: Dot color for confirmed swing points.
• Bullish Zone Color / Bearish Zone Color: Rectangle fills (transparent by default).
Signals
• Entry Fib for Signals (entryFibSel): Choose 0.3, 0.5 (default), or 0.6 as the trigger line.
• Show Buy/Sell Signals (showSignals): Toggles triangle markers on/off.
• One Signal Per Zone (oneSignalPerZone): If on, suppresses additional entries within the same zone after the first trigger.
• Show Signal Text Labels (Bull/Bear + Fib) (showSignalLabels): Adds a small label next to each triangle showing zone bias and the fib used (e.g., BULL 0.5 or BEAR 0.3).
How TFZB decides signals
With trend only:
• BUY
1. Latest active zone is bullish.
2. Current bar’s close is inside the zone (between top and bottom).
3. The bar’s low ≤ selected fib and it closes > selected fib (bounce).
• SELL
1. Latest active zone is bearish.
2. Current bar’s close is inside the zone.
3. The bar’s high ≥ selected fib and it closes < selected fib.
Markers & labels
• BUY: triangle up below the bar; optional label “BULL 0.x” above it.
• SELL: triangle down above the bar; optional label “BEAR 0.x” below it.
Right-Panel Swing Log (Table)
What it is
A compact, auto-updating log of the most recent Swing High/Low events, printed in the top-right of the chart.
It helps you see when a pivot formed, when it was confirmed, and at what price—so you know the earliest bar a zone-based signal could have appeared.
Columns
Type – Swing High or Swing Low.
Date – Calendar date of the swing bar (follows the chart’s timezone).
Swing @ – Time of the original swing bar (where the dot is drawn).
Confirm @ – Time of the bar that confirmed that swing (≈ Structure Length × timeframe after the swing). This is also the earliest moment a new zone/entry can be considered.
Price – The swing price (high for SH, low for SL).
Why it’s useful
Clarity on repaint/confirmation: shows the natural delay between a swing forming and being usable—no guessing.
Planning & journaling: quick reference of today’s pivots and prices for notes/backtesting.
Scanning intraday: glance to see if you already have a confirmed zone (and therefore valid fib-bounce entries), or if you’re still waiting.
Context for signals: if a fib-bounce triangle appears before the time listed in Confirm @, it’s not a valid trade (you were too early).
Settings (Inputs → Logging)
Log swing times / Show table – turn the table on/off.
Rows to keep – how many recent entries to display.
Show labels on swing bar – optional tags on the chart (“Swing High 11:45”, “Confirm SH 14:15”) that match the table.
Recommended defaults
• Structure Length: 10–20 for intraday; 20–40 for swing.
• Entry Fib for Signals: 0.5 to start; try 0.3 in stronger trends and 0.6 in choppier markets.
• One Signal Per Zone: ON (prevents over trading).
• Zone Display: Both.
• Fib Lines: Keep 0.3/0.5/0.7 on; turn on 0 and 1 only if you need anchors.
Alerts
Two alert conditions are available:
• BUY signal – fires when a with trend bullish bounce at the selected fib occurs inside a bullish zone.
• SELL signal – fires when a with trend bearish bounce at the selected fib occurs inside a bearish zone.
Create alerts from the chart’s Alerts panel and select the desired condition. Use Once Per Bar Close to avoid intrabar flicker.
Notes & tips
• Swing dots are confirmed only after Structure Length bars, so they plot back in time; zones built from these confirmed swings do not repaint (though they extend as new bars form).
• If you don’t see a BUY where you expect one, check: (1) Is the active zone bullish? (2) Did the candle’s low actually pierce the selected fib and close above it? (3) Is One Signal Per Zone suppressing a second entry?
• You can hide visual clutter by reducing Show Last to 1–3 while keeping Display All Zones off.
Glossary
• CHOCH (Change of Character): A shift where price breaks beyond the last opposite swing while local momentum flips.
• BOS (Break of Structure): A cleaner break beyond the prior swing level in the current momentum direction.
• MSS: Either CHOCH or BOS – any event that spawns a new zone.
Extension ideas (optional)
• Add fib extensions (1.272 / 1.618) for target lines.
• Zone quality score using ATR normalization to filter weak impulses.
• HTF filter to only accept zones aligned with a higher timeframe trend.
⚠️ Disclaimer This script is provided for educational purposes only.
Past performance does not guarantee future results.
Trading involves risk, and users should exercise caution and use proper risk management when applying this strategy.

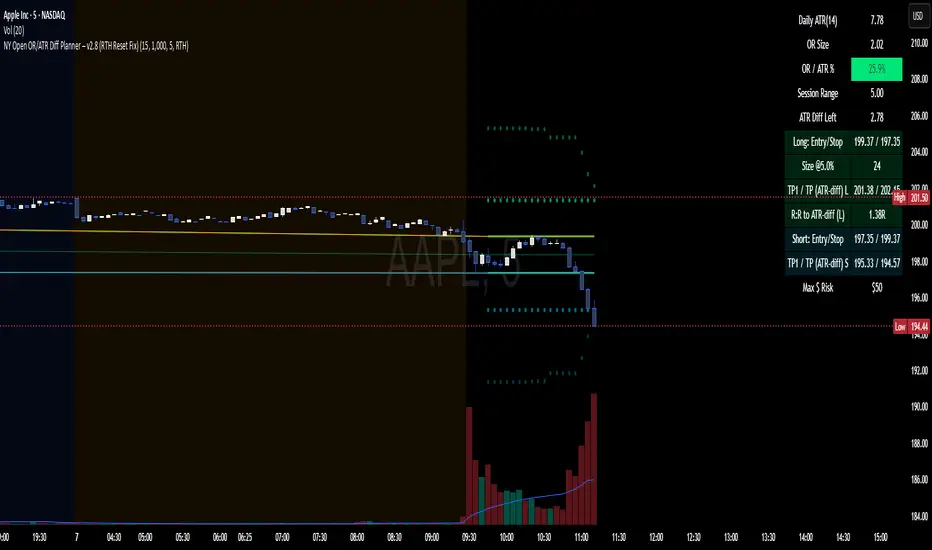
NY Open OR/ATR Diff Planner – v2.8 NY Open OR/ATR Diff Planner – v2.8 (Hi-Contrast)
Trade the Opening Range Breakout with a plan, not vibes.
This tool builds the NY Opening Range (OR) from the cash open and overlays a complete, risk-based execution plan: precise entry, structural stop, position size, targets, and R:R — all tied to the Daily ATR(14) and the remaining ATR “fuel” left in the day.
What it does
Opening Range: First N minutes after 09:30 ET (choose 5/15/30/60).
Today-only lines: Automatically resets at 09:30; no carry-over from prior days.
Session aware: Works on RTH or ETH charts. OR always anchors at 09:30 ET.
Fuel model: Computes Session Range (since 09:30) and ATR Diff Left = Daily ATR − Session Range.
Entries & Stops:
Long plan: Entry = ORH, Stop = ORL
Short plan: Entry = ORL, Stop = ORH
Targets:
TP1 = 1R (distance of entry→stop)
TP (ATR-diff cap): Entry ± ATR Diff Left (caps greed when the day’s ATR is nearly spent)
Sizing & R:R: Position size = Account × Risk% / Risk per share, with live R:R to ATR-diff target.
Hi-contrast table: Clear readout of Daily ATR, OR size, OR/ATR%, Session Range, ATR left, entries/stops/TPs, size, and max $ risk.
Inputs
Opening Range (minutes): 5 / 15 / 30 / 60
Account Size ($) and Risk % per trade
Session mode: RTH (09:30–16:00) or ETH (chart’s session; still anchored at 09:30)
Also show Short plan (toggle)
Show info table (toggle)
How to use
Add on a 1–5m chart.
Choose your OR window (e.g., 15m = 09:30–09:45).
Set Account Size and Risk % (e.g., 4–5% for small accounts; adjust to taste).
Wait for the OR to complete.
Trade the break/retest with the levels shown:
Long: Break of ORH, SL at ORL, TP1 = 1R, TP2 = ATR-diff cap.
Short: Mirror logic.
If OR/ATR% > ~50% (red), the “fuel” is thin — be selective.
Why it helps build an edge
Objective structure: Clear levels and sizing remove guesswork.
Context-aware targets: ATR-diff keeps targets realistic to the day’s potential.
Discipline by design: One framework that’s easy to review, journal, and iterate.
Notes
This is an indicator (visual planner), not an order-placing strategy.
If you want a back testable version (one trade/day, optional retest rule, TP/SL logic), say the word — I can publish a strategy variant.
Keywords: ORB, Opening Range, ATR, Risk Management, Position Sizing, Day Trading, NYSE Open, Mean Reversion Fuel, Execution Planner
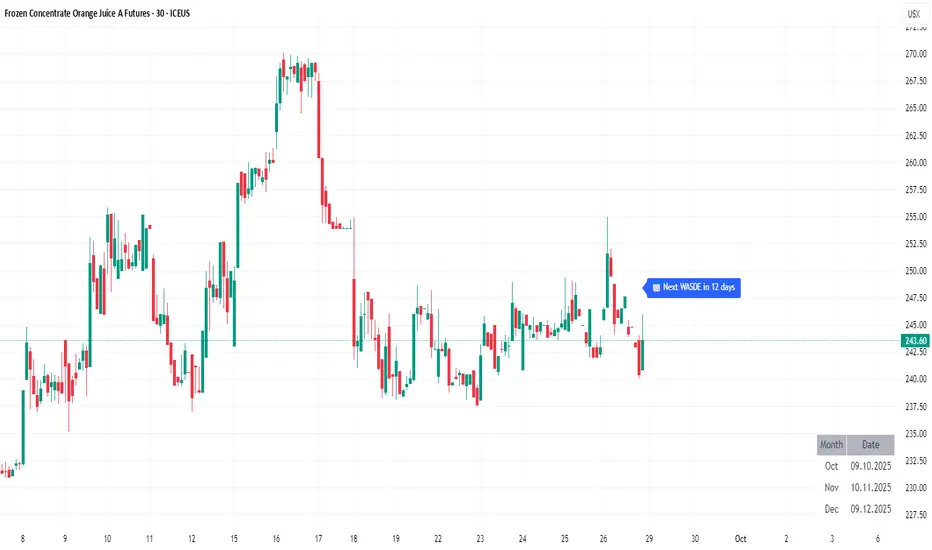
WASDE DatesOverview
WASDE Dates — a small, focused event indicator that displays confirmed USDA WASDE release dates for 2025 on the chart and marks each release day. The indicator is designed to be a lightweight timing tool for traders who want clean visual reminders and optional alerts around USDA WASDE publications.
Features
• Shows official WASDE release dates for 2025 in a compact chart table.
• Draws on-chart markers and a dotted vertical line on WASDE release days.
• Two alert conditions you can enable in TradingView: "WASDE Day Alert" and "WASDE 24h Reminder".
• Simple table position control (Top/Bottom, Left/Right) in the indicator settings.
• Minimal, self-contained code — no external data feeds or permissions required.
How to use
1. Apply the indicator to any chart and timeframe.
2. Use the indicator settings to choose table position.
3. Enable Alerts (if desired) via TradingView Alerts → choose “WASDE Day Alert” or “WASDE 24h Reminder”.
4. This version contains 2025 confirmed dates only — verify dates for live trading and enable alerts as needed.
Design & rationale
This indicator is intentionally not a technical trading signal. It is an event scheduler focused on clarity and low overhead: combine it with your existing setup to avoid being surprised by WASDE publications and to quickly inspect price action around these event dates.
Limitations & disclaimer
• This script shows **confirmed 2025** WASDE dates only. It does not provide trading advice or entry/exit signals. Use at your own risk.
• Double-check official USDA publishing times before executing trades.
• No external links or contact information are included in this description to comply with TradingView publishing rules.
Feature outlook (V2)
Planned V2 (future release): enhanced countdown (days → hours/minutes), optional inclusion of estimated 2026 dates marked as (TBC), and an invite-only/protected advanced version with reaction overlays (T+1/T+3) and extended alert options. V2 will be announced on this script page when ready.
Changelog
v1 — public release: 2025 confirmed dates, release markers, alerts, table position control.
VOLUME Full [Titans_Invest]VOLUME Full
Designed for traders who want to take volume analysis to the next level.
This version delivers deeper insight into volume activity, integrating multiple customizable filters to highlight key buying and selling pressure. It's a comprehensive solution for volume-based decision-making.
⯁ WHAT IS THE VOLUME❓
The Volume indicator is a fundamental technical analysis tool that measures the number of shares or contracts traded in a security or market during a given period. It helps traders and investors understand the strength or weakness of a price movement, confirm trends, and predict potential reversals. Volume is typically displayed as a histogram below a price chart, with each bar representing the volume traded during a specific time interval.
⯁ HOW TO USE THE VOLUME❓
The Volume indicator can be used in several ways to enhance trading decisions:
• Trend Confirmation: High volume during a price move confirms the strength of that trend, while low volume can indicate a weak or unsustainable trend.
• Breakouts: A price breakout from a pattern or range accompanied by high volume is more likely to be valid and sustainable.
• Divergence: When the price moves in one direction and volume moves in the opposite direction, it can signal a potential reversal.
• Overbought/Oversold Conditions: Extreme volume levels can sometimes indicate that an asset is overbought or oversold, though this is less straightforward than with oscillators like the RSI.
⯁ ENTRY CONDITIONS
The conditions below are fully flexible and allow for complete customization of the signal.
______________________________________________________
🔹 CONDITIONS TO BUY 📈
______________________________________________________
▪︎ Signal Validity: The signal will remain valid for X bars .
▪︎ Signal Sequence: Configurable as AND or OR .
🔹 volume Positive
🔹 volume Negative
🔹 volume > volume
🔹 volume < volume
🔹 volume > volume_MA
🔹 volume > volume_MA * Trigger Signal (close > open)
🔹 volume > volume_MA * Trigger Signal (Keep State P)
🔹 volume > volume_MA * Trigger Signal (close < open)
🔹 volume > volume_MA * Trigger Signal (Keep State N)
______________________________________________________
______________________________________________________
🔸 CONDITIONS TO SELL 📉
______________________________________________________
▪︎ Signal Validity: The signal will remain valid for X bars .
▪︎ Signal Sequence: Configurable as AND or OR .
🔸 volume Positive
🔸 volume Negative
🔸 volume > volume
🔸 volume < volume
🔸 volume > volume_MA
🔸 volume > volume_MA * Trigger Signal (close > open)
🔸 volume > volume_MA * Trigger Signal (Keep State P)
🔸 volume > volume_MA * Trigger Signal (close < open)
🔸 volume > volume_MA * Trigger Signal (Keep State N)
______________________________________________________
______________________________________________________
🤖 AUTOMATION 🤖
• You can automate the BUY and SELL signals of this indicator.
______________________________________________________
______________________________________________________
⯁ UNIQUE FEATURES
______________________________________________________
Signal Validity: The signal will remain valid for X bars
Signal Sequence: Configurable as AND/OR
Condition Table: BUY/SELL
Condition Labels: BUY/SELL
Plot Labels in the Graph Above: BUY/SELL
Displays Positive & Negative Volume.
Automate and Monitor Signals/Alerts: BUY/SELL
Signal Validity: The signal will remain valid for X bars
Signal Sequence: Configurable as AND/OR
Table of Conditions: BUY/SELL
Conditions Label: BUY/SELL
Plot Labels in the graph above: BUY/SELL
Displays Positive & Negative Volume.
Automate & Monitor Signals/Alerts: BUY/SELL
______________________________________________________
📜 SCRIPT : VOLUME Full
🎴 Art by : @Titans_Invest & @DiFlip
👨💻 Dev by : @Titans_Invest & @DiFlip
🎑 Titans Invest — The Wizards Without Gloves 🧤
✨ Enjoy!
______________________________________________________
o Mission 🗺
• Inspire Traders to manifest Magic in the Market.
o Vision 𐓏
• To elevate collective Energy 𐓷𐓏

Trades in FavorTrades in Favor Indicator
Overview
The Trades in Favor indicator is a volume-weighted momentum oscillator that helps traders identify market conditions favoring long or short positions. It analyzes the relationship between price movements and volume to determine whether buying or selling pressure is dominating the market.
How It Works
The indicator calculates the percentage of volume-weighted price movements that are bullish versus bearish over a specified lookback period. It outputs values between 0-100:
Values above 70: Short Trade Zone (bearish conditions)
Values below 30: Long Trade Zone (bullish conditions)
Values around 50: Neutral Zone (balanced conditions)
Key Features
Volume-Weighted Analysis: Incorporates volume data for more accurate momentum readings
Clear Trading Zones: Visual zones with labels for immediate context
Customizable Parameters: Adjustable calculation length and smoothing periods
Built-in Alerts: Notifications when entering different trading zones
Information Table: Real-time display of current readings and percentages
Parameters
Calculation Length (20): Number of bars for momentum calculation
Smoothing Period (5): Moving average smoothing for cleaner signals
Short Trade Zone (70): Upper threshold for short trade conditions
Long Trade Zone (30): Lower threshold for long trade conditions
Trading Applications
Trend Confirmation: Validate trend direction with volume-backed momentum
Entry Timing: Identify optimal entry points in respective trade zones
Market Sentiment: Gauge overall buying vs selling pressure
Risk Management: Avoid trades against dominant market flow
Visual Elements
White oscillator line with clear zone boundaries
Background coloring in extreme zones
On-chart labels for immediate context
Information table showing current percentages
Customizable alert conditions
Best Practices
Use in conjunction with other technical analysis tools
Consider multiple timeframes for confirmation
Pay attention to volume spikes in extreme zones
Watch for divergences between price and the indicator
Perfect for swing traders, day traders, and anyone looking to align their trades with volume-backed market momentum.
Multi Straddle-Strangle ChartThis powerful indicator is designed for options traders who want to visualize and track the combined premium of multiple straddle and strangle strategies in a single, dedicated pane.
Quickly analyze and compare up to five different options strategies at a glance, directly on your chart. This tool is perfect for monitoring volatility, tracking potential profits/losses on a position, and spotting key support and resistance levels based on option premiums.
Key Features:
Plot Up to 5 Strategies: Simultaneously plot any combination of up to 5 straddles or strangles.
Real-Time Data: Fetches live data for both Call and Put options to give you an up-to-the-second view of the combined price.
Dynamic Symbol Generation: Automatically detects the underlying symbol (e.g., NIFTY, BANKNIFTY, stocks) and builds the correct option symbols based on your input.
Customizable Inputs: Easily configure the expiry date, strike prices and line colors for each of the 5 lines.
In-Chart Summary Table: A clean and clear table in the corner of your chart provides a quick summary of each enabled strategy and its current price.
Important Note on Usage:
This tool requires you to input a strike price in all fields, even if you do not plan to use all five lines. This is necessary because of a fundamental rule in the Pine Script language: every input must have a constant, non-empty default value. The indicator is optimized to only fetch data for the lines you have explicitly enabled with the "Enable Line X" checkbox.

Z-Score Volume with CVD TrendZ-Score Volume & CVD Trend with Exhaustion Signals
This powerful, all-in-one indicator combines statistical volume analysis, Cumulative Volume Delta (CVD), and a custom clustering algorithm to provide a clear and dynamic view of market sentiment. It is designed to help traders identify the prevailing trend and spot potential reversals or trend exhaustion before they happen.
Important Note: This indicator is specifically designed and optimized for use during the Regular Trading Hours (RTH) New York session, which is typically characterized by high volume and volatility. Its signals may be less reliable in low-volume or overnight sessions.
Core Concepts
1. Volume Z-Score
The script first calculates a Z-score for volume, which measures how many standard deviations a bar's volume is from a moving average. This helps to identify statistically significant volume spikes that may signal institutional activity or a major shift in sentiment.
2. Cumulative Volume Delta (CVD)
CVD plots the net difference between buying and selling volume over time. A rising CVD indicates a surplus of buying pressure, while a falling CVD shows a surplus of selling pressure. This provides a clear look at the direction of momentum.
3. Custom Clustering
By combining the Volume Z-score and CVD delta, the script classifies each bar into one of six distinct "clusters." The purpose is to simplify complex data into actionable signals.
High Conviction Bullish: High Z-score volume with strong CVD buying.
High Conviction Bearish: High Z-score volume with strong CVD selling.
Effort vs. Result: High Z-score volume with no clear CVD bias, indicating indecision or a struggle between buyers and sellers.
Quiet Accumulation: Low volume with subtle CVD buying, suggesting passive accumulation.
Quiet Distribution: Low volume with subtle CVD selling, suggesting passive distribution.
Low Conviction/Noise: Low volume and low CVD, representing general market noise.
Trend and Exhaustion Logic
Trend Establishment: The indicator determines the overall trend (Bullish, Bearish, or Neutral) by analyzing the majority of recent clusters over a configurable lookback period.
A Bullish Trend is confirmed when a majority of recent bars are either "High Conviction Bullish" or "Quiet Accumulation."
A Bearish Trend is confirmed when a majority of recent bars are either "High Conviction Bearish" or "Quiet Distribution."
Trend Exhaustion: This is a key feature for identifying potential reversals. The script looks for a divergence between price action and CVD within a confirmed trend.
Bullish Exhaustion Signal: Occurs during a confirmed "Bullish Trend" when you see a bearish divergence (price makes a higher high, but CVD shows negative delta and a close lower than the open). This is a strong sign the uptrend may be running out of steam.
Bearish Exhaustion Signal: Occurs during a confirmed "Bearish Trend" when you see a bullish divergence (price makes a lower low, but CVD shows positive delta and a close higher than the open). This indicates the downtrend may be exhausted.
How to Interpret the Visuals
Volume Bars: Colored to match the cluster they belong to.
Background Color: Shows the overall trend (light green for bullish, light red for bearish).
Circle Markers (bottom): Green circles indicate a bullish trend, and red circles indicate a bearish trend.
Triangles and Circles (top): Represent the specific cluster of each bar.
Trend Exhaustion Markers: Triangles above/below the bar signal potential trend exhaustion.
Info Table: An optional table provides a real-time summary of all key metrics for the current bar.
Settings
Volume EMA Length: Adjusts the moving average used for the Volume Z-score calculation.
Z-Score Look Back: Defines the number of bars to use for the volume and CVD percentile calculation.
Lower/Upper Cluster Percentile: Use these to adjust the sensitivity of the clustering. Tighter ranges (e.g., 25/75) capture more data, while wider ranges (e.g., 10/90) will only signal truly extreme events.
Trend Lookback Bars: Controls how many recent bars are considered when determining the trend.
This script offers a comprehensive and easy-to-read way to integrate volume, momentum, and trend analysis into your trading.
Happy Trading!

Trend Analyzer v0.6Trend Analyzer EMA Only v0.6
Simple yet powerful EMA trend analysis with multi-timeframe support!
Overview:
This comprehensive indicator focuses on EMA-based trend analysis with clean visual presentation. It provides clear BUY/SELL signals, trend tracking with unique IDs, peak detection, and multi-timeframe analysis across M15, M30, and H1 timeframes.
Key Features:
✅ EMA Trend Analysis - Fast and Slow EMA crossover signals
✅ Trend Tracking - Unique trend IDs with start/end markers
✅ Peak Detection - Automatic peak identification during trends
✅ Multi-Timeframe - Analysis across M15, M30, and H1 timeframes
✅ Visual Clarity - Dotted lines connecting labels to candles
✅ Statistics - BUY/SELL count and average trend length
How It Works:
The indicator calculates signal strength using weighted analysis:
• MACD (50%) - Primary trend momentum
• RSI (30%) - Overbought/oversold conditions
• Volume (20%) - Volume confirmation
Signal Logic:
• BUY - Fast EMA crosses above Slow EMA + both slopes positive
• SELL - Fast EMA crosses below Slow EMA + both slopes negative
• NEUTRAL - EMAs too close (below threshold)
Visual Elements:
• 🟢 BUY - Green label with trend ID
• 🔴 SELL - Red label with trend ID
• ⚪ NEUTRAL - Gray label with trend ID
• 🟡 PEAK - Yellow label marking trend extremes
• ⚫ END - Gray label marking trend end
Information Table:
Real-time display showing:
• Current Timeframe trend state
• Multi-Timeframe analysis (M15, M30, H1)
• PEAK Labels status
• Offset Type configuration
• Trend Strength percentage
• Statistics (BUY/SELL count, average trend length)
Settings:
• Fast EMA Length - 9 (default)
• Slow EMA Length - 21 (default)
• Min Trend Bars - 3 (filters short trends)
• Label Offset Type - ATR, % of price, or Dynamic
• Show PEAK Labels - On/Off toggle
Best Practices:
🎯 Works best in trending markets
📊 Use as overlay on main chart
⚡ Combine with price action analysis
🛡️ Always use proper risk management
Pro Tips:
• Green background = Strong uptrend, Red background = Strong downtrend
• Watch for trend change arrows for early reversal signals
• Use the information table for quick market assessment
• Monitor trend statistics for market behavior insights
Alerts:
• BUY Alert - "BUY signal detected"
• SELL Alert - "SELL signal detected"
Version 0.6 Improvements:
• Optimized performance
• Enhanced visual clarity
• Improved multi-timeframe analysis
• Refined trend detection algorithms
Created with ❤️ for the trading community
This indicator is free to use for both commercial and non-commercial purposes.