Market Performance TableThe Market Performance Table displays the performance of multiple tickers (up to 5) in a table format. The tickers can be customized by selecting them through the indicator settings.
The indicator calculates various metrics for each ticker, including the 1-day change percentage, whether the price is above the 50, 20, and 10-day simple moving averages (SMA), as well as the relative strength compared to the 10/20 SMA and 20/50 SMA crossovers. It also calculates the price deviation from the 50-day SMA.
The table is displayed on the chart and can be positioned in different locations.
Credits for the idea to @Alex_PrimeTrading ;)
Cerca negli script per "Table"

Harmonic Table Combo Point B█ OVERVIEW
This indicator was intended as educational purpose only and alternative way to show value in table as shown in Harmonic Pattern Possibility Table .
█ CREDITS
Credit to Scott M Carney, Harmonic Trading Volume 3: Reaction vs. Reversal.
█ USAGE EXAMPLE

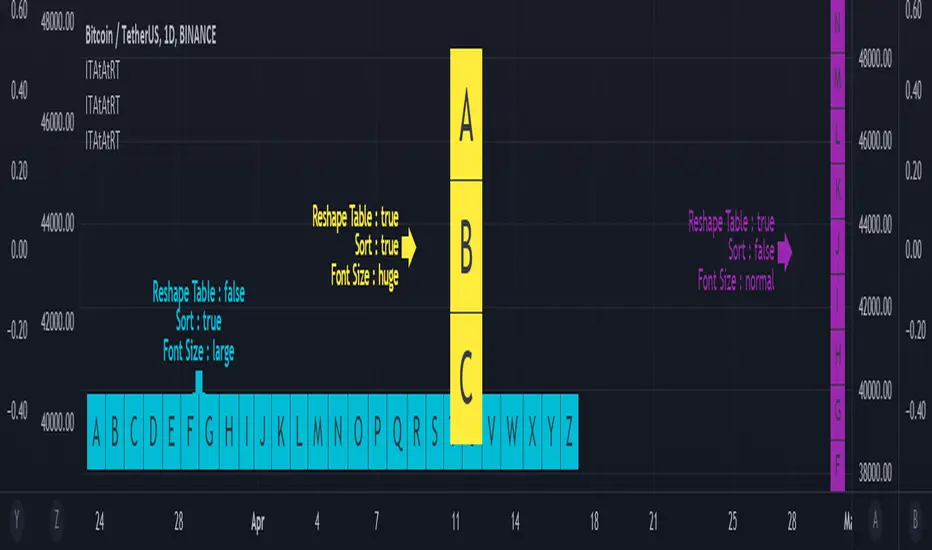
Input Text Area to Array then Reshape Table█ OVERVIEW
Simple method to convert from input.text_area to array using str.split.
Reshape table using switch, not necessary must use matrix.reshape.
Might be useful pine script to replace input.symbol.
█ FEATURES
Table can positioned by any position and font size can be resized.
Reshape table and sorting array if necessary.
█ CREDITS
Credits to TradingView for new update of input.text_area.
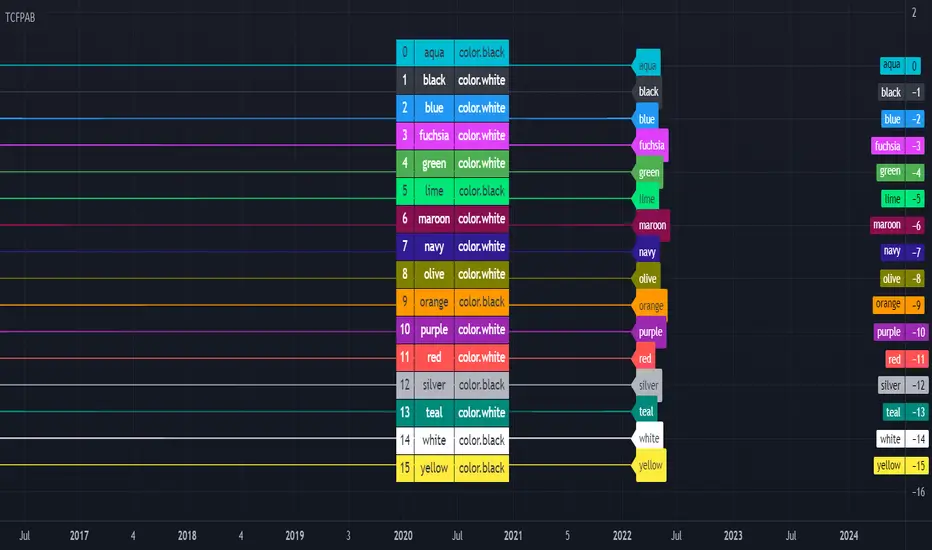
[HELPER] Table Color For Pairing Black And White█ OVERVIEW
This helper intend to simplify which color pair better with black or white color, may help some pine coders.
█ INSPIRATION
This color choice was inspired during plot especially user enable dark color theme.
Color displayed at table and label are based on Indicator name label and Indicator last value label displayed at Scales.
█ FEATURES
Color can be tick to be inverted color.
Display table by changing table position and font size.
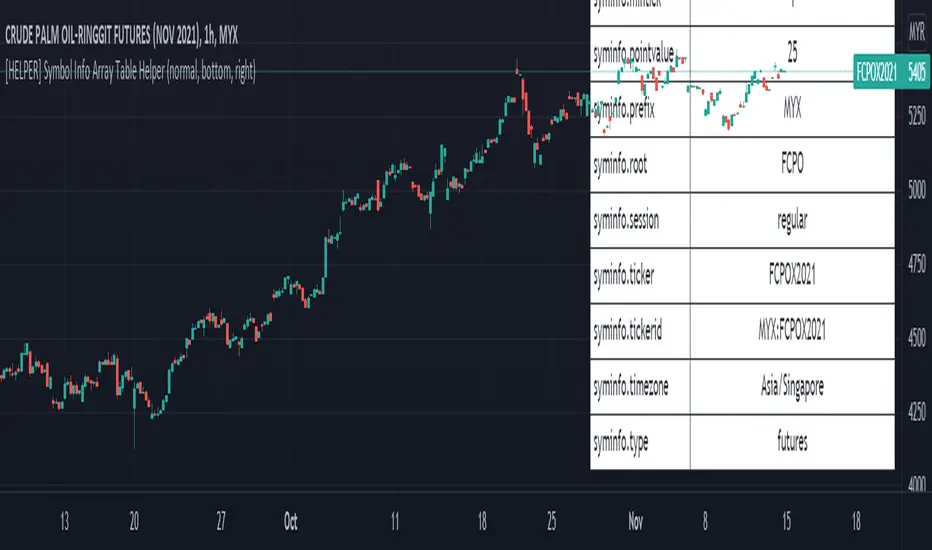
[HELPER] Symbol Info Array Table HelperThis indicator is to show symbol info in table using built-in syminfo name space, coded in latest Pine Script version 5.
Credits to PineCoders and Everget
Features :
- Display table by changing table position, font size and color.
- Show / Hide necessary symbol info.
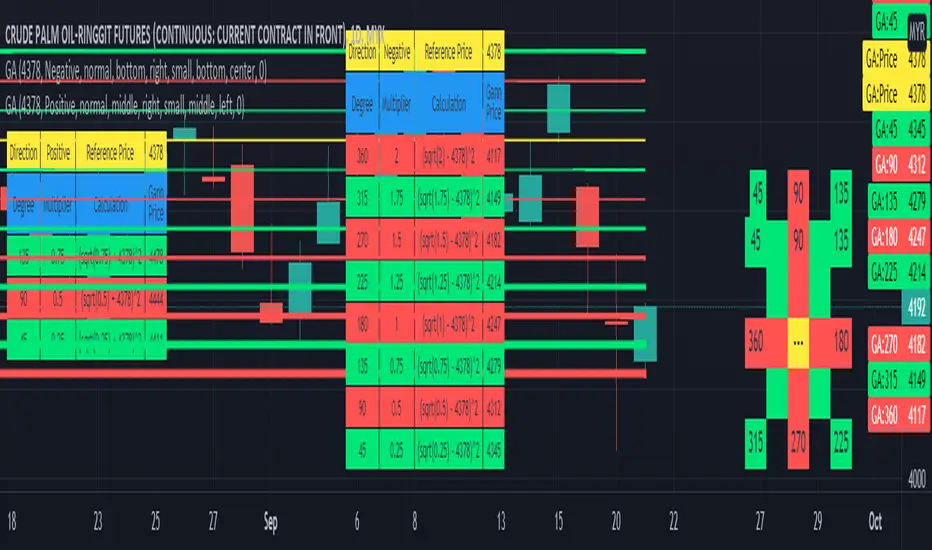
Gann Angle Table Calculator PlotterThis indicator was build upon based on Gann Angle and Gann Multiplier as refered of The Tunnel Thru The Air Or Looking Back From 1940, written by WD Gann .
Credits to FaizHebat for calculation.
Indicator features :
1. Font size from tiny to huge.
2. Table position.
3. Color for cell table and plot can be input or reversed.
4. Plot can be show or hide and also price can be track.
5. Able show currency and decimal price.
6. Gann table and Calculation table can show or hide.
7. Each Gann point can be hide including plot and calculation.
8. For desktop display only, not for mobile.
Pros :
1. Can be used as single or more indicator. (Chart show 2 same indicator with different setup)
Cons :
1. Price must be input before selecting any Gann Point.
FAQ
1. Credits
WD Gann , The Tunnel Thru The Air Or Looking Back From 1940
FaizHebat
2. Code Usage
Free to use for personal usage.
Positive direction with Currency and Decimal
Positive direction with Currency and Decimal
Bias TF TableThis indicator is a technical analysis tool designed to evaluate the price trend of an asset across multiple time frames (5 minutes, 15 minutes, 30 minutes, 1 hour, 4 hours, daily, and weekly).
Main Functions:
Directional Bias: Displays whether the trend is bullish (Up) or bearish (Down) for each time frame, using the closing price in comparison to a 50-period exponential moving average (EMA).
Table Visualization: Presents the results in a table located in the bottom right corner of the chart, making it easy to read and compare trends across different time intervals.
This indicator provides a quick and effective way to assess market direction and make informed trading decisions based on the trend in various time frames.

Harmonic Pattern Possibility Table█ OVERVIEW
This indicator was intended as educational purpose only based on Harmonic Pattern Table (Source Code) and Ratio For Harmonic Points to show Harmonic Pattern Possibility.
█ INSPIRATION
This indicator was build upon realizing there are some overlap for B = XA among Alternate Bat, Bat, Crab and Gartley.
Hence, the values split up to showcase the possibility of non overlap ratio.
█ USAGE
Possible pattern, priority pattern and selected pattern may differs based value input.
Therefore C = AB, D = BC, D = XA and Stop Loss will change based value input and also selected pattern.
█ CREDITS
Credit to Scott M Carney, Harmonic Trading Volume 3: Reaction vs. Reversal.

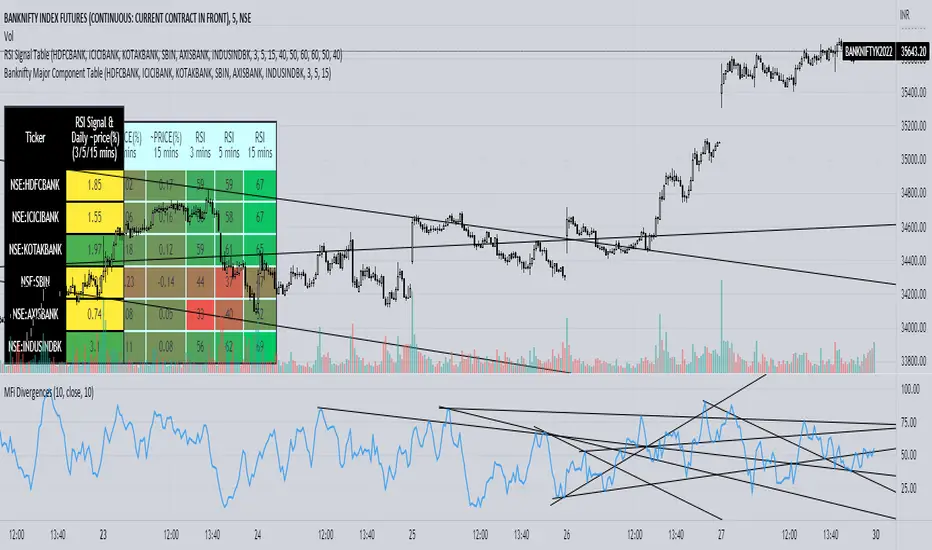
Banknifty Major Component TableThe table presented here is comprised of major Banknifty Index constituents showing price change in percentage terms and RSI value of three different timeframes to gauge overall Banknifty sentiment. This table is primarily created to cater scalpers and day traders. It helps traders to see market activity at a glance.
Position Sizing TableThe Position Sizing Table is a simple, clean table designed to calculate shares per trade based on total capital.

Harmonic Pattern Table (Source Code)This table indicator was intended as helper / reference for using XABCD Pattern.
Indikator berjadual bertujuan sebagai bantuan / rujukan untuk kegunaan XABCD Pattern.
The values shown in table was based on Harmonic Trading Volume 3: Reaction vs. Reversal written by Scott M Carney.
Nilai yang ditunjukkan dalam jadual adalah berdasarkan buku Harmonic Trading Volume 3: Reaction vs. Reversal ditulis oleh Scott M Carney.
Indicator features :
1. List Harmonic Patterns.
2. Font size small for mobile app and font size normal for desktop.
Kemampuan indikator :
1. Senarai Harmonic Pattern.
2. Saiz font kecil untuk mobile app dan saiz size normal untuk desktop.
FAQ
1. Credits / Kredit
Scott M Carney,
Scott M Carney, Trading Volume 3: Reaction vs. Reversal
2. Code Usage / Penggunaan Kod
Free to use for personal usage but credits are most welcomed especially for credits to Scott M Carney.
Bebas untuk kegunaan peribadi tetapi kredit adalah amat dialu-alukan terutamanya kredit kepada Scott M Carney.
Default Settings.
Setting asal.
Setting for selected Harmonic Pattern (Example : Bat)
Setting untuk pilihan Harmonic Pattern (Contoh : Bat)
Setting for show Harmonic Pattern only (Example : Bat)
Setting untuk nama Harmonic Pattern sahaja(Contoh : Bat)

MYX Bursa IPO Listing Table (Source Code)This indicator intended for Malaysia Market only for Initial Public Offering (IPO) refer to Bursa Malaysia
Indikator ini adalah untuk pasaran Malaysia sahaja untuk Tawaran Awam Permulaan (IPO) rujuk kepada Bursa Malaysia
Indicator features :
1. List similar symbol or counter based on year including total.
2. Font size small for mobile app and font size normal for desktop.
Kemampuan indikator :
1. Senarai simbol atau kaunter yang terlibat mengiku tahun termasuk jumlah.
2. Saiz font kecil untuk mobile app dan saiz size normal untuk desktop.
FAQ
1. Code Usage / Penggunaan Kod
Free to use for personal usage but credits are most welcomed.
Not for business / commercial usage, any damage or lialibity are not my resposibility.
Bebas untuk kegunaan peribadi tetapi kredit adalah amat dialu-alukan.
Bukan untuk kegunaan perniagaan / komersil, sebarang kerosakan atau liability adalah di luar tanggungjawab saya.
2. Update Frequency / Frekuensi
Anytime after official update by Bursa Malaysia.
Bila-bila masa selepas kemaskini rasmi oleh Bursa Malaysia
3. Symbol/Counter not showing / Simbol/kaunter tiada
Symbol/counter not longer exist or not yet updated.
Simbol/kaunter telah tersenarai keluar atau belum dikemaskini.
4. Why table overlap with chart ? To avoid this, click indicator > Visual Order > Send to Front.
Kenapa table bertindih dengan carta ? Untuk mengatasi ini, klik indikator > Visual Order > Send to Front.
All Setting enabled.
Semua seting diaktifkan.
Small Font setting enabled, suitable for mobile app.
Setting font kecil diaktifkan., sesuai untuk mobile app.
Setting by year.
Setting mengikut tahun.

Futures Margin Lookup TableThis script applies a table to your chart, which provides the intraday and overnight margin requirements of the currently selected symbol.
In this indicator the user must provide the broker data in the form of specifically formatted text blocks. The data for which should be found on the broker website under futures margin requirements.
The purpose for it's creation is due to the non-standard way each individual broker may price their margins and lack of information within TradingView when connected to some (maybe all) brokers, including during paper trading, as the flat percentage rule is not accurate.
An example of information could look like this
MES;Micro S&P;$50;$2406
ES;E-Mini S&P;$500;$24,053
GC;Gold;$500;$16500
NQ;E-Mini Nasdaq;$1,000;$34,810
FDAX;Dax Index;€2,000;€44,311
Each symbol begins a new line, and the values on that line are separated by semicolons (;)
Each line consists of the following...
SYMBOL : Search string used to match to the beginning of the current chart symbol.
NAME: Human readable name
INTRA: Intraday trading margin requirement per contract
OVERNIGHT: Overnight trading margin requirement per contract
The script simply finds a matching line within your provided information using the current chart symbol.
So for example the continuous chart for
NQ1!
would match to the user specified line starting with NQ... as would the individual contract dates such as NQM2025, NQK2025, etc.
NOTES:
There is a possibility that symbols with similar starting characters could match. If this is the case put the longer symbol higher in the list.
There is also a line / character limit to the text input fields within pinescript. Ensure the text you enter / paste into them is not truncated. If so there are 3 input fields for just this purpose. Find the last complete line and continue the remaining symbol lines on the subsequent inputs.

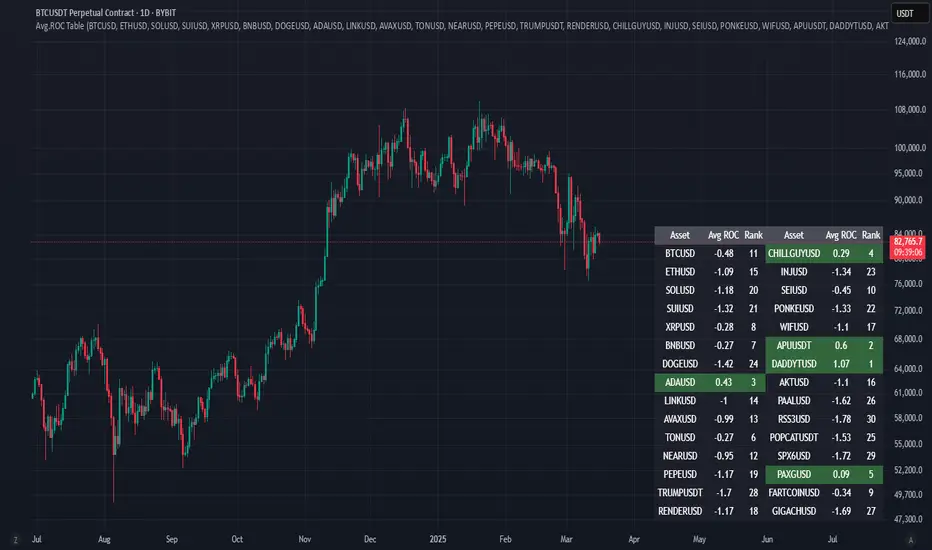
Avg.ROC TableThis indicator calculates the average Rate of Change (ROC) for up to 30 user-selected assets over a specified number of candles. It then ranks the assets—assigning rank 1 to the asset with the highest average ROC (strongest momentum) and rank 30 to the asset with the lowest. The results are displayed in a clean, easy-to-read table split into two stacks of 15 assets each, allowing you to quickly see which assets are performing best.
ADR Table BY @ICT_YEROADR Table BY @ICT_YERO
Created by: @ICT_YERO
This custom indicator is designed to provide the Average Daily Range (ADR) for multiple timeframes, including Daily, 4-Hour, and 1-Hour. The indicator is tailored to assist traders in understanding price volatility and making informed trading decisions.
Key Features
Multi-Timeframe ADR Calculation:
Automatically calculates and displays the ADR for Daily, 4-Hour, and 1-Hour timeframes.
Helps traders identify potential price movement ranges for different trading sessions.
Dynamic Range Visualization:
Clear visual representation of the ADR on the chart, making it easy to spot price extremes.
Real-time updates to reflect changes in price movement.
Custom Alerts:
Option to set alerts when the price approaches the ADR high or low.
Useful for identifying potential reversal zones or breakout opportunities.
User-Friendly Interface:
Simple and intuitive settings to customize colors, levels, and display preferences.
Seamlessly integrates with your existing TradingView setup.
ICT-Inspired Methodology:
Designed for traders who follow ICT concepts, focusing on precision and high-probability setups.
Applications
Range Trading: Helps determine the high and low boundaries for scalping or intraday setups.
Volatility Analysis: Understand market behavior during different times of the day or week.
Reversal Zones: Identify areas where price is likely to reverse, based on ADR extremes.
Whether you're a scalper, day trader, or swing trader, this indicator provides a comprehensive overview of price volatility across multiple timeframes, making it an essential tool for your trading arsenal.

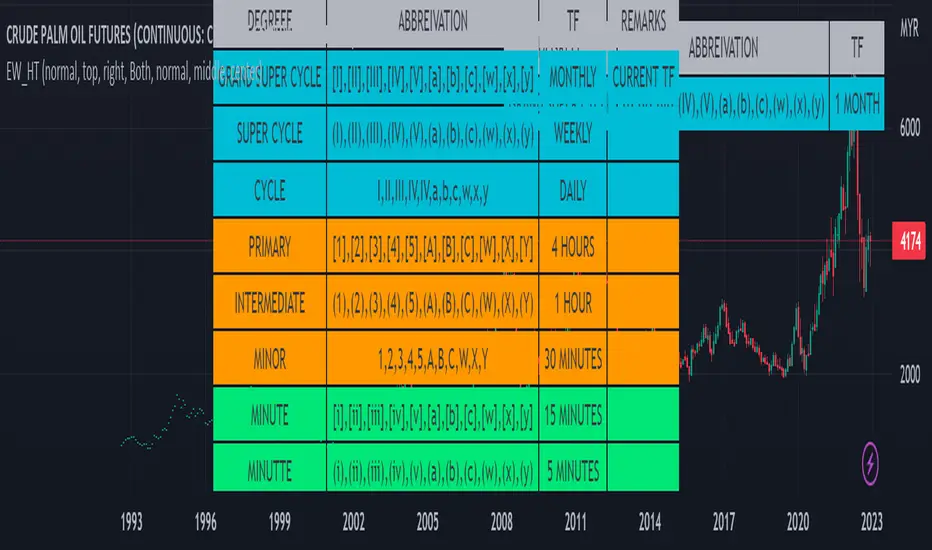
Elliot Wave Helper Table█ OVERVIEW
This indicator is intend to be helper to help Elliot Wave user to properly Elliot Wave tools according to correct degree such as 12345 or ABCWXY. The abbreviation changes according to timeframe.
█ FEATURES
1. Abbreviation degree adaptive to timeframe. Eg : Subminutte for 1 minute chart, etc.
2. Works for custom timeframe. Eg : Subminutte for 1 to 4 minute chart, etc.
3. Show reference table if necessary.
█ REFERENCE
Adaptive Elliot Wave Degree Chart
█ EXAMPLES / USAGES
Coin & market cap tableThis table was built specifically for the Crypto market.
It gives you a quick overview of the markets without having to scroll through numerous charts. The information is the overall markets daily change and the charts coins movement on a daily, weekly and monthly basis.
The weeks start on a Monday morning, the months start on the 1st of the month so this is last weeks data and last calendar months data.
It also gives you Bitcoins dominance. (Total2) you can change it to Bitcoin & Ethereum dominance (Total3)

Correlation with Matrix TableCorrelation coefficient is a measure of the strength of the relationship between two values. It can be useful for market analysis, cryptocurrencies, forex and much more.
Since it "describes the degree to which two series tend to deviate from their moving average values" (1), first of all you have to set the length of these moving averages. You can also retrieve the values from another timeframe, and choose whether or not to ignore the gaps.
After selecting the reference ticker, which is not dependent from the chart you are on, you can choose up to eight other tickers to relate to it. The provided matrix table will then give you a deeper insight through all of the correlations between the chosen symbols.
Correlation values are scored on a scale from 1 to -1
A value of 1 means the correlation between the values is perfect.
A value of 0 means that there is no correlation at all.
A value of -1 indicates that the correlation is perfectly opposite.
For a better view at a glance, eight level colors are available and it is possible to modify them at will. You can even change level ranges by setting their threshold values. The background color of the matrix's cells will change accordingly to all of these choices.
The default threshold values, commonly used in statistics, are as follows:
None to weak correlation: 0 - 0.3
Weak to moderate correlation: 0.3 - 0.5
Moderate to high correlation: 0.5 - 0.7
High to perfect correlation: 0.7 - 1
Remember to be careful about spurious correlations, which are strong correlations without a real causal relationship.
(1) www.tradingview.com

SST Table NewData Table for Update GTT Orders in Stocks....
Updated GTT Order details for SST , also added Relative Strength of Stock compared with NIFTY Index for 55 Days (3 Months) period.
RS line plotted on chart… taken reference of close price of day candle… just a bigger picture of actual RS indicator plotted on chart itself... RS line in red color means below zero line (negative) and green color means above zero line (positive).
Added code for checking RS value on chart for any previous day.

US Stock Market Sectors Overview Table [By MUQWISHI]US Market Overview Table will identify the bullish and bearish sectors of a day by tracking the SPDR sectors funds.
It's possible to add a ticker symbol for correlation compared to each sector.
Overview Indicator

Valuation TableHey folks, I hope you are all doing well!
This is an indicator that you can use to help you to evaluate companies. There are a few things I added to the valuation table that I personally use and I will explain what they are.
I added Joel Greenblatt's ROC% because it takes Earnings before Interest and Taxes to reflect more closely what the company earns from its operations, while including the cost of depreciation/amortization of assets. A high double digit figure often means that the company has a defensible edge versus its competitors (e.g. a strong brand or a unique product). It's good for relative valuation (comparing two companies in the same industry).
I also added Donald Yacktman's forward rate of return. Yacktman defines forward rate of return as the normalized free cash flow yield plus real growth plus inflation . Unlike the Earnings Yield %, the Forward Rate of Return uses the normalized Free Cash Flow of the past seven years, and considers growth. The forward rate of return can be thought of as the return that investors buying the stock today can expect from it in the future. Yacktman’s Forward Rate of Return may or may not be a useful metric. However, it does present new ways to see and think about stocks we may want to buy.
I added a box called "real price" and that is from Peter Lynch's book, "One Up on Wall Street," where he talked about how the real price of the stock is really the current price - Net Cash Per Share.
I would also personally pair this script with TradingView's built in financial indicators that shows the revenue growth, net income, etc.
Note: the script only works on the weekly timeframe and it will take some time to load because it has a lot of data.

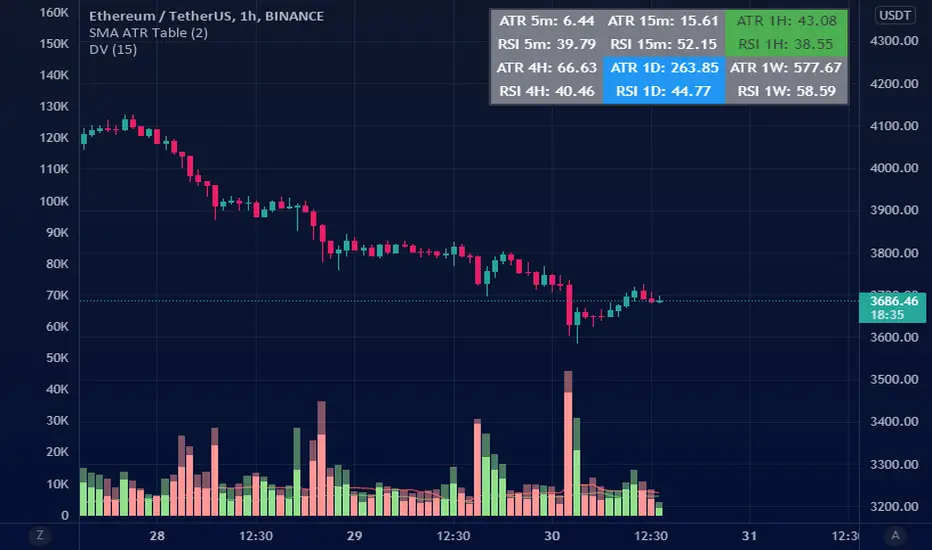
ATR Table (SMA)ATR table for select time frames.
Using Simple Moving Average (SMA) to get ATR.
MA periods is based on numbers suggested by Saeed Khakestar (Trigger Price Action)
You can change them in code
5m => 12
15m => 16
1H => 24
4H => 42
1D => 30
1W => 52
RSI is calculated the same way
Price Range TableThe table shows the ranking of the price as a percentage relative to the past candles.
100 ~ highest price of the time frame
0 ~ lowest price of the time frame
