Volatility Adjusted Weighted DEMA [BackQuant]Volatility Adjusted Weighted DEMA
The Volatility Adjusted Weighted Double Exponential Moving Average (VAWDEMA) by BackQuant is a sophisticated technical analysis tool designed for traders seeking to integrate volatility into their moving average calculations. This innovative indicator adjusts the weighting of the Double Exponential Moving Average (DEMA) according to recent volatility levels, offering a more dynamic and responsive measure of market trends.
Primarily, the single Moving average is very noisy, but can be used in the context of strategy development, where as the crossover, is best used in the context of defining a trading zone/ macro uptrend on higher timeframes.
Why Volatility Adjustment is Beneficial
Volatility is a fundamental aspect of financial markets, reflecting the intensity of price changes. A volatility adjustment in moving averages is beneficial because it allows the indicator to adapt more quickly during periods of high volatility, providing signals that are more aligned with the current market conditions. This makes the VAWDEMA a versatile tool for identifying trend strength and potential reversal points in more volatile markets.
Understanding DEMA and Its Advantages
DEMA is an indicator that aims to reduce the lag associated with traditional moving averages by applying a double smoothing process. The primary benefit of DEMA is its sensitivity and quicker response to price changes, making it an excellent tool for trend following and momentum trading. Incorporating DEMA into your analysis can help capture trends earlier than with simple moving averages.
The Power of Combining Volatility Adjustment with DEMA
By adjusting the weight of the DEMA based on volatility, the VAWDEMA becomes a powerful hybrid indicator. This combination leverages the quick responsiveness of DEMA while dynamically adjusting its sensitivity based on current market volatility. This results in a moving average that is both swift and adaptive, capable of providing more relevant signals for entering and exiting trades.
Core Logic Behind VAWDEMA
The core logic of the VAWDEMA involves calculating the DEMA for a specified period and then adjusting its weighting based on a volatility measure, such as the average true range (ATR) or standard deviation of price changes. This results in a weighted DEMA that reflects both the direction and the volatility of the market, offering insights into potential trend continuations or reversals.
Utilizing the Crossover in a Trading System
The VAWDEMA crossover occurs when two VAWDEMAs of different lengths cross, signaling potential bullish or bearish market conditions. In a trading system, a crossover can be used as a trigger for entry or exit points:
Bullish Signal: When a shorter-period VAWDEMA crosses above a longer-period VAWDEMA, it may indicate an uptrend, suggesting a potential entry point for a long position.
Bearish Signal: Conversely, when a shorter-period VAWDEMA crosses below a longer-period VAWDEMA, it might signal a downtrend, indicating a possible exit point or a short entry.
Incorporating VAWDEMA crossovers into a trading strategy can enhance decision-making by providing timely and adaptive signals that account for both trend direction and market volatility. Traders should combine these signals with other forms of analysis and risk management techniques to develop a well-rounded trading strategy.
Alert Conditions For Trading
alertcondition(vwdema>vwdema , title="VWDEMA Long", message="VWDEMA Long - {{ticker}} - {{interval}}")
alertcondition(vwdema
Cerca negli script per "Volatility"

Volatility Exponential Moving AverageVEMA is a custom indicator that enhances the traditional moving average by incorporating market volatility. Unlike standard moving averages that rely solely on price, VEMA integrates both the Simple Moving Average (SMA) and the Exponential Moving Average (EMA) of the closing price, alongside a measure of market volatility.
The unique aspect of VEMA is its approach. It calculates the standard deviation of the closing price and also computes the simple moving average of this volatility. This dual approach to understanding market fluctuations allows for a more nuanced understanding of market dynamics.
Key to VEMA's functionality is the dynamic weighting factor, which adjusts the influence of SMA and EMA based on current market volatility. This factor increases the weight of the EMA, which is more responsive to recent price changes, during periods of high volatility. Conversely, during periods of lower volatility, the SMA, which offers a smoother view of price trends, becomes more prominent.
The resultant is a hybrid moving average that responds adaptively to changes in market volatility. This adaptability makes VEMA particularly useful in dynamic markets, potentially offering more insightful trend analysis and reversal signals compared to traditional moving averages.

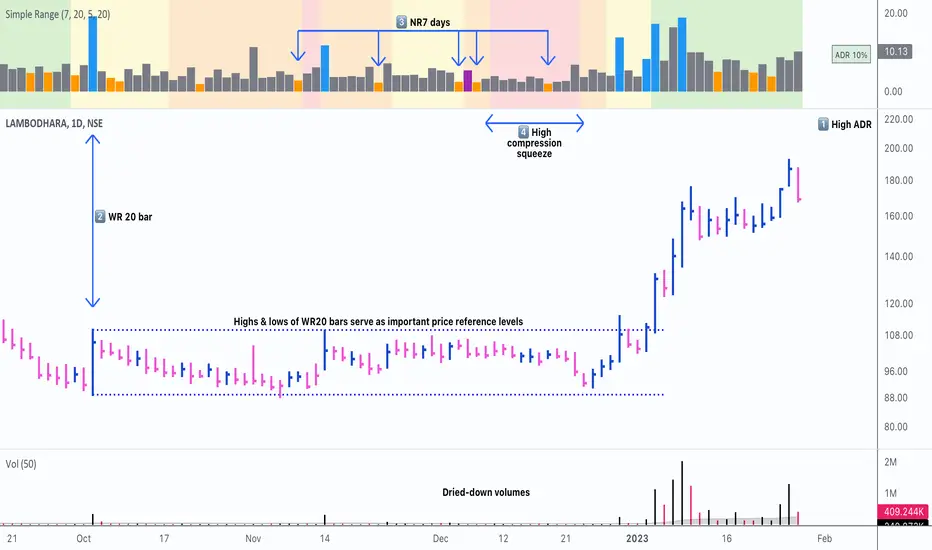
Simple RangeThe daily price range is a good proxy to judge an instrument’s volatility. I have combined multiple concepts in this indicator to display information regarding the daily price range & its volatility.
A trading period's range is simply the difference between its high and the low. This script shows the daily high-to-low range of the price as a column chart. It has 3 main components:
1. Narrow-range days (NR7) & Wide-range Days (WR20) - as plot columns
Original concept from Thomas Bulkowski
Modified from "NR4 & NR7 Indicator" script by theapextrader7
Modified from "WR - BC Identifier" script by wrpteam2020
Narrow range days mark price contractions that often precede price expansions. This script uses NR7 (narrow range 7) as a narrow-range day. This value can be changed by the user if, instead of an NR7, he or she wishes to use NR4 or NR21, or any other interval of his or her choice. NR7 is an indecisive trading day in which the range is narrower than any of the previous six days (a total of 7 days). This is a popular concept given by Thomas Bulkowski. A breakout is said to occur when price closes above the top or below the bottom of the NR7. Upside breakout of an NR 7 candle with high volumes indicates bullishness.
Similarly, highs & lows of wide-range bars (on big volumes) are also significant reference levels for price. Wide-range candle are identified by size of the body candle (open - close). The script compares the size of previous 20 candles to identify WR20 candles. This value can also be changed by the user.
The script shows NR7 & WR20 as orange & blue bars, respectively.
The user can also turn on the option to identify a big high-to-low range candle greater than a pre-defined threshold (default is 5%). These show up as green or red bars.
2. TTM Squeeze - as background
Original concept from John Carter's book "Mastering the Trade"
Based on "Squeeze Momentum Indicator" script by LazyBear
John Carter’s TTM Squeeze indicator looks at the relationship between Bollinger Bands and Keltner's Channels to help identify period of volatility contractions. Bollinger Bands being completely enclosed within the Keltner Channels is indicative of a very low volatility. This is a state of volatility contraction known as squeeze. Using different ATR lengths (1.0, 1.5 and 2.0) for Keltner Channels, we can differentiate between levels of squeeze (High, Mid & Low compression, respectively). Greater the compression, higher the potential for explosive moves.
In the script, the High, Mid & Low compression squeezes are depicted via the background color being red, orange, or yellow, respectively.
3. Average Daily Range - as table
Original idea by alpine_trader
Modified from "ADR% - Average Daily Range % by MikeC" script by TheScrutiniser
Average Day Range (ADR) tells how much the price moves between the high and low on a given day. This is the day Range, which is then averaged to create ADR. The script uses an average of the last 20 days to calculate the ADR. Unlike ATR (Average True Range), this excludes Gaps.
The script displays the ADR as a % value in a table.
If you want to find stocks that move a lot on an average on most days, then look for stocks that have ADR% of 5% or more.
If you prefer lower volatility stocks, focus on stocks with lower ADR% values, such as 2% or less.
How it comes together
For a bullish "momentum burst", or a velocity trade:
Select stocks with Average Day Range % (ADR) greater than 5
Identify significant reference price levels via highs & lows of WR20 bars (on big volumes)
Wait for a decent mid-to-high compression squeeze
Look for clusters of NR7 candles in the consolidation
Any breakout from this consolidation should be accompanied by more than average (preferably pocket pivot) volumes
0_dteUSAGE
This script guages the probability of an underlying moving a certain amount on expiration day, to aid the popular "0 dte" strategy. The script counts how many next-day moves exceeded a given magnitude in the past, under similar conditions. The inputs are:
mark_mode:
- "open": measures the magnitude as "open to close"--a true 0 dte.
- "previous close": for lazy people who don't want to wake up early. measures magnitude from the previous day's close.
move_mode:
- "percent": measures moves that exceed a given percentage.
- "absolute": measures moves that exceed a point value.
move-dir: measure only up moves, down moves, or both.
vol_model: the model for realized volatility. (may add more later).
min_vol: only measure moves when realized vol is above this value.
max_vol: only measure moves when realized vol is below this value.
precision: number of digits printed in the output table.
EXAMPLE:
- mark_mode: "previous close"
- move_mode: "percent"
- move_dir: "up"
- move_mag: 0.07
- vol_model: hv30
- min_vol: 0.2
- max_vol: 0.5
These settings will count the number of trading days that closed 7% higher than the previous day's close, when the previous day's realized volatility (annualized) was between 20% and 50%. The outputs are:
- current vol: green plot. Today's realized vol. Shown for convenience.
- max and min vol: red plots. Also shown for convenience.
- count: the number of days that exceeded the chosen magnitude, when the previous day's realized volatility was within the chosen bounds.
- total: the total number of days where realized volatility was within the chosen bounds
- probability: count / total. the percentage of days that exceeded the move when volatility was within the bounds.
- move: plotted as a purple line. purple "X" labels are plotted above
- bars where the move exceeded the magnitude threshold and volatility was in-bounds. a "hit".
CONCLUSION
This script is based on the idea that realized volatility has some bearing on future volatility. By seeing what happened in the past when volatility was close to its current value, we may be able to assess the probability that our short put will be in the money, tomorrow, and our account devastated.
NOTE: Unlike many of my other scripts, all percentages--both inputs and outputs--are given in fractional form. E.g., 0.01 means 1%.

ADR(20)% - Qullamagi (corner value) v6This indicator displays the 20-bar Average Daily Range (ADR) either as a percentage of price or in raw dollar terms, shown in a clean corner box on the chart.
Switch between % ADR and $ ADR with a single checkbox.
Place the output box in any chart corner.
Useful for volatility assessment, stop-loss sizing, and stock selection.
Inspired by the trading approach of Kristjan Qullamägi (Qullamaggie), who uses ADR(20) both to filter high-momentum stocks and to size risk (stops should generally be ≤ 1×ADR).

Frahm Factor Position Size CalculatorThe Frahm Factor Position Size Calculator is a powerful evolution of the original Frahm Factor script, leveraging its volatility analysis to dynamically adjust trading risk. This Pine Script for TradingView uses the Frahm Factor’s volatility score (1-10) to set risk percentages (1.75% to 5%) for both Margin-Based and Equity-Based position sizing. A compact table on the main chart displays Risk per Trade, Frahm Factor, and Average Candle Size, making it an essential tool for traders aligning risk with market conditions.
Calculates a volatility score (1-10) using true range percentile rank over a customizable look-back window (default 24 hours).
Dynamically sets risk percentage based on volatility:
Low volatility (score ≤ 3): 5% risk for bolder trades.
High volatility (score ≥ 8): 1.75% risk for caution.
Medium volatility (score 4-7): Smoothly interpolated (e.g., 4 → 4.3%, 5 → 3.6%).
Adjustable sensitivity via Frahm Scale Multiplier (default 9) for tailored volatility response.
Position Sizing:
Margin-Based: Risk as a percentage of total margin (e.g., $175 for 1.75% of $10,000 at high volatility).
Equity-Based: Risk as a percentage of (equity - minimum balance) (e.g., $175 for 1.75% of ($15,000 - $5,000)).
Compact 1-3 row table shows:
Risk per Trade with Frahm score (e.g., “$175.00 (Frahm: 8)”).
Frahm Factor (e.g., “Frahm Factor: 8”).
Average Candle Size (e.g., “Avg Candle: 50 t”).
Toggles to show/hide Frahm Factor and Average Candle Size rows, with no empty backgrounds.
Four sizes: XL (18x7, large text), L (13x6, normal), M (9x5, small, default), S (8x4, tiny).
Repositionable (9 positions, default: top-right).
Customizable cell color, text color, and transparency.
Set Frahm Factor:
Frahm Window (hrs): Pick how far back to measure volatility (e.g., 24 hours). Shorter for fast markets, longer for chill ones.
Frahm Scale Multiplier: Set sensitivity (1-10, default 9). Higher makes the score jumpier; lower smooths it out.
Set Margin-Based:
Total Margin: Enter your account balance (e.g., $10,000). Risk auto-adjusts via Frahm Factor.
Set Equity-Based:
Total Equity: Enter your total account balance (e.g., $15,000).
Minimum Balance: Set to the lowest your account can go before liquidation (e.g., $5,000). Risk is based on the difference, auto-adjusted by Frahm Factor.
Customize Display:
Calculation Method: Pick Margin-Based or Equity-Based.
Table Position: Choose where the table sits (e.g., top_right).
Table Size: Select XL, L, M, or S (default M, small text).
Table Cell Color: Set background color (default blue).
Table Text Color: Set text color (default white).
Table Cell Transparency: Adjust transparency (0 = solid, 100 = invisible, default 80).
Show Frahm Factor & Show Avg Candle Size: Check to show these rows, uncheck to hide (default on).

OA - Sigma BandsDescription:
The OA - Sigma Bands indicator is a fully adaptive, volatility-sensitive dynamic band system designed to detect price expansion and potential breakouts. Unlike traditional fixed-width Bollinger Bands, OA - Sigma Bands adjust their boundaries based on a combination of standard deviation (σ) and Average Daily Range (ADR), making them more responsive to real market behavior and shifts in volatility.
Key Concepts & Logic
This tool constructs three distinct band regions:
Sigma Bands (±σ):
Calculated using the standard deviation of the closing price over a user-defined lookback period. This acts as the core volatility filter to identify statistically significant price deviations.
ADR Zones (±ADR):
These zones provide an additional layer based on the percentage average of daily price ranges over the last 20 bars. They help visualize intraday or short-term expected volatility.
Dynamic Adjustment Logic:
When price breaks outside the upper/lower sigma or ADR boundaries for a defined number of bars (user input), the system recalibrates. This ensures that the bands evolve with volatility and don’t remain outdated in trending markets.
Inputs & Customization
Sigma Multiplier: Set how wide the sigma bands should be (default: 1.5).
Lookback Period: Controls how many bars are used to calculate the standard deviation (default: 200).
Break Confirmation Bars: Determines how many candles must close beyond a boundary to trigger band recalibration.
ADR Period: Internally fixed at 20 bars for stable short-term volatility measurement.
Full Color Customization: Customize the band colors and fill transparency to suit your chart style.
Benefits & Use Cases
Breakout Trading: Detect when price exits statistically significant ranges, confirming trend expansion.
Mean Reversion: Use the outer bands as potential reversion zones in sideways or low-volatility markets.
Volatility Awareness: Visually identify when price is compressed or expanding.
Dynamic Structure: The auto-updating nature makes it more reliable than static historical zones.
Overlay-Ready: Designed to sit directly on price charts with minimal clutter.
Disclaimer
This script is intended for educational and informational purposes only. It does not constitute investment advice, financial guidance, or a recommendation to buy or sell any security. Always perform your own research and apply proper risk management before making trading decisions.
If you enjoy this script or find it useful, feel free to give it or leave a comment!

Harmony in Havoc - The Entropy of VoVix Harmony in Havoc – The Entropy of VoVix
There are moments in the market when chaos and order are not opposites, but partners in a dance.
Harmony in Havoc is not just an indicator—it’s a window into that dance.
Most tools try to tame the market by smoothing it, boxing it in, or chasing after what’s already happened. This script does the opposite: it listens for the music beneath the noise, the rare moments when volatility and unpredictability align, and the market’s next movement is about to begin.
What is Harmony in Havoc?
VoVix Spike:
The pulse of volatility-of-volatility. Not just how much the market is moving, but how violently its own heartbeat is changing.
Entropy:
A real-time measure of surprise. When entropy is high, the market is not just moving—it’s breaking its own patterns, rewriting its own rules.
Progression Bar & Status:
The yellow bar is your visual gauge of tension. As it fills, the market is winding up.
Wait: The world is calm.
Get ready!: The storm is building.
Take Action!!: The probability of a regime eruption is at its peak.
Yellow Background:
When the background glows, the market is at its most unstable—this is not a buy or sell signal, but a quant alert.
How does it work?
Every tick, Harmony in Havoc measures the distance between the market’s current volatility and its own unpredictability. When the VoVix spike approaches or exceeds the entropy threshold, the system knows:
“This is the moment when the improbable becomes possible.”
Why is this different?
It doesn’t tell you what to do.
It doesn’t chase price.
It doesn’t care about trends, bands, or the past.
Instead, it gives you a quantitative sense of anticipation—a way to see when the market is most likely to break from its own history, and when the edge is at its sharpest.
How to use it:
Watch for the yellow background and “Take Action!!” status.
Use it as a regime filter, a volatility dashboard, or a warning system for your own strategies.
Tune the inputs for your asset and timeframe—make it your own.
Inputs—explained for you:
VoVix Fast/Slow ATR & Stdev:
Control how sensitive the system is to volatility shocks. Lower = more signals, higher = only the rarest events.
Entropy Window & Bins:
Control how “surprised” the entropy engine is by current volatility. Shorter window = more responsive, more bins = finer detail.
Show/Hide Controls:
Toggle the VoVix spike, entropy line, and their glows to customize your visual experience.
Bottom line:
This is not a buy or sell script.
This is a quant regime detector for those who want to feel the market’s tension—to sense when harmony and havoc are about to collide.
Disclaimer:
Trading is risky. This script is for research and informational purposes only, not financial advice. Backtest, paper trade, and know your risk before going live. Past performance is not a guarantee of future results.
*I've only tested this on 1 and 5 min frames.
Use with discipline. Trade your edge.
— Dskyz, for DAFE Trading Systems
3 days ago
Release Notes
* Now mobile friendly. I've added a toggle to switch the dashboard on/off, and added a mobile information line that shows the same information on the dashboard. This is to allow the script to stay visually in balance and this also has a toggle.
* Background color added that coresponds with Buy or Sell areas.

ConeCastConeCast is a forward-looking projection indicator that visualizes a future price range (or "cone") based on recent trend momentum and adaptive volatility. Unlike lagging bands or reactive channels, this tool plots a predictive zone 3–50 bars ahead, allowing traders to anticipate potential price behavior rather than merely react to it.
How It Works
The core of ConeCast is a dynamic trend-slope engine derived from a Linear Regression line fitted over a user-defined lookback window. The slope of this trend is projected forward, and the cone’s width adapts based on real-time market volatility. In calm markets, the cone is narrow and focused. In volatile regimes, it expands proportionally, using an ATR-based % of price to scale.
Key Features
📈 Predictive Cone Zone: Visualizes a forward range using trend slope × volatility width.
🔄 Auto-Adaptive Volatility Scaling: Expands or contracts based on market quiet/chaotic states.
📊 Regime Detection: Identifies Bull, Bear, or Neutral states using a tunable slope threshold.
🧭 Multi-Timeframe Compatible: Slope and volatility can be calculated from higher timeframes.
🔔 Smart Alerts: Detects price entering the cone, and signals trend regime changes in real time.
🖼️ Clean Visual Output: Optionally includes outer cones, trend-trail marker, and dashboard label.
How to Use It
Use on 15m–4H charts for best forward visibility.
Look for price entering the cone as a potential trend continuation setup.
Monitor regime changes and volatility expansion to filter choppy market zones.
Tune the slope sensitivity and ATR multiplier to match your symbol's behavior.
Use outer cones to anticipate aggressive swings and wick traps.
What Makes It Unique
ConeCast doesn’t follow price — it predicts a possible future price envelope using trend + volatility math, without relying on lagging indicators or repainting logic. It's a hybrid of regression-based forecasting and dynamic risk zoning, designed for swing traders, scalpers, and algo developers alike.
Limitations
ConeCast projects based on current trend and volatility — it does not "know" future price. Like all projection tools, accuracy depends on trend persistence and market conditions. Use this in combination with confirmation signals and risk management.

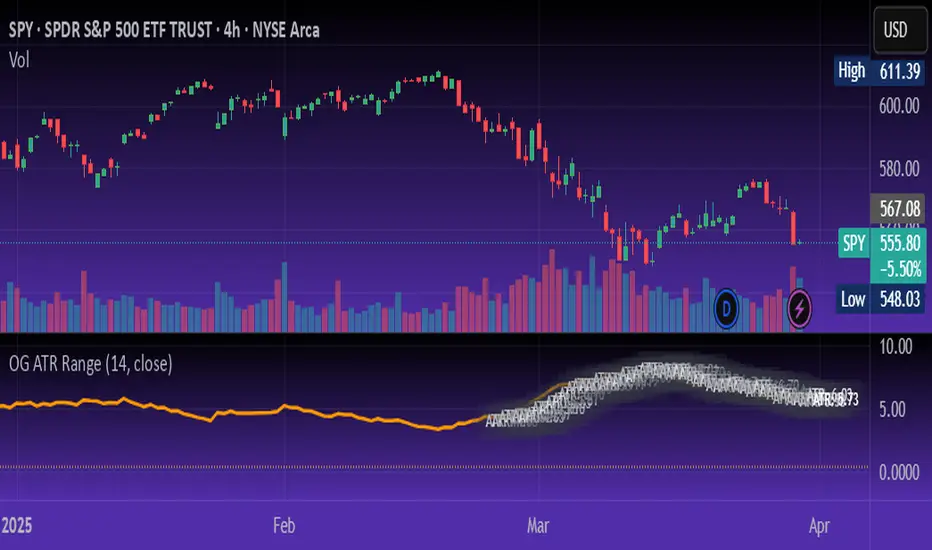
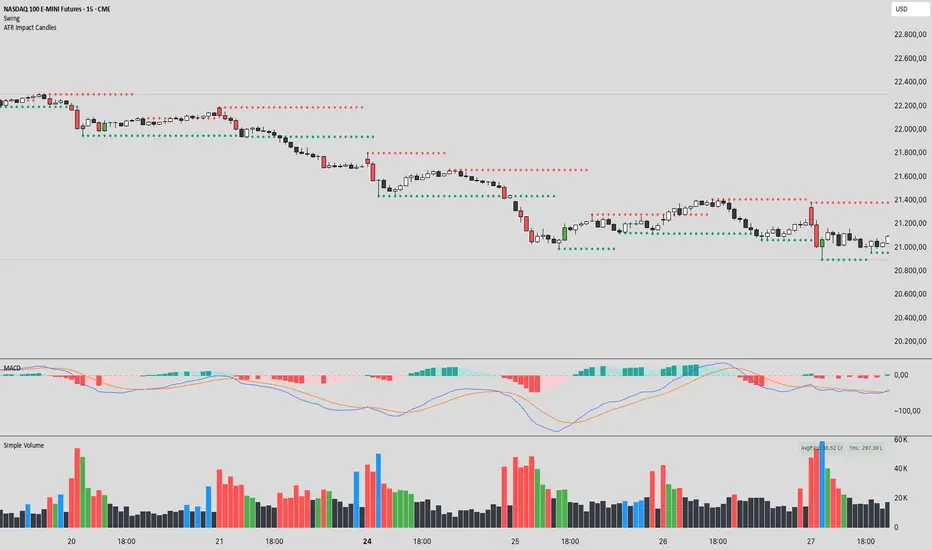
ATR Impact CandlesATR Impact Candles: Simplify Your Trading with Pure Price Action
You don’t need dozens of cluttered indicators to catch what really matters. With ATR Impact Candles, you get a powerful, single-tool solution that cuts through the noise by focusing on what truly drives the market: price action and volatility. This indicator highlights only those candlesticks that pack a punch—showing you when the market’s range is exceptionally strong relative to its recent behavior. Whether you’re a scalper or a swing trader, ATR Impact Candles empowers you to time your entries and exits with confidence, letting you trade based on real market momentum.
⸻
Indicator Overview
The indicator is designed for TradingView and is implemented in Pine Script (version 5). Its primary purpose is to highlight specific candles that meet a defined volatility condition based on the Average True Range (ATR). Instead of modifying every candle’s appearance, the indicator only changes the color of those “signal” candles that exceed a user-defined multiple of the ATR. The rest of the candles remain in their traditional black and white appearance—preserving the classic candlestick chart look.
⸻
Key Features
1. ATR-Based Signal Identification:
• ATR Calculation:
The indicator calculates the ATR using a configurable lookback period (default is 14 periods). The ATR is a common volatility measure that reflects the average range of price movement.
• Threshold Condition:
A candle is flagged as a signal if its range (high minus low) meets or exceeds a specified multiple (the “ATR Factor”) of the ATR. By default, this factor is set to 2, meaning any candle whose range is at least twice the ATR is considered significant.
2. Dynamic Candle Coloring:
• Signal Candles:
• When a candle meets the ATR threshold condition:
• Up Candles: are colored green.
• Down Candles: are colored red.
• Non-Signal Candles:
• Candles that do not meet the threshold condition retain their classic appearance:
• Up candles are white.
• Down candles are black.
3. User Configurability:
• ATR Period:
Traders can adjust the ATR period to tailor the volatility measure to different markets or timeframes.
• ATR Factor:
The multiple of the ATR that defines a signal candle is also configurable, giving flexibility to experiment with different thresholds for what constitutes “significant” price movement.
• Overlay Display:
The indicator runs in overlay mode on the chart, meaning it directly affects the appearance of the candlestick bars without interfering with other chart elements.
4. Additional Visual Aid:
• Threshold Line Plot:
The script optionally plots a line representing the ATR multiplied by the chosen factor. This line serves as a visual benchmark on the chart, allowing traders to see at what level the ATR threshold lies relative to the price action.
⸻
How It Works
1. ATR Calculation:
The indicator first calculates the Average True Range (ATR) for the defined period. This value is updated for each new candle.
2. Range Comparison:
For each candle, the indicator calculates the range (high - low) and compares it to the threshold, which is the ATR multiplied by the user-defined factor.
3. Conditional Coloring:
• If the Candle’s Range ≥ (ATR * Factor):
• The candle is marked as a “signal candle.”
• Its color is set to green if it is an up candle (close is greater than or equal to open) or red if it is a down candle.
• Otherwise:
• The candle retains its classic look, with up candles in white and down candles in black.
4. Chart Display:
By applying these rules to every candle, the indicator visually emphasizes those moments when the market shows unusually large price movements relative to its recent average volatility. This helps traders quickly spot potential breakouts or reversals.
⸻
Practical Applications
• Volatility Breakouts:
Identify candles that may signal the start of a breakout or strong reversal.
• Risk Management:
Adjust stop-loss levels or position sizes when unusually volatile candles are detected.
• Signal Confirmation:
Combine with other technical indicators or chart patterns to reinforce entry or exit decisions.
⸻
ATR Impact Candles is your essential, no-nonsense tool for filtering out market noise and focusing solely on significant price action. Simplify your trading decisions and harness the power of volatility with one clear, effective indicator.
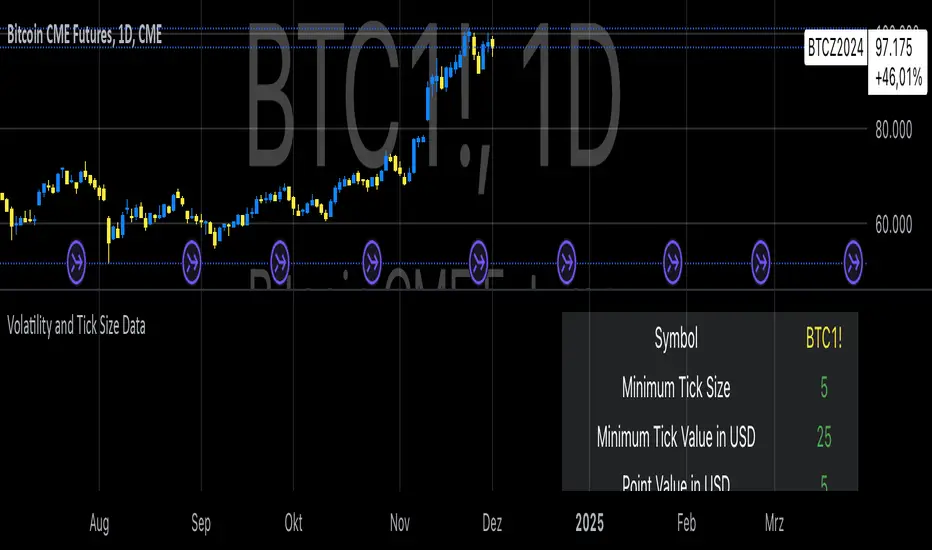
Volatility and Tick Size DataThis indicator, titled "Tick Information & Standard Deviation Table," provides detailed insights into market microstructure, including tick size, point value, and standard deviation values calculated based on the True Range. It helps visualize essential trading parameters that influence transaction costs, risk management, and portfolio performance, including volatility measures that can guide investment strategies.
Why These Data Points Are Important for Portfolio Management
Tick Size and Point Value:
Tick size refers to the smallest possible price movement in a given asset. It defines the granularity of the price changes, affecting how precise the market price can be at any moment. Point value reflects the monetary value of a single price movement (one tick). These two data points are essential for understanding transaction costs and for evaluating how much capital is at risk per price movement. Smaller tick sizes may lead to more efficient pricing in high-frequency trading strategies (Hasbrouck, 2009).
Reference: Hasbrouck, J. (2009). Empirical Market Microstructure. Foundations and Trends® in Finance, 3(4), 169-272.
Standard Deviations and Volatility:
Standard deviation measures the variability or volatility of an asset's price over a set period. This data point is critical for portfolio management, as it helps to quantify risk and predict potential price movements. True Range and its standard deviations provide a more comprehensive measure of market volatility than just price fluctuations, as they include gaps and extreme price changes. Investors use volatility data to assess the potential risk and adjust portfolio allocations accordingly (Ang, 2006).
Reference: Ang, A. (2006). Asset Management: A Systematic Approach to Factor Investing. Oxford University Press.
Risk Management:
The ability to quantify risk through metrics like the 1st, 2nd, and 3rd standard deviations of the true range is essential for implementing risk controls within a portfolio. By incorporating volatility data, portfolio managers can adjust their strategies for different market conditions, potentially reducing exposure to high-risk environments. These volatility measures help in setting stop-loss levels, optimizing position sizes, and managing the portfolio’s overall risk-return profile (Black & Scholes, 1973).
Reference: Black, F., & Scholes, M. (1973). The Pricing of Options and Corporate Liabilities. Journal of Political Economy, 81(3), 637-654.
Portfolio Diversification and Hedging:
Understanding asset volatility and transaction costs is critical when constructing a diversified portfolio. By using the standard deviations from this indicator, investors can better identify assets that may provide diversification benefits, potentially reducing the overall portfolio risk. Moreover, the point values and tick sizes help assess the cost-effectiveness of various assets, enabling portfolio managers to implement more efficient hedging strategies (Markowitz, 1952).
Reference: Markowitz, H. (1952). Portfolio Selection. The Journal of Finance, 7(1), 77-91.
Conclusion
The Tick Information & Standard Deviation Table provides critical market data that informs the risk management, diversification, and pricing strategies used in portfolio management. By incorporating tick size, point value, and volatility metrics, investors can make more informed decisions, better manage risk, and optimize the returns on their portfolios. The data serves as an essential tool for aligning asset selection and portfolio allocations with the investor's risk tolerance and market conditions.
VIX-Heatmap [CrossTrade]The "VIX-Heatmap" is a sophisticated and informative indicator designed for traders who want to integrate volatility analysis into their trading strategy, especially focusing on the market's fear gauge, the VIX (Volatility Index). This tool is not just about plotting numbers; it's about visualizing market sentiment in a more intuitive and impactful way.
Key Features and Customization Options:
1. Primary Functionality:
At its core, the VIX-Heatmap tracks the daily closing price of the VIX. It provides a clear, line-based visualization, with the line color set to black for stark contrast and easy visibility.
2. Segmented Volatility Levels:
The indicator allows users to set multiple VIX levels: Danger Zone (super low VIX level), and Levels 1 through 5. These levels are represented as horizontal lines on the chart, offering a structured view of different volatility thresholds.
3. Customizable Thresholds:
Traders can input their preferred values for each level, tailoring the indicator to fit their perception of market risk and volatility. This customization makes the tool versatile for different trading styles and market conditions.
4. Heatmap Visualization:
The chart's background color changes based on the VIX level, creating a "heatmap" effect. This visual representation allows traders to quickly gauge the current market sentiment. The color intensity varies from white (for extremely low VIX values) through various shades of red, increasing in intensity with higher VIX levels. This gradient provides an immediate visual cue of rising or falling market anxiety.
5. Interactive Display:
The indicator includes an interactive table display at the bottom center of the chart that shows the current VIX level in large, bold text, ensuring that it catches the trader's eye.
6. Optional Background Coloring:
Users have the option to enable or disable the heatmap feature. When enabled, the chart's background reflects the VIX level with the corresponding color, enhancing the visual impact of the data.
Applications and Benefits:
The VIX-Heatmap is ideal for traders who base their decisions not only on price movements but also on market sentiment and volatility. Its color-coded heatmap approach simplifies the interpretation of the VIX data, making it accessible even to those who may not be deeply familiar with volatility indices. By offering a quick visual summary of current market fear levels, it aids in making informed decisions, especially in times of market uncertainty.
In summary, the VIX-Heatmap transforms the traditional VIX data into an interactive, visually engaging, and easy-to-interpret format.

Custom ATR Trailing StopThis Script creates a custom ATR (Average True Range) trailing stop. It allows traders to set up automated stop-loss levels based on the ATR, which adjusts dynamically to market volatility. The script is designed to support both long and short trades, offering flexibility and precision in trade management.
When loading the indicator to your chart, simply click to set the trade begining time, confirm various settings and you are set.
Check tooltips for more details in the input settigns menu.
User Inputs
Trade Setup: Allows users to set the trade direction (Long or Short), the signal source for entries, and the specific bar time for the trade setup.
ATR Settings: Configurable ATR lookback period, ATR smoothing period, initial ATR multiplier for setting the stop-loss, breakeven ATR multiplier, and a manual breakeven level.
ATR Calculations
Computes the ATR and its moving average.
Determines initial and breakeven stop levels based on the ATR.
Signal Validation
Validates long or short trade signals based on the specified bar time and trade direction.
Triggers alerts when a valid trade signal is detected.
Trailing Stop Logic
For long trades, adjusts the stop-loss level dynamically based on the ATR.
For short trades, performs similar adjustments in the opposite direction.
Updates the trailing stop level to ensure it follows the price, moving closer as the price moves favorably.
Resets the trade state when the stop-loss is hit, triggering an alert.
Plotting
Plots the trailing stop levels on the chart.
Uses green for stop levels indicating profit and red for stop levels indicating a loss.

Volatility Adjusted Composite RSI with SMA and EMA SignalsOverview
The script "VAC - RSI with SMA and EMA Signals" combines the traditional Relative Strength Index (RSI) with Time-based RSI (T-RSI), and adjusts it for volatility to create a Composite RSI (C-RSI). The script further uses Simple Moving Average (SMA) and Exponential Moving Average (EMA) to generate signals for potential trading opportunities. In the "VAC - RSI with SMA and EMA Signals" script, the combination of price, time, and volatility works as follows:
Price: The script calculates the traditional RSI based on price changes over a specified period.
Time: Alongside the price-based RSI, a Time-based RSI (T-RSI) is calculated, which considers the number of upward and downward closes over the same period.
Volatility: Volatility is integrated into the Composite RSI (C-RSI) by adjusting it with a Z-score based on a standard deviation of closing prices.
These three factors work together to create a more holistic and robust indicator.
How can it be used?
This script is used to identify potential overbought and oversold conditions in the market. It plots the VAC-RSI, SMA, and EMA on a chart, along with overbought and oversold levels, providing visual signals to the trader. When the EMA is below the SMA, it is a bullish signal, and vice versa for a bearish signal.
Default Values for Different Inputs:
Price RSI Weightage (%): 65
Unified Period for RSI & T-RSI: 14
C-RSI SMA Period: 13
C-RSI EMA Period: 33
C-RSI Bull Trend Support: 35
C-RSI Bear Trend Resistance: 65
Use Volatility Adjusted C-RSI (VAC-RSI): true
Standard Deviation Period: 14
Volatility Scaling Factor (α): 5
These values can be adjusted according to the trading strategy to optimize the signals for different assets or timeframes.
Strategies this Can be Used for:
The script can be used in various trading strategies including:
Trend Following: By observing the crosses of EMA and SMA, traders can follow the trend.
Reversion to the Mean: Using the overbought and oversold levels to identify potential reversal points.
Breakout: Identifying breakout points using the Bull and Bear Market Support and Resistance levels.
Comparison with the Standard Indicator:
Enhanced Sensitivity to Market Conditions
Improved Signal Quality
Versatility
Volatility Adjustment
Interpretation of Output Values:
VAC-RSI Value:
The script provides additional overbought (80) and oversold (20) lines to help identify extreme conditions.
SMA and EMA Values:
When the EMA is below the SMA, it is generally considered a bullish signal.
When the EMA is above the SMA, it is generally considered a bearish signal.
The cross of EMA and SMA can be used as a trigger for entry or exit points.
Bull and Bear Market Support and Resistance Lines:
The Bull Market VAC-RSI Support (default at 35) and Bear Market VAC-RSI Resistance (default at 65) lines can be used to identify potential breakout or breakdown points.
In a bull market, if the VAC-RSI stays above the support line, it indicates a strong uptrend.
In a bear market, if the VAC-RSI stays below the resistance line, it indicates a strong downtrend.

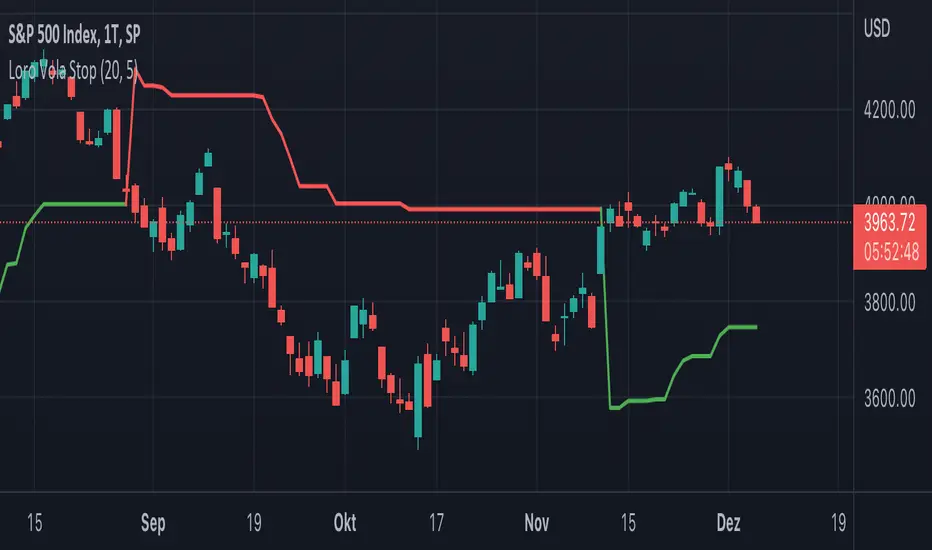
Loro Vola StopThis indicator is a variation of a chandelier volatility stop using an average true range. The indicator draws a green support line in an uptrend and a red resistance line in a downtrend. The signals normally should be used as exit triggers.
CloudRest ATR based cloudThis is an indicator I have been working on for the past 2 years, developed specifically for cryptocurrency.
It is primarily a trend following indicator with great success and it performs the best in 4hrs to the weekly chart.
There are two components of this indicator.
The baseline from Ichimoku cloud and volatility stop .
baseline period = 26
volatility stop = 1.5ATR, 3
You can view this as the main component of a trend following system but you will need other confirmation indicators to confirm your entry.
Feel free to modify the script for your own system.
Feel free to follow me on twitter @Lancelot_Auger
I will be posting more content in the future, stay tuned.
And lastly,
Free hong kong, the revolution of our time!

TRBTrue Range Bands; the 'Supertrend', also known as a volatility stop, using a 14 period length and 3x multiplier.
Contango/Backwardation Monitor
This is an indicator to display the spread difference between two products. I designed it around VX1! and VX2! but any other two products can be chosen. It is a simple subtraction of VX2-VX1. I will go through the options first and what they do followed by what contango/backwardation is in my own words. You will need the data package for VX futures for the default version to work.
INPUTS
-Apply Smoothing: choose to apply smoothing or not.
-Smoothing Method: choose between SMA,EMA,WMA, etc.
-Line Width: Width of line if line is chosen style(can be changed in style section)
-Threshold 1-5: This is the level at which the line will change colors(defaults are for VX)
-Color 1-5: The color the line will change to when crossing threshold.
Towards Backwardation: Background color change when line is slanted down
Towards Contango: Background color change when line is slanted up
Bars to Confirm Trend: This is my method to cut down on background color changes. It is how many bars consecutive going back needed to change color.
STYLE
-All colors and whatnot can be changed here(threshold colors can be changed here or on the input page).
T1 Line-T5 line: These are simple horizontal lines that can be used to denote threshold areas or whatever you want.
Contango/Backwardation-These terms are used mostly with futures to define the calendar spread between two contracts. Contango is when that spread is is getting longer and backwardation is when that spread is closing. In terms of VIX futures, Contango would imply that volatility is stabilizing and the S and P will likely gain. Backwardation, woudl eb the opposite.
The most simple way to read this indicator with default settings- If the line is up, red, and the background is red, then you can assume S and P prices are going down. And if the opposite is true, then prices are likely going up.
Please feel free to ask any questions and I will do my best to answer them.

Uptrick: Volume Weighted BandsIntroduction
This indicator, Uptrick: Volume Weighted Bands, overlays dynamic, volume-informed trend channels directly on the chart. By fusing price and volume data through volume-weighted and exponential moving averages, the script forms a core trend line with adaptive bandwidth controlled by volatility. It is designed to help traders identify trend direction, breakout entries, and extended conditions that may warrant take-profits or pullback re-entries.
Overview
The Volume Weighted Bands system is built around a trend line calculated by averaging a Volume Weighted Moving Average (VWMA) and an Exponential Moving Average (EMA), both over a configurable lookback period. This hybrid trend baseline is then smoothed further and expanded into dynamic upper and lower bands using an Average True Range (ATR) multiplier. These bands adapt with market volatility and shift color based on prevailing price action, helping traders quickly identify bullish, bearish, or neutral conditions.
Originality and Unique Features
This script introduces originality by blending both price and volume in the core trend calculation, a technique that is more responsive than traditional moving average bands. Its multi-mode visualization (cloud, single-band, or line-only), combined with selective buy/sell signals, makes it flexible for discretionary and algorithmic strategies alike. Optional modules for take-profit signals based on z-score deviation and RSI slope, as well as buy-back detection logic with cooldown filters, offer practical tools for managing trades beyond simple entries.
Explanation of Inputs
Every user input in this script is included to give the trader control over behavior and visual presentation:
Trend Length (len): Defines the lookback window for both the VWMA and EMA, controlling the sensitivity of the core trend baseline. A lower value makes the bands more reactive, while a higher value smooths out short-term noise.
Extra Smoothing (smoothLen): Applies an additional EMA to the blended VWMA/EMA average. This second-level smoothing ensures the central trend line reacts gradually to shifts in price.
Band Width (ATR Multiplier) (bandMult): Multiplies the ATR to create the width of the upper and lower bands around the trend line. Larger values widen the bands, capturing more volatility, while smaller values narrow them.
ATR Length (atrLen): Sets the length of the ATR used in calculating band width and signal offsets. Longer values produce smoother band boundaries.
Show Buy/Sell Signals (showSignals): Toggles the primary crossover/crossunder entry signals, which are labeled when the close crosses the upper or lower band.
Visual Mode (visualMode): Allows selection between three display modes:
--> Cloud: Shows both bands and the central trend line with a shaded background.
--> Single Band: Displays only the active (upper or lower) band depending on trend state, with gradient fill to price.
--> Line Only: Shows only the trend line for a minimal visual profile.
Take Profit Signals (enableTP): Enables a z-score-based profit-taking signal system. Signals occur when price deviates significantly from the trend line and RSI confirms exhaustion.
TP Z-Score Threshold (tpThreshold): Sets the z-score deviation required to trigger a take-profit signal. Higher values reduce the frequency of signals, focusing on more extreme moves.
Re-Entries (enableBuyBack): Enables logic to signal when price reverts into the band after an initial breakout, suggesting a possible re-entry or pullback setup.
Buy Back Cooldown (bars) (buyBackCooldown): Defines a minimum bar count before a new buy-back signal is allowed, preventing rapid retriggering in choppy conditions.
Buy Offset and Sell Offset: Hidden inputs used to vertically adjust the placement of the Buy ("𝓤𝓹") and Sell ("𝓓𝓸𝔀𝓷") labels relative to the bands. These use ATR units to maintain proportionality across different instruments and timeframes.
Take-Profit Signal Module
The take-profit module uses a z-score of the distance between price and the trend line to detect extended conditions. In bullish trends, a signal appears when price is well above the band and RSI indicates exhaustion; the opposite applies for bearish conditions. A boolean flag is used to prevent retriggering until RSI resets. These signals are plotted with minimalist “X” markers near recent highs or lows, based on whether the market is extended upward or downward.
Re-Entry Logic
The re-entry system identifies instances where price momentarily dips or spikes into the opposite band but closes back inside, implying a continuation of the prevailing trend. This module can be particularly useful for traders managing entries after brief pullbacks. A built-in cooldown period helps filter out noise and prevents signal overloading during fast markets. Visual markers are shown as upward or downward arrows near the relevant candle wicks.
How to Use This Indicator
The basic usage of this indicator follows a directional, signal-driven approach. When a buy signal appears, it suggests entering a long position. The recommended stop loss placement is below the lower band, allowing for some breathing space to accommodate natural volatility. As the position progresses, take partial profits—typically 10% to 15% of the position—each time a take-profit signal (marked with an "X") is shown on the chart.
An optional feature is the buy-back signal, which can be used to re-enter after partial exits or missed entries. Utilizing this can help reduce losses during false breakouts or trend reversals by scaling in more gradually. However, it also means that in strong, clean trends, the full position may not be captured from the start, potentially reducing the total return. It is up to the trader to decide whether to enter fully on the initial signal or incrementally using buy-backs.
When a sell signal appears, the strategy advises fully exiting any long positions and immediately switching to a short position. The short trade follows the same logic: place your stop loss above the upper band with some margin, and again, take partial profits at each take-profit signal.
Visual Presentation and Signal Labels
All signals are plotted with clean, minimal labels that avoid clutter, and are color-coded using a custom palette designed to remain clear across light and dark chart themes. Bullish trends are marked in teal and bearish trends in magenta. Candles and wicks are also colored accordingly to align price action with the detected trend state. Buy and sell entries are marked with "𝓤𝓹" and "𝓓𝓸𝔀𝓷" labels.
Summary
In summary, the Uptrick: Volume Weighted Bands indicator provides a versatile, visually adaptive trend and volatility tool that can serve multiple styles of trading. Through its integration of price, volume, and volatility, along with modular take-profit and buy-back signaling, it aims to provide actionable structure across a range of market conditions.
Disclaimer
This indicator is for educational purposes only. Trading involves risk, and past performance does not guarantee future results. Always test strategies before applying them in live markets.

Trend Magic Enhanced [AlgoAlpha]🔥✨ Trend Magic Enhanced - Boost Your Trend Analysis! 🚀📈
Introducing the Trend Magic Enhanced indicator by AlgoAlpha, a powerful tool designed to help you identify market trends with greater accuracy. This advanced indicator combines the Commodity Channel Index (CCI) and Average True Range (ATR) to calculate dynamic support and resistance levels, known as the Trend Magic. By smoothing the Trend Magic with various moving average types, this indicator provides clearer trend signals and helps you make more informed trading decisions.
Key Features :
🎯 Unique Trend Identification : Combines CCI and ATR to detect market trends and potential reversals.
🔄 Customizable Smoothing : Choose from SMA, EMA, SMMA, WMA, or VWMA to smooth the Magic Trend for clearer signals.
🎨 Flexible Appearance Settings : Customize colors for bullish and bearish trends to suit your charting preferences.
⚙️ Adjustable Parameters : Modify CCI period, ATR period, ATR multiplier, and smoothing length to align with your trading strategy.
🔔 Alert Notifications : Set alerts for trend shifts to stay ahead of market movements.
📈 Visual Signals : Displays trend direction changes directly on the chart with up and down arrows.
Quick Guide to Using the Trend Magic Enhanced Indicator
🛠 Add the Indicator : Add the indicator to your chart by pressing the star icon to add it to favorites. Customize settings such as CCI period, ATR multiplier, ATR period, smoothing options, and colors to match your trading style.
📊 Analyze the Chart : Observe the Trend Magic line and the color-coded trend signals. When the Trend Magic line turns bullish (e.g., green), it indicates an upward trend, and when it turns bearish (e.g., red), it indicates a downward trend. Use the visual arrows to spot trend direction changes.
🔔 Set Alerts : Enable alerts to receive notifications when a trend shift is detected, so you can act promptly on trading opportunities without constantly monitoring the chart.
How It Works:
The Trend Magic Enhanced indicator integrates the Commodity Channel Index (CCI) and Average True Range (ATR) to calculate a dynamic Trend Magic line. By adjusting price levels based on CCI values—upward when CCI is positive and downward when negative—and factoring in ATR for market volatility, it creates adaptive support and resistance levels. Optionally smoothed with various moving averages to reduce noise, the indicator changes line color based on trend direction, highlights trend changes with arrows, and provides alerts for significant shifts, aiding traders in identifying potential entry and exit points.
Enhancements Over the Original Trend Magic Indicator
The Trend Magic Enhanced indicator significantly refines the trend identification method of the original Trend Magic script by introducing customizable smoothing options and additional analytical features. While the original indicator determines trend direction solely based on the Commodity Channel Index (CCI) crossing above or below zero and adjusts the Magic Trend line using the Average True Range (ATR), the enhanced version allows users to smooth the Magic Trend line with various moving average types (SMA, EMA, SMMA, WMA, VWMA). This smoothing reduces market noise and provides clearer trend signals. Additionally, the enhanced indicator incorporates price action analysis by detecting crossovers and crossunders of price with the Magic Trend line, and it visually marks trend changes with up and down arrows on the chart. These improvements offer a more responsive and accurate trend detection compared to the original method, enabling traders to identify potential entry and exit points more effectively.
Enhance your trading strategy with the Trend Magic Enhanced indicator by AlgoAlpha and gain a clearer perspective on market trends! 🌟📈

Adaptive Genesis Engine [AGE]ADAPTIVE GENESIS ENGINE (AGE)
Pure Signal Evolution Through Genetic Algorithms
Where Darwin Meets Technical Analysis
🧬 WHAT YOU'RE GETTING - THE PURE INDICATOR
This is a technical analysis indicator - it generates signals, visualizes probability, and shows you the evolutionary process in real-time. This is NOT a strategy with automatic execution - it's a sophisticated signal generation system that you control .
What This Indicator Does:
Generates Long/Short entry signals with probability scores (35-88% range)
Evolves a population of up to 12 competing strategies using genetic algorithms
Validates strategies through walk-forward optimization (train/test cycles)
Visualizes signal quality through premium gradient clouds and confidence halos
Displays comprehensive metrics via enhanced dashboard
Provides alerts for entries and exits
Works on any timeframe, any instrument, any broker
What This Indicator Does NOT Do:
Execute trades automatically
Manage positions or calculate position sizes
Place orders on your behalf
Make trading decisions for you
This is pure signal intelligence. AGE tells you when and how confident it is. You decide whether and how much to trade.
🔬 THE SCIENCE: GENETIC ALGORITHMS MEET TECHNICAL ANALYSIS
What Makes This Different - The Evolutionary Foundation
Most indicators are static - they use the same parameters forever, regardless of market conditions. AGE is alive . It maintains a population of competing strategies that evolve, adapt, and improve through natural selection principles:
Birth: New strategies spawn through crossover breeding (combining DNA from fit parents) plus random mutation for exploration
Life: Each strategy trades virtually via shadow portfolios, accumulating wins/losses, tracking drawdown, and building performance history
Selection: Strategies are ranked by comprehensive fitness scoring (win rate, expectancy, drawdown control, signal efficiency)
Death: Weak strategies are culled periodically, with elite performers (top 2 by default) protected from removal
Evolution: The gene pool continuously improves as successful traits propagate and unsuccessful ones die out
This is not curve-fitting. Each new strategy must prove itself on out-of-sample data through walk-forward validation before being trusted for live signals.
🧪 THE DNA: WHAT EVOLVES
Every strategy carries a 10-gene chromosome controlling how it interprets market data:
Signal Sensitivity Genes
Entropy Sensitivity (0.5-2.0): Weight given to market order/disorder calculations. Low values = conservative, require strong directional clarity. High values = aggressive, act on weaker order signals.
Momentum Sensitivity (0.5-2.0): Weight given to RSI/ROC/MACD composite. Controls responsiveness to momentum shifts vs. mean-reversion setups.
Structure Sensitivity (0.5-2.0): Weight given to support/resistance positioning. Determines how much price location within swing range matters.
Probability Adjustment Genes
Probability Boost (-0.10 to +0.10): Inherent bias toward aggressive (+) or conservative (-) entries. Acts as personality trait - some strategies naturally optimistic, others pessimistic.
Trend Strength Requirement (0.3-0.8): Minimum trend conviction needed before signaling. Higher values = only trades strong trends, lower values = acts in weak/sideways markets.
Volume Filter (0.5-1.5): Strictness of volume confirmation. Higher values = requires strong volume, lower values = volume less important.
Risk Management Genes
ATR Multiplier (1.5-4.0): Base volatility scaling for all price levels. Controls whether strategy uses tight or wide stops/targets relative to ATR.
Stop Multiplier (1.0-2.5): Stop loss tightness. Lower values = aggressive profit protection, higher values = more breathing room.
Target Multiplier (1.5-4.0): Profit target ambition. Lower values = quick scalping exits, higher values = swing trading holds.
Adaptation Gene
Regime Adaptation (0.0-1.0): How much strategy adjusts behavior based on detected market regime (trending/volatile/choppy). Higher values = more reactive to regime changes.
The Magic: AGE doesn't just try random combinations. Through tournament selection and fitness-weighted crossover, successful gene combinations spread through the population while unsuccessful ones fade away. Over 50-100 bars, you'll see the population converge toward genes that work for YOUR instrument and timeframe.
📊 THE SIGNAL ENGINE: THREE-LAYER SYNTHESIS
Before any strategy generates a signal, AGE calculates probability through multi-indicator confluence:
Layer 1 - Market Entropy (Information Theory)
Measures whether price movements exhibit directional order or random walk characteristics:
The Math:
Shannon Entropy = -Σ(p × log(p))
Market Order = 1 - (Entropy / 0.693)
What It Means:
High entropy = choppy, random market → low confidence signals
Low entropy = directional market → high confidence signals
Direction determined by up-move vs down-move dominance over lookback period (default: 20 bars)
Signal Output: -1.0 to +1.0 (bearish order to bullish order)
Layer 2 - Momentum Synthesis
Combines three momentum indicators into single composite score:
Components:
RSI (40% weight): Normalized to -1/+1 scale using (RSI-50)/50
Rate of Change (30% weight): Percentage change over lookback (default: 14 bars), clamped to ±1
MACD Histogram (30% weight): Fast(12) - Slow(26), normalized by ATR
Why This Matters: RSI catches mean-reversion opportunities, ROC catches raw momentum, MACD catches momentum divergence. Weighting favors RSI for reliability while keeping other perspectives.
Signal Output: -1.0 to +1.0 (strong bearish to strong bullish)
Layer 3 - Structure Analysis
Evaluates price position within swing range (default: 50-bar lookback):
Position Classification:
Bottom 20% of range = Support Zone → bullish bounce potential
Top 20% of range = Resistance Zone → bearish rejection potential
Middle 60% = Neutral Zone → breakout/breakdown monitoring
Signal Logic:
At support + bullish candle = +0.7 (strong buy setup)
At resistance + bearish candle = -0.7 (strong sell setup)
Breaking above range highs = +0.5 (breakout confirmation)
Breaking below range lows = -0.5 (breakdown confirmation)
Consolidation within range = ±0.3 (weak directional bias)
Signal Output: -1.0 to +1.0 (bearish structure to bullish structure)
Confluence Voting System
Each layer casts a vote (Long/Short/Neutral). The system requires minimum 2-of-3 agreement (configurable 1-3) before generating a signal:
Examples:
Entropy: Bullish, Momentum: Bullish, Structure: Neutral → Signal generated (2 long votes)
Entropy: Bearish, Momentum: Neutral, Structure: Neutral → No signal (only 1 short vote)
All three bullish → Signal generated with +5% probability bonus
This is the key to quality. Single indicators give too many false signals. Triple confirmation dramatically improves accuracy.
📈 PROBABILITY CALCULATION: HOW CONFIDENCE IS MEASURED
Base Probability:
Raw_Prob = 50% + (Average_Signal_Strength × 25%)
Then AGE applies strategic adjustments:
Trend Alignment:
Signal with trend: +4%
Signal against strong trend: -8%
Weak/no trend: no adjustment
Regime Adaptation:
Trending market (efficiency >50%, moderate vol): +3%
Volatile market (vol ratio >1.5x): -5%
Choppy market (low efficiency): -2%
Volume Confirmation:
Volume > 70% of 20-bar SMA: no change
Volume below threshold: -3%
Volatility State (DVS Ratio):
High vol (>1.8x baseline): -4% (reduce confidence in chaos)
Low vol (<0.7x baseline): -2% (markets can whipsaw in compression)
Moderate elevated vol (1.0-1.3x): +2% (trending conditions emerging)
Confluence Bonus:
All 3 indicators agree: +5%
2 of 3 agree: +2%
Strategy Gene Adjustment:
Probability Boost gene: -10% to +10%
Regime Adaptation gene: scales regime adjustments by 0-100%
Final Probability: Clamped between 35% (minimum) and 88% (maximum)
Why These Ranges?
Below 35% = too uncertain, better not to signal
Above 88% = unrealistic, creates overconfidence
Sweet spot: 65-80% for quality entries
🔄 THE SHADOW PORTFOLIO SYSTEM: HOW STRATEGIES COMPETE
Each active strategy maintains a virtual trading account that executes in parallel with real-time data:
Shadow Trading Mechanics
Entry Logic:
Calculate signal direction, probability, and confluence using strategy's unique DNA
Check if signal meets quality gate:
Probability ≥ configured minimum threshold (default: 65%)
Confluence ≥ configured minimum (default: 2 of 3)
Direction is not zero (must be long or short, not neutral)
Verify signal persistence:
Base requirement: 2 bars (configurable 1-5)
Adapts based on probability: high-prob signals (75%+) enter 1 bar faster, low-prob signals need 1 bar more
Adjusts for regime: trending markets reduce persistence by 1, volatile markets add 1
Apply additional filters:
Trend strength must exceed strategy's requirement gene
Regime filter: if volatile market detected, probability must be 72%+ to override
Volume confirmation required (volume > 70% of average)
If all conditions met for required persistence bars, enter shadow position at current close price
Position Management:
Entry Price: Recorded at close of entry bar
Stop Loss: ATR-based distance = ATR × ATR_Mult (gene) × Stop_Mult (gene) × DVS_Ratio
Take Profit: ATR-based distance = ATR × ATR_Mult (gene) × Target_Mult (gene) × DVS_Ratio
Position: +1 (long) or -1 (short), only one at a time per strategy
Exit Logic:
Check if price hit stop (on low) or target (on high) on current bar
Record trade outcome in R-multiples (profit/loss normalized by ATR)
Update performance metrics:
Total trades counter incremented
Wins counter (if profit > 0)
Cumulative P&L updated
Peak equity tracked (for drawdown calculation)
Maximum drawdown from peak recorded
Enter cooldown period (default: 8 bars, configurable 3-20) before next entry allowed
Reset signal age counter to zero
Walk-Forward Tracking:
During position lifecycle, trades are categorized:
Training Phase (first 250 bars): Trade counted toward training metrics
Testing Phase (next 75 bars): Trade counted toward testing metrics (out-of-sample)
Live Phase (after WFO period): Trade counted toward overall metrics
Why Shadow Portfolios?
No lookahead bias (uses only data available at the bar)
Realistic execution simulation (entry on close, stop/target checks on high/low)
Independent performance tracking for true fitness comparison
Allows safe experimentation without risking capital
Each strategy learns from its own experience
🏆 FITNESS SCORING: HOW STRATEGIES ARE RANKED
Fitness is not just win rate. AGE uses a comprehensive multi-factor scoring system:
Core Metrics (Minimum 3 trades required)
Win Rate (30% of fitness):
WinRate = Wins / TotalTrades
Normalized directly (0.0-1.0 scale)
Total P&L (30% of fitness):
Normalized_PnL = (PnL + 300) / 600
Clamped 0.0-1.0. Assumes P&L range of -300R to +300R for normalization scale.
Expectancy (25% of fitness):
Expectancy = Total_PnL / Total_Trades
Normalized_Expectancy = (Expectancy + 30) / 60
Clamped 0.0-1.0. Rewards consistency of profit per trade.
Drawdown Control (15% of fitness):
Normalized_DD = 1 - (Max_Drawdown / 15)
Clamped 0.0-1.0. Penalizes strategies that suffer large equity retracements from peak.
Sample Size Adjustment
Quality Factor:
<50 trades: 1.0 (full weight, small sample)
50-100 trades: 0.95 (slight penalty for medium sample)
100 trades: 0.85 (larger penalty for large sample)
Why penalize more trades? Prevents strategies from gaming the system by taking hundreds of tiny trades to inflate statistics. Favors quality over quantity.
Bonus Adjustments
Walk-Forward Validation Bonus:
if (WFO_Validated):
Fitness += (WFO_Efficiency - 0.5) × 0.1
Strategies proven on out-of-sample data receive up to +10% fitness boost based on test/train efficiency ratio.
Signal Efficiency Bonus (if diagnostics enabled):
if (Signals_Evaluated > 10):
Pass_Rate = Signals_Passed / Signals_Evaluated
Fitness += (Pass_Rate - 0.1) × 0.05
Rewards strategies that generate high-quality signals passing the quality gate, not just profitable trades.
Final Fitness: Clamped at 0.0 minimum (prevents negative fitness values)
Result: Elite strategies typically achieve 0.50-0.75 fitness. Anything above 0.60 is excellent. Below 0.30 is prime candidate for culling.
🔬 WALK-FORWARD OPTIMIZATION: ANTI-OVERFITTING PROTECTION
This is what separates AGE from curve-fitted garbage indicators.
The Three-Phase Process
Every new strategy undergoes a rigorous validation lifecycle:
Phase 1 - Training Window (First 250 bars, configurable 100-500):
Strategy trades normally via shadow portfolio
All trades count toward training performance metrics
System learns which gene combinations produce profitable patterns
Tracks independently: Training_Trades, Training_Wins, Training_PnL
Phase 2 - Testing Window (Next 75 bars, configurable 30-200):
Strategy continues trading without any parameter changes
Trades now count toward testing performance metrics (separate tracking)
This is out-of-sample data - strategy has never seen these bars during "optimization"
Tracks independently: Testing_Trades, Testing_Wins, Testing_PnL
Phase 3 - Validation Check:
Minimum_Trades = 5 (configurable 3-15)
IF (Train_Trades >= Minimum AND Test_Trades >= Minimum):
WR_Efficiency = Test_WinRate / Train_WinRate
Expectancy_Efficiency = Test_Expectancy / Train_Expectancy
WFO_Efficiency = (WR_Efficiency + Expectancy_Efficiency) / 2
IF (WFO_Efficiency >= 0.55): // configurable 0.3-0.9
Strategy.Validated = TRUE
Strategy receives fitness bonus
ELSE:
Strategy receives 30% fitness penalty
ELSE:
Validation deferred (insufficient trades in one or both periods)
What Validation Means
Validated Strategy (Green "✓ VAL" in dashboard):
Performed at least 55% as well on unseen data compared to training data
Gets fitness bonus: +(efficiency - 0.5) × 0.1
Receives priority during tournament selection for breeding
More likely to be chosen as active trading strategy
Unvalidated Strategy (Orange "○ TRAIN" in dashboard):
Failed to maintain performance on test data (likely curve-fitted to training period)
Receives 30% fitness penalty (0.7x multiplier)
Makes strategy prime candidate for culling
Can still trade but with lower selection probability
Insufficient Data (continues collecting):
Hasn't completed both training and testing periods yet
OR hasn't achieved minimum trade count in both periods
Validation check deferred until requirements met
Why 55% Efficiency Threshold?
If a strategy earned 10R during training but only 5.5R during testing, it still proved an edge exists beyond random luck. Requiring 100% efficiency would be unrealistic - market conditions change between periods. But requiring >50% ensures the strategy didn't completely degrade on fresh data.
The Protection: Strategies that work great on historical data but fail on new data are automatically identified and penalized. This prevents the population from being polluted by overfitted strategies that would fail in live trading.
🌊 DYNAMIC VOLATILITY SCALING (DVS): ADAPTIVE STOP/TARGET PLACEMENT
AGE doesn't use fixed stop distances. It adapts to current volatility conditions in real-time.
Four Volatility Measurement Methods
1. ATR Ratio (Simple Method):
Current_Vol = ATR(14) / Close
Baseline_Vol = SMA(Current_Vol, 100)
Ratio = Current_Vol / Baseline_Vol
Basic comparison of current ATR to 100-bar moving average baseline.
2. Parkinson (High-Low Range Based):
For each bar: HL = log(High / Low)
Parkinson_Vol = sqrt(Σ(HL²) / (4 × Period × log(2)))
More stable than close-to-close volatility. Captures intraday range expansion without overnight gap noise.
3. Garman-Klass (OHLC Based):
HL_Term = 0.5 × ²
CO_Term = (2×log(2) - 1) × ²
GK_Vol = sqrt(Σ(HL_Term - CO_Term) / Period)
Most sophisticated estimator. Incorporates all four price points (open, high, low, close) plus gap information.
4. Ensemble Method (Default - Median of All Three):
Ratio_1 = ATR_Current / ATR_Baseline
Ratio_2 = Parkinson_Current / Parkinson_Baseline
Ratio_3 = GK_Current / GK_Baseline
DVS_Ratio = Median(Ratio_1, Ratio_2, Ratio_3)
Why Ensemble?
Takes median to avoid outliers and false spikes
If ATR jumps but range-based methods stay calm, median prevents overreaction
If one method fails, other two compensate
Most robust approach across different market conditions
Sensitivity Scaling
Scaled_Ratio = (Raw_Ratio) ^ Sensitivity
Sensitivity 0.3: Cube root - heavily dampens volatility impact
Sensitivity 0.5: Square root - moderate dampening
Sensitivity 0.7 (Default): Balanced response to volatility changes
Sensitivity 1.0: Linear - full 1:1 volatility impact
Sensitivity 1.5: Exponential - amplified response to volatility spikes
Safety Clamps: Final DVS Ratio always clamped between 0.5x and 2.5x baseline to prevent extreme position sizing or stop placement errors.
How DVS Affects Shadow Trading
Every strategy's stop and target distances are multiplied by the current DVS ratio:
Stop Loss Distance:
Stop_Distance = ATR × ATR_Mult (gene) × Stop_Mult (gene) × DVS_Ratio
Take Profit Distance:
Target_Distance = ATR × ATR_Mult (gene) × Target_Mult (gene) × DVS_Ratio
Example Scenario:
ATR = 10 points
Strategy's ATR_Mult gene = 2.5
Strategy's Stop_Mult gene = 1.5
Strategy's Target_Mult gene = 2.5
DVS_Ratio = 1.4 (40% above baseline volatility - market heating up)
Stop = 10 × 2.5 × 1.5 × 1.4 = 52.5 points (vs. 37.5 in normal vol)
Target = 10 × 2.5 × 2.5 × 1.4 = 87.5 points (vs. 62.5 in normal vol)
Result:
During volatility spikes: Stops automatically widen to avoid noise-based exits, targets extend for bigger moves
During calm periods: Stops tighten for better risk/reward, targets compress for realistic profit-taking
Strategies adapt risk management to match current market behavior
🧬 THE EVOLUTIONARY CYCLE: SPAWN, COMPETE, CULL
Initialization (Bar 1)
AGE begins with 4 seed strategies (if evolution enabled):
Seed Strategy #0 (Balanced):
All sensitivities at 1.0 (neutral)
Zero probability boost
Moderate trend requirement (0.4)
Standard ATR/stop/target multiples (2.5/1.5/2.5)
Mid-level regime adaptation (0.5)
Seed Strategy #1 (Momentum-Focused):
Lower entropy sensitivity (0.7), higher momentum (1.5)
Slight probability boost (+0.03)
Higher trend requirement (0.5)
Tighter stops (1.3), wider targets (3.0)
Seed Strategy #2 (Entropy-Driven):
Higher entropy sensitivity (1.5), lower momentum (0.8)
Slight probability penalty (-0.02)
More trend tolerant (0.6)
Wider stops (1.8), standard targets (2.5)
Seed Strategy #3 (Structure-Based):
Balanced entropy/momentum (0.8/0.9), high structure (1.4)
Slight probability boost (+0.02)
Lower trend requirement (0.35)
Moderate risk parameters (1.6/2.8)
All seeds start with WFO validation bypassed if WFO is disabled, or must validate if enabled.
Spawning New Strategies
Timing (Adaptive):
Historical phase: Every 30 bars (configurable 10-100)
Live phase: Every 200 bars (configurable 100-500)
Automatically switches to live timing when barstate.isrealtime triggers
Conditions:
Current population < max population limit (default: 8, configurable 4-12)
At least 2 active strategies exist (need parents)
Available slot in population array
Selection Process:
Run tournament selection 3 times with different seeds
Each tournament: randomly sample active strategies, pick highest fitness
Best from 3 tournaments becomes Parent 1
Repeat independently for Parent 2
Ensures fit parents but maintains diversity
Crossover Breeding:
For each of 10 genes:
Parent1_Fitness = fitness
Parent2_Fitness = fitness
Weight1 = Parent1_Fitness / (Parent1_Fitness + Parent2_Fitness)
Gene1 = parent1's value
Gene2 = parent2's value
Child_Gene = Weight1 × Gene1 + (1 - Weight1) × Gene2
Fitness-weighted crossover ensures fitter parent contributes more genetic material.
Mutation:
For each gene in child:
IF (random < mutation_rate):
Gene_Range = GENE_MAX - GENE_MIN
Noise = (random - 0.5) × 2 × mutation_strength × Gene_Range
Mutated_Gene = Clamp(Child_Gene + Noise, GENE_MIN, GENE_MAX)
Historical mutation rate: 20% (aggressive exploration)
Live mutation rate: 8% (conservative stability)
Mutation strength: 12% of gene range (configurable 5-25%)
Initialization of New Strategy:
Unique ID assigned (total_spawned counter)
Parent ID recorded
Generation = max(parent generations) + 1
Birth bar recorded (for age tracking)
All performance metrics zeroed
Shadow portfolio reset
WFO validation flag set to false (must prove itself)
Result: New strategy with hybrid DNA enters population, begins trading in next bar.
Competition (Every Bar)
All active strategies:
Calculate their signal based on unique DNA
Check quality gate with their thresholds
Manage shadow positions (entries/exits)
Update performance metrics
Recalculate fitness score
Track WFO validation progress
Strategies compete indirectly through fitness ranking - no direct interaction.
Culling Weak Strategies
Timing (Adaptive):
Historical phase: Every 60 bars (configurable 20-200, should be 2x spawn interval)
Live phase: Every 400 bars (configurable 200-1000, should be 2x spawn interval)
Minimum Adaptation Score (MAS):
Initial MAS = 0.10
MAS decays: MAS × 0.995 every cull cycle
Minimum MAS = 0.03 (floor)
MAS represents the "survival threshold" - strategies below this fitness level are vulnerable.
Culling Conditions (ALL must be true):
Population > minimum population (default: 3, configurable 2-4)
At least one strategy has fitness < MAS
Strategy's age > culling interval (prevents premature culling of new strategies)
Strategy is not in top N elite (default: 2, configurable 1-3)
Culling Process:
Find worst strategy:
For each active strategy:
IF (age > cull_interval):
Fitness = base_fitness
IF (not WFO_validated AND WFO_enabled):
Fitness × 0.7 // 30% penalty for unvalidated
IF (Fitness < MAS AND Fitness < worst_fitness_found):
worst_strategy = this_strategy
worst_fitness = Fitness
IF (worst_strategy found):
Count elite strategies with fitness > worst_fitness
IF (elite_count >= elite_preservation_count):
Deactivate worst_strategy (set active flag = false)
Increment total_culled counter
Elite Protection:
Even if a strategy's fitness falls below MAS, it survives if fewer than N strategies are better. This prevents culling when population is generally weak.
Result: Weak strategies removed from population, freeing slots for new spawns. Gene pool improves over time.
Selection for Display (Every Bar)
AGE chooses one strategy to display signals:
Best fitness = -1
Selected = none
For each active strategy:
Fitness = base_fitness
IF (WFO_validated):
Fitness × 1.3 // 30% bonus for validated strategies
IF (Fitness > best_fitness):
best_fitness = Fitness
selected_strategy = this_strategy
Display selected strategy's signals on chart
Result: Only the highest-fitness (optionally validated-boosted) strategy's signals appear as chart markers. Other strategies trade invisibly in shadow portfolios.
🎨 PREMIUM VISUALIZATION SYSTEM
AGE includes sophisticated visual feedback that standard indicators lack:
1. Gradient Probability Cloud (Optional, Default: ON)
Multi-layer gradient showing signal buildup 2-3 bars before entry:
Activation Conditions:
Signal persistence > 0 (same directional signal held for multiple bars)
Signal probability ≥ minimum threshold (65% by default)
Signal hasn't yet executed (still in "forming" state)
Visual Construction:
7 gradient layers by default (configurable 3-15)
Each layer is a line-fill pair (top line, bottom line, filled between)
Layer spacing: 0.3 to 1.0 × ATR above/below price
Outer layers = faint, inner layers = bright
Color transitions from base to intense based on layer position
Transparency scales with probability (high prob = more opaque)
Color Selection:
Long signals: Gradient from theme.gradient_bull_mid to theme.gradient_bull_strong
Short signals: Gradient from theme.gradient_bear_mid to theme.gradient_bear_strong
Base transparency: 92%, reduces by up to 8% for high-probability setups
Dynamic Behavior:
Cloud grows/shrinks as signal persistence increases/decreases
Redraws every bar while signal is forming
Disappears when signal executes or invalidates
Performance Note: Computationally expensive due to linefill objects. Disable or reduce layers if chart performance degrades.
2. Population Fitness Ribbon (Optional, Default: ON)
Histogram showing fitness distribution across active strategies:
Activation: Only draws on last bar (barstate.islast) to avoid historical clutter
Visual Construction:
10 histogram layers by default (configurable 5-20)
Plots 50 bars back from current bar
Positioned below price at: lowest_low(100) - 1.5×ATR (doesn't interfere with price action)
Each layer represents a fitness threshold (evenly spaced min to max fitness)
Layer Logic:
For layer_num from 0 to ribbon_layers:
Fitness_threshold = min_fitness + (max_fitness - min_fitness) × (layer / layers)
Count strategies with fitness ≥ threshold
Height = ATR × 0.15 × (count / total_active)
Y_position = base_level + ATR × 0.2 × layer
Color = Gradient from weak to strong based on layer position
Line_width = Scaled by height (taller = thicker)
Visual Feedback:
Tall, bright ribbon = healthy population, many fit strategies at high fitness levels
Short, dim ribbon = weak population, few strategies achieving good fitness
Ribbon compression (layers close together) = population converging to similar fitness
Ribbon spread = diverse fitness range, active selection pressure
Use Case: Quick visual health check without opening dashboard. Ribbon growing upward over time = population improving.
3. Confidence Halo (Optional, Default: ON)
Circular polyline around entry signals showing probability strength:
Activation: Draws when new position opens (shadow_position changes from 0 to ±1)
Visual Construction:
20-segment polyline forming approximate circle
Center: Low - 0.5×ATR (long) or High + 0.5×ATR (short)
Radius: 0.3×ATR (low confidence) to 1.0×ATR (elite confidence)
Scales with: (probability - min_probability) / (1.0 - min_probability)
Color Coding:
Elite (85%+): Cyan (theme.conf_elite), large radius, minimal transparency (40%)
Strong (75-85%): Strong green (theme.conf_strong), medium radius, moderate transparency (50%)
Good (65-75%): Good green (theme.conf_good), smaller radius, more transparent (60%)
Moderate (<65%): Moderate green (theme.conf_moderate), tiny radius, very transparent (70%)
Technical Detail:
Uses chart.point array with index-based positioning
5-bar horizontal spread for circular appearance (±5 bars from entry)
Curved=false (Pine Script polyline limitation)
Fill color matches line color but more transparent (88% vs line's transparency)
Purpose: Instant visual probability assessment. No need to check dashboard - halo size/brightness tells the story.
4. Evolution Event Markers (Optional, Default: ON)
Visual indicators of genetic algorithm activity:
Spawn Markers (Diamond, Cyan):
Plots when total_spawned increases on current bar
Location: bottom of chart (location.bottom)
Color: theme.spawn_marker (cyan/bright blue)
Size: tiny
Indicates new strategy just entered population
Cull Markers (X-Cross, Red):
Plots when total_culled increases on current bar
Location: bottom of chart (location.bottom)
Color: theme.cull_marker (red/pink)
Size: tiny
Indicates weak strategy just removed from population
What It Tells You:
Frequent spawning early = population building, active exploration
Frequent culling early = high selection pressure, weak strategies dying fast
Balanced spawn/cull = healthy evolutionary churn
No markers for long periods = stable population (evolution plateaued or optimal genes found)
5. Entry/Exit Markers
Clear visual signals for selected strategy's trades:
Long Entry (Triangle Up, Green):
Plots when selected strategy opens long position (position changes 0 → +1)
Location: below bar (location.belowbar)
Color: theme.long_primary (green/cyan depending on theme)
Transparency: Scales with probability:
Elite (85%+): 0% (fully opaque)
Strong (75-85%): 10%
Good (65-75%): 20%
Acceptable (55-65%): 35%
Size: small
Short Entry (Triangle Down, Red):
Plots when selected strategy opens short position (position changes 0 → -1)
Location: above bar (location.abovebar)
Color: theme.short_primary (red/pink depending on theme)
Transparency: Same scaling as long entries
Size: small
Exit (X-Cross, Orange):
Plots when selected strategy closes position (position changes ±1 → 0)
Location: absolute (at actual exit price if stop/target lines enabled)
Color: theme.exit_color (orange/yellow depending on theme)
Transparency: 0% (fully opaque)
Size: tiny
Result: Clean, probability-scaled markers that don't clutter chart but convey essential information.
6. Stop Loss & Take Profit Lines (Optional, Default: ON)
Visual representation of shadow portfolio risk levels:
Stop Loss Line:
Plots when selected strategy has active position
Level: shadow_stop value from selected strategy
Color: theme.short_primary with 60% transparency (red/pink, subtle)
Width: 2
Style: plot.style_linebr (breaks when no position)
Take Profit Line:
Plots when selected strategy has active position
Level: shadow_target value from selected strategy
Color: theme.long_primary with 60% transparency (green, subtle)
Width: 2
Style: plot.style_linebr (breaks when no position)
Purpose:
Shows where shadow portfolio would exit for stop/target
Helps visualize strategy's risk/reward ratio
Useful for manual traders to set similar levels
Disable for cleaner chart (recommended for presentations)
7. Dynamic Trend EMA
Gradient-colored trend line that visualizes trend strength:
Calculation:
EMA(close, trend_length) - default 50 period (configurable 20-100)
Slope calculated over 10 bars: (current_ema - ema ) / ema × 100
Color Logic:
Trend_direction:
Slope > 0.1% = Bullish (1)
Slope < -0.1% = Bearish (-1)
Otherwise = Neutral (0)
Trend_strength = abs(slope)
Color = Gradient between:
- Neutral color (gray/purple)
- Strong bullish (bright green) if direction = 1
- Strong bearish (bright red) if direction = -1
Gradient factor = trend_strength (0 to 1+ scale)
Visual Behavior:
Faint gray/purple = weak/no trend (choppy conditions)
Light green/red = emerging trend (low strength)
Bright green/red = strong trend (high conviction)
Color intensity = trend strength magnitude
Transparency: 50% (subtle, doesn't overpower price action)
Purpose: Subconscious awareness of trend state without checking dashboard or indicators.
8. Regime Background Tinting (Subtle)
Ultra-low opacity background color indicating detected market regime:
Regime Detection:
Efficiency = directional_movement / total_range (over trend_length bars)
Vol_ratio = current_volatility / average_volatility
IF (efficiency > 0.5 AND vol_ratio < 1.3):
Regime = Trending (1)
ELSE IF (vol_ratio > 1.5):
Regime = Volatile (2)
ELSE:
Regime = Choppy (0)
Background Colors:
Trending: theme.regime_trending (dark green, 92-93% transparency)
Volatile: theme.regime_volatile (dark red, 93% transparency)
Choppy: No tint (normal background)
Purpose:
Subliminal regime awareness
Helps explain why signals are/aren't generating
Trending = ideal conditions for AGE
Volatile = fewer signals, higher thresholds applied
Choppy = mixed signals, lower confidence
Important: Extremely subtle by design. Not meant to be obvious, just subconscious context.
📊 ENHANCED DASHBOARD
Comprehensive real-time metrics in single organized panel (top-right position):
Dashboard Structure (5 columns × 14 rows)
Header Row:
Column 0: "🧬 AGE PRO" + phase indicator (🔴 LIVE or ⏪ HIST)
Column 1: "POPULATION"
Column 2: "PERFORMANCE"
Column 3: "CURRENT SIGNAL"
Column 4: "ACTIVE STRATEGY"
Column 0: Market State
Regime (📈 TREND / 🌊 CHAOS / ➖ CHOP)
DVS Ratio (current volatility scaling factor, format: #.##)
Trend Direction (▲ BULL / ▼ BEAR / ➖ FLAT with color coding)
Trend Strength (0-100 scale, format: #.##)
Column 1: Population Metrics
Active strategies (count / max_population)
Validated strategies (WFO passed / active total)
Current generation number
Total spawned (all-time strategy births)
Total culled (all-time strategy deaths)
Column 2: Aggregate Performance
Total trades across all active strategies
Aggregate win rate (%) - color-coded:
Green (>55%)
Orange (45-55%)
Red (<45%)
Total P&L in R-multiples - color-coded by positive/negative
Best fitness score in population (format: #.###)
MAS - Minimum Adaptation Score (cull threshold, format: #.###)
Column 3: Current Signal Status
Status indicator:
"▲ LONG" (green) if selected strategy in long position
"▼ SHORT" (red) if selected strategy in short position
"⏳ FORMING" (orange) if signal persisting but not yet executed
"○ WAITING" (gray) if no active signal
Confidence percentage (0-100%, format: #.#%)
Quality assessment:
"🔥 ELITE" (cyan) for 85%+ probability
"✓ STRONG" (bright green) for 75-85%
"○ GOOD" (green) for 65-75%
"- LOW" (dim) for <65%
Confluence score (X/3 format)
Signal age:
"X bars" if signal forming
"IN TRADE" if position active
"---" if no signal
Column 4: Selected Strategy Details
Strategy ID number (#X format)
Validation status:
"✓ VAL" (green) if WFO validated
"○ TRAIN" (orange) if still in training/testing phase
Generation number (GX format)
Personal fitness score (format: #.### with color coding)
Trade count
P&L and win rate (format: #.#R (##%) with color coding)
Color Scheme:
Panel background: theme.panel_bg (dark, low opacity)
Panel headers: theme.panel_header (slightly lighter)
Primary text: theme.text_primary (bright, high contrast)
Secondary text: theme.text_secondary (dim, lower contrast)
Positive metrics: theme.metric_positive (green)
Warning metrics: theme.metric_warning (orange)
Negative metrics: theme.metric_negative (red)
Special markers: theme.validated_marker, theme.spawn_marker
Update Frequency: Only on barstate.islast (current bar) to minimize CPU usage
Purpose:
Quick overview of entire system state
No need to check multiple indicators
Trading decisions informed by population health, regime state, and signal quality
Transparency into what AGE is thinking
🔍 DIAGNOSTICS PANEL (Optional, Default: OFF)
Detailed signal quality tracking for optimization and debugging:
Panel Structure (3 columns × 8 rows)
Position: Bottom-right corner (doesn't interfere with main dashboard)
Header Row:
Column 0: "🔍 DIAGNOSTICS"
Column 1: "COUNT"
Column 2: "%"
Metrics Tracked (for selected strategy only):
Total Evaluated:
Every signal that passed initial calculation (direction ≠ 0)
Represents total opportunities considered
✓ Passed:
Signals that passed quality gate and executed
Green color coding
Percentage of evaluated signals
Rejection Breakdown:
⨯ Probability:
Rejected because probability < minimum threshold
Most common rejection reason typically
⨯ Confluence:
Rejected because confluence < minimum required (e.g., only 1 of 3 indicators agreed)
⨯ Trend:
Rejected because signal opposed strong trend
Indicates counter-trend protection working
⨯ Regime:
Rejected because volatile regime detected and probability wasn't high enough to override
Shows regime filter in action
⨯ Volume:
Rejected because volume < 70% of 20-bar average
Indicates volume confirmation requirement
Color Coding:
Passed count: Green (success metric)
Rejection counts: Red (failure metrics)
Percentages: Gray (neutral, informational)
Performance Cost: Slight CPU overhead for tracking counters. Disable when not actively optimizing settings.
How to Use Diagnostics
Scenario 1: Too Few Signals
Evaluated: 200
Passed: 10 (5%)
⨯ Probability: 120 (60%)
⨯ Confluence: 40 (20%)
⨯ Others: 30 (15%)
Diagnosis: Probability threshold too high for this strategy's DNA.
Solution: Lower min probability from 65% to 60%, or allow strategy more time to evolve better DNA.
Scenario 2: Too Many False Signals
Evaluated: 200
Passed: 80 (40%)
Strategy win rate: 45%
Diagnosis: Quality gate too loose, letting low-quality signals through.
Solution: Raise min probability to 70%, or increase min confluence to 3 (all indicators must agree).
Scenario 3: Regime-Specific Issues
⨯ Regime: 90 (45% of rejections)
Diagnosis: Frequent volatile regime detection blocking otherwise good signals.
Solution: Either accept fewer trades during chaos (recommended), or disable regime filter if you want signals regardless of market state.
Optimization Workflow:
Enable diagnostics
Run 200+ bars
Analyze rejection patterns
Adjust settings based on data
Re-run and compare pass rate
Disable diagnostics when satisfied
⚙️ CONFIGURATION GUIDE
🧬 Evolution Engine Settings
Enable AGE Evolution (Default: ON):
ON: Full genetic algorithm (recommended for best results)
OFF: Uses only 4 seed strategies, no spawning/culling (static population for comparison testing)
Max Population (4-12, Default: 8):
Higher = more diversity, more exploration, slower performance
Lower = faster computation, less exploration, risk of premature convergence
Sweet spot: 6-8 for most use cases
4 = minimum for meaningful evolution
12 = maximum before diminishing returns
Min Population (2-4, Default: 3):
Safety floor - system never culls below this count
Prevents population extinction during harsh selection
Should be at least half of max population
Elite Preservation (1-3, Default: 2):
Top N performers completely immune to culling
Ensures best genes always survive
1 = minimal protection, aggressive selection
2 = balanced (recommended)
3 = conservative, slower gene pool turnover
Historical: Spawn Interval (10-100, Default: 30):
Bars between spawning new strategies during historical data
Lower = faster evolution, more exploration
Higher = slower evolution, more evaluation time per strategy
30 bars = ~1-2 hours on 15min chart
Historical: Cull Interval (20-200, Default: 60):
Bars between culling weak strategies during historical data
Should be 2x spawn interval for balanced churn
Lower = aggressive selection pressure
Higher = patient evaluation
Live: Spawn Interval (100-500, Default: 200):
Bars between spawning during live trading
Much slower than historical for stability
Prevents population chaos during live trading
200 bars = ~1.5 trading days on 15min chart
Live: Cull Interval (200-1000, Default: 400):
Bars between culling during live trading
Should be 2x live spawn interval
Conservative removal during live trading
Historical: Mutation Rate (0.05-0.40, Default: 0.20):
Probability each gene mutates during breeding (20% = 2 out of 10 genes on average)
Higher = more exploration, slower convergence
Lower = more exploitation, faster convergence but risk of local optima
20% balances exploration vs exploitation
Live: Mutation Rate (0.02-0.20, Default: 0.08):
Mutation rate during live trading
Much lower for stability (don't want population to suddenly degrade)
8% = mostly inherits parent genes with small tweaks
Mutation Strength (0.05-0.25, Default: 0.12):
How much genes change when mutated (% of gene's total range)
0.05 = tiny nudges (fine-tuning)
0.12 = moderate jumps (recommended)
0.25 = large leaps (aggressive exploration)
Example: If gene range is 0.5-2.0, 12% strength = ±0.18 possible change
📈 Signal Quality Settings
Min Signal Probability (0.55-0.80, Default: 0.65):
Quality gate threshold - signals below this never generate
0.55-0.60 = More signals, accept lower confidence (higher risk)
0.65 = Institutional-grade balance (recommended)
0.70-0.75 = Fewer but higher-quality signals (conservative)
0.80+ = Very selective, very few signals (ultra-conservative)
Min Confluence Score (1-3, Default: 2):
Required indicator agreement before signal generates
1 = Any single indicator can trigger (not recommended - too many false signals)
2 = Requires 2 of 3 indicators agree (RECOMMENDED for balance)
3 = All 3 must agree (very selective, few signals, high quality)
Base Persistence Bars (1-5, Default: 2):
Base bars signal must persist before entry
System adapts automatically:
High probability signals (75%+) enter 1 bar faster
Low probability signals (<68%) need 1 bar more
Trending regime: -1 bar (faster entries)
Volatile regime: +1 bar (more confirmation)
1 = Immediate entry after quality gate (responsive but prone to whipsaw)
2 = Balanced confirmation (recommended)
3-5 = Patient confirmation (slower but more reliable)
Cooldown After Trade (3-20, Default: 8):
Bars to wait after exit before next entry allowed
Prevents overtrading and revenge trading
3 = Minimal cooldown (active trading)
8 = Balanced (recommended)
15-20 = Conservative (position trading)
Entropy Length (10-50, Default: 20):
Lookback period for market order/disorder calculation
Lower = more responsive to regime changes (noisy)
Higher = more stable regime detection (laggy)
20 = works across most timeframes
Momentum Length (5-30, Default: 14):
Period for RSI/ROC calculations
14 = standard (RSI default)
Lower = more signals, less reliable
Higher = fewer signals, more reliable
Structure Length (20-100, Default: 50):
Lookback for support/resistance swing range
20 = short-term swings (day trading)
50 = medium-term structure (recommended)
100 = major structure (position trading)
Trend EMA Length (20-100, Default: 50):
EMA period for trend detection and direction bias
20 = short-term trend (responsive)
50 = medium-term trend (recommended)
100 = long-term trend (position trading)
ATR Period (5-30, Default: 14):
Period for volatility measurement
14 = standard ATR
Lower = more responsive to vol changes
Higher = smoother vol calculation
📊 Volatility Scaling (DVS) Settings
Enable DVS (Default: ON):
Dynamic volatility scaling for adaptive stop/target placement
Highly recommended to leave ON
OFF only for testing fixed-distance stops
DVS Method (Default: Ensemble):
ATR Ratio: Simple, fast, single-method (good for beginners)
Parkinson: High-low range based (good for intraday)
Garman-Klass: OHLC based (sophisticated, considers gaps)
Ensemble: Median of all three (RECOMMENDED - most robust)
DVS Memory (20-200, Default: 100):
Lookback for baseline volatility comparison
20 = very responsive to vol changes (can overreact)
100 = balanced adaptation (recommended)
200 = slow, stable baseline (minimizes false vol signals)
DVS Sensitivity (0.3-1.5, Default: 0.7):
How much volatility affects scaling (power-law exponent)
0.3 = Conservative, heavily dampens vol impact (cube root)
0.5 = Moderate dampening (square root)
0.7 = Balanced response (recommended)
1.0 = Linear, full 1:1 vol response
1.5 = Aggressive, amplified response (exponential)
🔬 Walk-Forward Optimization Settings
Enable WFO (Default: ON):
Out-of-sample validation to prevent overfitting
Highly recommended to leave ON
OFF only for testing or if you want unvalidated strategies
Training Window (100-500, Default: 250):
Bars for in-sample optimization
100 = fast validation, less data (risky)
250 = balanced (recommended) - about 1-2 months on daily, 1-2 weeks on 15min
500 = patient validation, more data (conservative)
Testing Window (30-200, Default: 75):
Bars for out-of-sample validation
Should be ~30% of training window
30 = minimal test (fast validation)
75 = balanced (recommended)
200 = extensive test (very conservative)
Min Trades for Validation (3-15, Default: 5):
Required trades in BOTH training AND testing periods
3 = minimal sample (risky, fast validation)
5 = balanced (recommended)
10+ = conservative (slow validation, high confidence)
WFO Efficiency Threshold (0.3-0.9, Default: 0.55):
Minimum test/train performance ratio required
0.30 = Very loose (test must be 30% as good as training)
0.55 = Balanced (recommended) - test must be 55% as good
0.70+ = Strict (test must closely match training)
Higher = fewer validated strategies, lower risk of overfitting
🎨 Premium Visuals Settings
Visual Theme:
Neon Genesis: Cyberpunk aesthetic (cyan/magenta/purple)
Carbon Fiber: Industrial look (blue/red/gray)
Quantum Blue: Quantum computing (blue/purple/pink)
Aurora: Northern lights (teal/orange/purple)
⚡ Gradient Probability Cloud (Default: ON):
Multi-layer gradient showing signal buildup
Turn OFF if chart lags or for cleaner look
Cloud Gradient Layers (3-15, Default: 7):
More layers = smoother gradient, more CPU intensive
Fewer layers = faster, blockier appearance
🎗️ Population Fitness Ribbon (Default: ON):
Histogram showing fitness distribution
Turn OFF for cleaner chart
Ribbon Layers (5-20, Default: 10):
More layers = finer fitness detail
Fewer layers = simpler histogram
⭕ Signal Confidence Halo (Default: ON):
Circular indicator around entry signals
Size/brightness scales with probability
Minimal performance cost
🔬 Evolution Event Markers (Default: ON):
Diamond (spawn) and X (cull) markers
Shows genetic algorithm activity
Minimal performance cost
🎯 Stop/Target Lines (Default: ON):
Shows shadow portfolio stop/target levels
Turn OFF for cleaner chart (recommended for screenshots/presentations)
📊 Enhanced Dashboard (Default: ON):
Comprehensive metrics panel
Should stay ON unless you want zero overlays
🔍 Diagnostics Panel (Default: OFF):
Detailed signal rejection tracking
Turn ON when optimizing settings
Turn OFF during normal use (slight performance cost)
📈 USAGE WORKFLOW - HOW TO USE THIS INDICATOR
Phase 1: Initial Setup & Learning
Add AGE to your chart
Recommended timeframes: 15min, 30min, 1H (best signal-to-noise ratio)
Works on: 5min (day trading), 4H (swing trading), Daily (position trading)
Load 1000+ bars for sufficient evolution history
Let the population evolve (100+ bars minimum)
First 50 bars: Random exploration, poor results expected
Bars 50-150: Population converging, fitness improving
Bars 150+: Stable performance, validated strategies emerging
Watch the dashboard metrics
Population should grow toward max capacity
Generation number should advance regularly
Validated strategies counter should increase
Best fitness should trend upward toward 0.50-0.70 range
Observe evolution markers
Diamond markers (cyan) = new strategies spawning
X markers (red) = weak strategies being culled
Frequent early activity = healthy evolution
Activity slowing = population stabilizing
Be patient. Evolution takes time. Don't judge performance before 150+ bars.
Phase 2: Signal Observation
Watch signals form
Gradient cloud builds up 2-3 bars before entry
Cloud brightness = probability strength
Cloud thickness = signal persistence
Check signal quality
Look at confidence halo size when entry marker appears
Large bright halo = elite setup (85%+)
Medium halo = strong setup (75-85%)
Small halo = good setup (65-75%)
Verify market conditions
Check trend EMA color (green = uptrend, red = downtrend, gray = choppy)
Check background tint (green = trending, red = volatile, clear = choppy)
Trending background + aligned signal = ideal conditions
Review dashboard signal status
Current Signal column shows:
Status (Long/Short/Forming/Waiting)
Confidence % (actual probability value)
Quality assessment (Elite/Strong/Good)
Confluence score (2/3 or 3/3 preferred)
Only signals meeting ALL quality gates appear on chart. If you're not seeing signals, population is either still learning or market conditions aren't suitable.
Phase 3: Manual Trading Execution
When Long Signal Fires:
Verify confidence level (dashboard or halo size)
Confirm trend alignment (EMA sloping up, green color)
Check regime (preferably trending or choppy, avoid volatile)
Enter long manually on your broker platform
Set stop loss at displayed stop line level (if lines enabled), or use your own risk management
Set take profit at displayed target line level, or trail manually
Monitor position - exit if X marker appears (signal reversal)
When Short Signal Fires:
Same verification process
Confirm downtrend (EMA sloping down, red color)
Enter short manually
Use displayed stop/target levels or your own
AGE tells you WHEN and HOW CONFIDENT. You decide WHETHER and HOW MUCH.
Phase 4: Set Up Alerts (Never Miss a Signal)
Right-click on indicator name in legend
Select "Add Alert"
Choose condition:
"AGE Long" = Long entry signal fired
"AGE Short" = Short entry signal fired
"AGE Exit" = Position reversal/exit signal
Set notification method:
Sound alert (popup on chart)
Email notification
Webhook to phone/trading platform
Mobile app push notification
Name the alert (e.g., "AGE BTCUSD 15min Long")
Save alert
Recommended: Set alerts for both long and short, enable mobile push notifications. You'll get alerted in real-time even if not watching charts.
Phase 5: Monitor Population Health
Weekly Review:
Check dashboard Population column:
Active count should be near max (6-8 of 8)
Validated count should be >50% of active
Generation should be advancing (1-2 per week typical)
Check dashboard Performance column:
Aggregate win rate should be >50% (target: 55-65%)
Total P&L should be positive (may fluctuate)
Best fitness should be >0.50 (target: 0.55-0.70)
MAS should be declining slowly (normal adaptation)
Check Active Strategy column:
Selected strategy should be validated (✓ VAL)
Personal fitness should match best fitness
Trade count should be accumulating
Win rate should be >50%
Warning Signs:
Zero validated strategies after 300+ bars = settings too strict or market unsuitable
Best fitness stuck <0.30 = population struggling, consider parameter adjustment
No spawning/culling for 200+ bars = evolution stalled (may be optimal or need reset)
Aggregate win rate <45% sustained = system not working on this instrument/timeframe
Health Check Pass:
50%+ strategies validated
Best fitness >0.50
Aggregate win rate >52%
Regular spawn/cull activity
Selected strategy validated
Phase 6: Optimization (If Needed)
Enable Diagnostics Panel (bottom-right) for data-driven tuning:
Problem: Too Few Signals
Evaluated: 200
Passed: 8 (4%)
⨯ Probability: 140 (70%)
Solutions:
Lower min probability: 65% → 60% or 55%
Reduce min confluence: 2 → 1
Lower base persistence: 2 → 1
Increase mutation rate temporarily to explore new genes
Check if regime filter is blocking signals (⨯ Regime high?)
Problem: Too Many False Signals
Evaluated: 200
Passed: 90 (45%)
Win rate: 42%
Solutions:
Raise min probability: 65% → 70% or 75%
Increase min confluence: 2 → 3
Raise base persistence: 2 → 3
Enable WFO if disabled (validates strategies before use)
Check if volume filter is being ignored (⨯ Volume low?)
Problem: Counter-Trend Losses
⨯ Trend: 5 (only 5% rejected)
Losses often occur against trend
Solutions:
System should already filter trend opposition
May need stronger trend requirement
Consider only taking signals aligned with higher timeframe trend
Use longer trend EMA (50 → 100)
Problem: Volatile Market Whipsaws
⨯ Regime: 100 (50% rejected by volatile regime)
Still getting stopped out frequently
Solutions:
System is correctly blocking volatile signals
Losses happening because vol filter isn't strict enough
Consider not trading during volatile periods (respect the regime)
Or disable regime filter and accept higher risk
Optimization Workflow:
Enable diagnostics
Run 200+ bars with current settings
Analyze rejection patterns and win rate
Make ONE change at a time (scientific method)
Re-run 200+ bars and compare results
Keep change if improvement, revert if worse
Disable diagnostics when satisfied
Never change multiple parameters at once - you won't know what worked.
Phase 7: Multi-Instrument Deployment
AGE learns independently on each chart:
Recommended Strategy:
Deploy AGE on 3-5 different instruments
Different asset classes ideal (e.g., ES futures, EURUSD, BTCUSD, SPY, Gold)
Each learns optimal strategies for that instrument's personality
Take signals from all 5 charts
Natural diversification reduces overall risk
Why This Works:
When one market is choppy, others may be trending
Different instruments respond to different news/catalysts
Portfolio-level win rate more stable than single-instrument
Evolution explores different parameter spaces on each chart
Setup:
Same settings across all charts (or customize if preferred)
Set alerts for all
Take every validated signal across all instruments
Position size based on total account (don't overleverage any single signal)
⚠️ REALISTIC EXPECTATIONS - CRITICAL READING
What AGE Can Do
✅ Generate probability-weighted signals using genetic algorithms
✅ Evolve strategies in real-time through natural selection
✅ Validate strategies on out-of-sample data (walk-forward optimization)
✅ Adapt to changing market conditions automatically over time
✅ Provide comprehensive metrics on population health and signal quality
✅ Work on any instrument, any timeframe, any broker
✅ Improve over time as weak strategies are culled and fit strategies breed
What AGE Cannot Do
❌ Win every trade (typical win rate: 55-65% at best)
❌ Predict the future with certainty (markets are probabilistic, not deterministic)
❌ Work perfectly from bar 1 (needs 100-150 bars to learn and stabilize)
❌ Guarantee profits under all market conditions
❌ Replace your trading discipline and risk management
❌ Execute trades automatically (this is an indicator, not a strategy)
❌ Prevent all losses (drawdowns are normal and expected)
❌ Adapt instantly to regime changes (re-learning takes 50-100 bars)
Performance Realities
Typical Performance After Evolution Stabilizes (150+ bars):
Win Rate: 55-65% (excellent for trend-following systems)
Profit Factor: 1.5-2.5 (realistic for validated strategies)
Signal Frequency: 5-15 signals per 100 bars (quality over quantity)
Drawdown Periods: 20-40% of time in equity retracement (normal trading reality)
Max Consecutive Losses: 5-8 losses possible even with 60% win rate (probability says this is normal)
Evolution Timeline:
Bars 0-50: Random exploration, learning phase - poor results expected, don't judge yet
Bars 50-150: Population converging, fitness climbing - results improving
Bars 150-300: Stable performance, most strategies validated - consistent results
Bars 300+: Mature population, optimal genes dominant - best results
Market Condition Dependency:
Trending Markets: AGE excels - clear directional moves, high-probability setups
Choppy Markets: AGE struggles - fewer signals generated, lower win rate
Volatile Markets: AGE cautious - higher rejection rate, wider stops, fewer trades
Market Regime Changes:
When market shifts from trending to choppy overnight
Validated strategies can become temporarily invalidated
AGE will adapt through evolution, but not instantly
Expect 50-100 bar re-learning period after major regime shifts
Fitness may temporarily drop then recover
This is NOT a holy grail. It's a sophisticated signal generator that learns and adapts using genetic algorithms. Your success depends on:
Patience during learning periods (don't abandon after 3 losses)
Proper position sizing (risk 0.5-2% per trade, not 10%)
Following signals consistently (cherry-picking defeats statistical edge)
Not abandoning system prematurely (give it 200+ bars minimum)
Understanding probability (60% win rate means 40% of trades WILL lose)
Respecting market conditions (trending = trade more, choppy = trade less)
Managing emotions (AGE is emotionless, you need to be too)
Expected Drawdowns:
Single-strategy max DD: 10-20% of equity (normal)
Portfolio across multiple instruments: 5-15% (diversification helps)
Losing streaks: 3-5 consecutive losses expected periodically
No indicator eliminates risk. AGE manages risk through:
Quality gates (rejecting low-probability signals)
Confluence requirements (multi-indicator confirmation)
Persistence requirements (no knee-jerk reactions)
Regime awareness (reduced trading in chaos)
Walk-forward validation (preventing overfitting)
But it cannot prevent all losses. That's inherent to trading.
🔧 TECHNICAL SPECIFICATIONS
Platform: TradingView Pine Script v5
Indicator Type: Overlay indicator (plots on price chart)
Execution Type: Signals only - no automatic order placement
Computational Load:
Moderate to High (genetic algorithms + shadow portfolios)
8 strategies × shadow portfolio simulation = significant computation
Premium visuals add additional load (gradient cloud, fitness ribbon)
TradingView Resource Limits (Built-in Caps):
Max Bars Back: 500 (sufficient for WFO and evolution)
Max Labels: 100 (plenty for entry/exit markers)
Max Lines: 150 (adequate for stop/target lines)
Max Boxes: 50 (not heavily used)
Max Polylines: 100 (confidence halos)
Recommended Chart Settings:
Timeframe: 15min to 1H (optimal signal/noise balance)
5min: Works but noisier, more signals
4H/Daily: Works but fewer signals
Bars Loaded: 1000+ (ensures sufficient evolution history)
Replay Mode: Excellent for testing without risk
Performance Optimization Tips:
Disable gradient cloud if chart lags (most CPU intensive visual)
Disable fitness ribbon if still laggy
Reduce cloud layers from 7 to 3
Reduce ribbon layers from 10 to 5
Turn off diagnostics panel unless actively tuning
Close other heavy indicators to free resources
Browser/Platform Compatibility:
Works on all modern browsers (Chrome, Firefox, Safari, Edge)
Mobile app supported (full functionality on phone/tablet)
Desktop app supported (best performance)
Web version supported (may be slower on older computers)
Data Requirements:
Real-time or delayed data both work
No special data feeds required
Works with TradingView's standard data
Historical + live data seamlessly integrated
🎓 THEORETICAL FOUNDATIONS
AGE synthesizes advanced concepts from multiple disciplines:
Evolutionary Computation
Genetic Algorithms (Holland, 1975): Population-based optimization through natural selection metaphor
Tournament Selection: Fitness-based parent selection with diversity preservation
Crossover Operators: Fitness-weighted gene recombination from two parents
Mutation Operators: Random gene perturbation for exploration of new parameter space
Elitism: Preservation of top N performers to prevent loss of best solutions
Adaptive Parameters: Different mutation rates for historical vs. live phases
Technical Analysis
Support/Resistance: Price structure within swing ranges
Trend Following: EMA-based directional bias
Momentum Analysis: RSI, ROC, MACD composite indicators
Volatility Analysis: ATR-based risk scaling
Volume Confirmation: Trade activity validation
Information Theory
Shannon Entropy (1948): Quantification of market order vs. disorder
Signal-to-Noise Ratio: Directional information vs. random walk
Information Content: How much "information" a price move contains
Statistics & Probability
Walk-Forward Analysis: Rolling in-sample/out-of-sample optimization
Out-of-Sample Validation: Testing on unseen data to prevent overfitting
Monte Carlo Principles: Shadow portfolio simulation with realistic execution
Expectancy Theory: Win rate × avg win - loss rate × avg loss
Probability Distributions: Signal confidence quantification
Risk Management
ATR-Based Stops: Volatility-normalized risk per trade
Volatility Regime Detection: Market state classification (trending/choppy/volatile)
Drawdown Control: Peak-to-trough equity measurement
R-Multiple Normalization: Performance measurement in risk units
Machine Learning Concepts
Online Learning: Continuous adaptation as new data arrives
Fitness Functions: Multi-objective optimization (win rate + expectancy + drawdown)
Exploration vs. Exploitation: Balance between trying new strategies and using proven ones
Overfitting Prevention: Walk-forward validation as regularization
Novel Contribution:
AGE is the first TradingView indicator to apply genetic algorithms to real-time indicator parameter optimization while maintaining strict anti-overfitting controls through walk-forward validation.
Most "adaptive" indicators simply recalibrate lookback periods or thresholds. AGE evolves entirely new strategies through competitive selection - it's not parameter tuning, it's Darwinian evolution of trading logic itself.
The combination of:
Genetic algorithm population management
Shadow portfolio simulation for realistic fitness evaluation
Walk-forward validation to prevent overfitting
Multi-indicator confluence for signal quality
Dynamic volatility scaling for adaptive risk
...creates a system that genuinely learns and improves over time while avoiding the curse of curve-fitting that plagues most optimization approaches.
🏗️ DEVELOPMENT NOTES
This project represents months of intensive development, facing significant technical challenges:
Challenge 1: Making Genetics Actually Work
Early versions spawned garbage strategies that polluted the gene pool:
Random gene combinations produced nonsensical parameter sets
Weak strategies survived too long, dragging down population
No clear convergence toward optimal solutions
Solution:
Comprehensive fitness scoring (4 factors: win rate, P&L, expectancy, drawdown)
Elite preservation (top 2 always protected)
Walk-forward validation (unproven strategies penalized 30%)
Tournament selection (fitness-weighted breeding)
Adaptive culling (MAS decay creates increasing selection pressure)
Challenge 2: Balancing Evolution Speed vs. Stability
Too fast = population chaos, no convergence. Too slow = can't adapt to regime changes.
Solution:
Dual-phase timing: Fast evolution during historical (30/60 bar intervals), slow during live (200/400 bar intervals)
Adaptive mutation rates: 20% historical, 8% live
Spawn/cull ratio: Always 2:1 to prevent population collapse
Challenge 3: Shadow Portfolio Accuracy
Needed realistic trade simulation without lookahead bias:
Can't peek at future bars for exits
Must track multiple portfolios simultaneously
Stop/target checks must use bar's high/low correctly
Solution:
Entry on close (realistic)
Exit checks on current bar's high/low (realistic)
Independent position tracking per strategy
Cooldown periods to prevent unrealistic rapid re-entry
ATR-normalized P&L (R-multiples) for fair comparison across volatility regimes
Challenge 4: Pine Script Compilation Limits
Hit TradingView's execution limits multiple times:
Too many array operations
Too many variables
Too complex conditional logic
Solution:
Optimized data structures (single DNA array instead of 8 separate arrays)
Minimal visual overlays (only essential plots)
Efficient fitness calculations (vectorized where possible)
Strategic use of barstate.islast to minimize dashboard updates
Challenge 5: Walk-Forward Implementation
Standard WFO is difficult in Pine Script:
Can't easily "roll forward" through historical data
Can't re-optimize strategies mid-stream
Must work in real-time streaming environment
Solution:
Age-based phase detection (first 250 bars = training, next 75 = testing)
Separate metric tracking for train vs. test
Efficiency calculation at fixed interval (after test period completes)
Validation flag persists for strategy lifetime
Challenge 6: Signal Quality Control
Early versions generated too many signals with poor win rates:
Single indicators produced excessive noise
No trend alignment
No regime awareness
Instant entries on single-bar spikes
Solution:
Three-layer confluence system (entropy + momentum + structure)
Minimum 2-of-3 agreement requirement
Trend alignment checks (penalty for counter-trend)
Regime-based probability adjustments
Persistence requirements (signals must hold multiple bars)
Volume confirmation
Quality gate (probability + confluence thresholds)
The Result
A system that:
Truly evolves (not just parameter sweeps)
Truly validates (out-of-sample testing)
Truly adapts (ongoing competition and breeding)
Stays within TradingView's platform constraints
Provides institutional-quality signals
Maintains transparency (full metrics dashboard)
Development time: 3+ months of iterative refinement
Lines of code: ~1500 (highly optimized)
Test instruments: ES, NQ, EURUSD, BTCUSD, SPY, AAPL
Test timeframes: 5min, 15min, 1H, Daily
🎯 FINAL WORDS
The Adaptive Genesis Engine is not just another indicator - it's a living system that learns, adapts, and improves through the same principles that drive biological evolution. Every bar it observes adds to its experience. Every strategy it spawns explores new parameter combinations. Every strategy it culls removes weakness from the gene pool.
This is evolution in action on your charts.
You're not getting a static formula locked in time. You're getting a system that thinks , that competes , that survives through natural selection. The strongest strategies rise to the top. The weakest die. The gene pool improves generation after generation.
AGE doesn't claim to predict the future - it adapts to whatever the future brings. When markets shift from trending to choppy, from calm to volatile, from bullish to bearish - AGE evolves new strategies suited to the new regime.
Use it on any instrument. Any timeframe. Any market condition. AGE will adapt.
This indicator gives you the pure signal intelligence. How you choose to act on it - position sizing, risk management, execution discipline - that's your responsibility. AGE tells you when and how confident . You decide whether and how much .
Trust the process. Respect the evolution. Let Darwin work.
"In markets, as in nature, it is not the strongest strategies that survive, nor the most intelligent - but those most responsive to change."
Taking you to school. — Dskyz, Trade with insight. Trade with anticipation.
— Happy Holiday's

Tremor Tracker [theUltimator5]Tremor Tracker is a volatility monitoring tool that visualizes the "tremors" of price action by measuring and analyzing the average volatility of the current trading range, working on any timeframe. This indicator is designed to help traders detect when the market is calm, when volatility is building, and when it enters a potentially unstable or explosive state by using a lookback period to determine the average volatility and highlights outliers.
🔍 What It Does
Calculates bar-level volatility as the percentage difference between the high and low of each candle.
Applies a user-selected moving average (SMA, EMA, or WMA) to smooth out short-term noise and highlight trends in volatility.
Compares current volatility to its long-term average over a configurable lookback period.
Dynamically colors each volatility bar based on how extreme it is relative to historical behavior:
🟢 Lime — Low volatility (subdued, ranging conditions)
🟡 Yellow — Moderate or building volatility
🟣 Fuchsia — Elevated or explosive volatility
⚙️ Customizable Settings
Low Volatility Limit and High Volatility Limit: Define the thresholds for color changes based on volatility's ratio to its average.
Volatility MA Length: Adjust the smoothing period for the volatility moving average.
Average Volatility Lookback: Set how many bars are used to calculate the long-term average.
MA Type: Choose between SMA, EMA, or WMA for smoothing.
Show Volatility MA Line?: Toggle the display of the smoothed volatility trendline.
Show Raw Volatility Bars?: Toggle the display of raw per-bar volatility with dynamic coloring.
🧠 Use Cases
Identify breakout conditions: When volatility spikes above average, it may signal the onset of a new trend or a news-driven breakout.
Avoid chop zones: Prolonged periods of low volatility often precede sharp moves — a classic “calm before the storm” setup.
Timing reversion trades: Detect overextended conditions when volatility is well above historical norms.
Adapt strategies by volatility regime: Use color feedback to adjust risk, position sizing, or strategy selection based on real-time conditions.
📌 Notes
Volatility is expressed as a percentage, making this indicator suitable for use across different timeframes and asset classes.
The tool is designed to be visually intuitive, so traders can quickly spot evolving volatility states without diving into raw numbers.
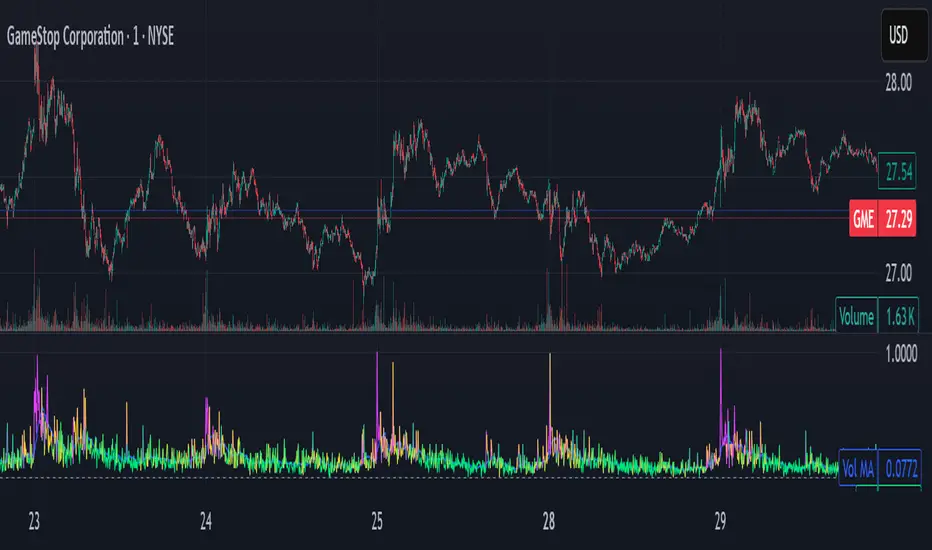
OG ATR RangeDescription:
The OG ATR Tool is a clean, visualized version of the Average True Range indicator for identifying volatility, stop-loss levels, and realistic price movement expectations.
How it works:
Calculates the average range (in points/pips) of recent candles.
Overlays ATR bands to help define breakout potential or squeeze zones.
Can be used to size trades or set dynamic stop-loss and target levels.
Best for:
Intraday traders who want to avoid unrealistic targets.
Volatility-based setups and breakout strategies.
Creating position sizing rules based on instrument volatility.
Pro Tip: Combine with your trend indicators to set sniper entries and exits that respect volatility.