Cumulative Price AverageThe Cumulative Price Average (CPA) indicator calculates and plots the overall average of candlestick prices, providing a smoothed representation of the market's long-term price trend. This is achieved by aggregating the averages of each candle (Open, High, Low, Close) and dynamically updating the overall average as new candles are added.
Key Features
Long-Term Price Perspective: Displays the cumulative average of all candles from the start of the chart.
Trend Visualization: Smooths out short-term price fluctuations to highlight the overall trend.
Dynamic Updates: The average adjusts with each new bar for real-time analysis.
Usage
Trend Analysis:
Identify long-term bullish or bearish trends by observing the slope of the CPA line.
Support/Resistance:
The CPA line can act as a dynamic support or resistance level for the price.
Price Comparison:
Compare the current price to the CPA to assess whether the market is overbought or oversold relative to its historical average.
This indicator is especially useful for traders seeking to incorporate a historical perspective into their analysis, providing insights into the broader market behavior beyond short-term volatility.
Cerca negli script per "Volatility"

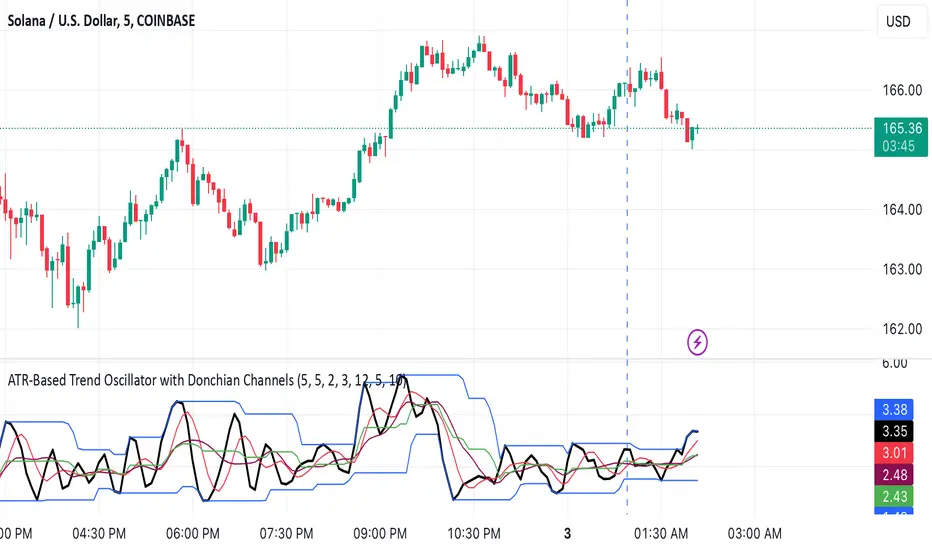
ATR-Based Trend Oscillator with Donchian ChannelsThis script, my Magnum Opus, combines the best elements of trend detection into a powerful ATR-based trend strength oscillator. It has been meticulously engineered to give traders a consistent edge in trend analysis across any asset, including highly volatile markets like crypto and forex. The oscillator normalizes trend strength as a percentage of ATR, smoothing out noise and allowing the oscillator to remain highly responsive while adapting to varying asset volatility.
Key Features:
ATR-Based Oscillator: Measures trend strength in relation to Average True Range, which enhances accuracy and consistency across different assets. By normalizing to ATR, the oscillator produces stable and reliable values that capture shifts in trend momentum effectively.
Dual Moving Averages for Smoothing: This script features two customizable moving averages to help confirm trend direction and strength, making it adaptable for short- and long-term analysis alike.
Donchian Channels for Strength Bounds: A Donchian Channel over the smoothed trend strength oscillator visually bounds strength levels, enabling traders to spot breakout points or reversals quickly.
Ideal for Multi-Asset Trading: The versatility of this indicator makes it a perfect choice across various asset classes, from stocks to forex and cryptocurrencies, maintaining consistency in signals and reliability.
Suggested Pairing: Use this oscillator alongside a directional indicator, such as the Vortex Indicator, to confirm trend direction. This pairing allows traders to understand not only the strength but also the direction of the trend for optimized entry and exit points.
Why This Indicator Will Elevate Your Trading: This trend strength oscillator has been refined to provide clarity and edge for any trader. By incorporating ATR-based normalization, it maintains accuracy in volatile and steady markets alike. The Donchian Channels add structure to trend strength, giving clear overbought and oversold signals, while the two moving averages ensure that lag is minimized without sacrificing accuracy.
Whether you're scalping or trend-trading, this oscillator will enhance your ability to detect and interpret trend strength, making it an essential tool in any trading arsenal.
Volume CVD and Open InterestVolume, Cumulative Delta Volume and Open Interest are great indications of strength and sentiment in the market. Until now they have required separate indicators, but this indicator can show them all.
With a clean and aesthetic plot, this indicator has the option to choose the data source:
- Volume - the total volume of transactions, buys and sells
- Up Volume - the total volume from buys only
- Down Volume - the total volume from sells only
- Up/Down Volume (Net) - the difference in the Buy Volume and Sell Volume
- Cumulative Delta - the sum of the up/down volume for the previous 14 bars
- Cumulative Delta EMA - a smoothed average of the sum of the up/down volume for the previous 14 bars, over a 14 period EMA
- Open Interest - a user defined ticker, whose value is added to the plot, while this is designed to be used with Open Interest tickers, you can actually choose any ticker you want, perhaps you want to see DXY while charting Bitcoin!
There are several customization features for the colour of the plot, with a nice gradient colouring from high to low. You can choose the lookback which defines only the highest and lowest values for the colour gradient. There is also an option for how the Open Interest value is determined, based on Close, Open or differences between previous values.
While similar, Volume and Open Interest are not the same. To me the simplest explanation is Volume shows the trades that have been executed and the buy/sell direction, while Open Interest shows the value of open trades that are yet to be completed.
Volume shows strength, sentiment and volatility.
Open Interest does not show direction, but does indicate momentum and liquidity in the market.

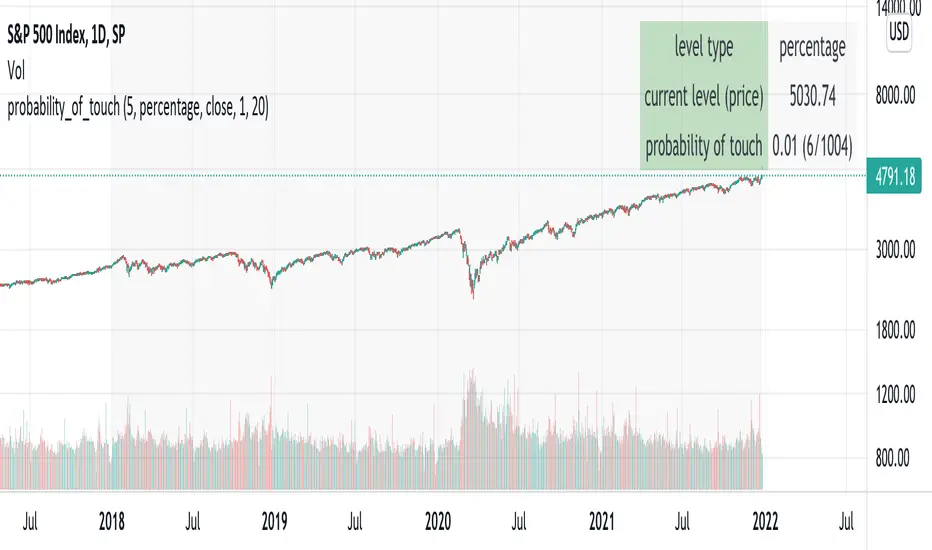
probability_of_touchBased on historical data (rather than theory), calculates the probability of a price level being "touched" within a given time frame. A "touch" means that price exceeded that level at some point. The parameters are:
- level: the "level" to be touched. it can be a number of points, percentage points, or standard deviations away from the mark price. a positive level is above the mark price, and a negative level is below the mark price.
- type: determines the meaning of the "level" parameter. "price" means price points (i.e. the numbers you see on the chart). "percentage" is expressed as a whole number, not a fraction. "stdev" means number of standard deviations, which is computed from recent realized volatlity.
- mark: the point from which the "level" is measured.
- length: the number of days within which the level must be touched.
- window: the number of days used to compute realized volatility. this parameter is only used when "type" is "stdev".
- debug: displays a fuchsia "X" over periods that touched the level. note that only a limited number of labels can be drawn.
- start: only include data after this time in the calculation.
- end: only include data before this time in the calculation.
Example: You want to know how many times Apple stock fell $1 from its closing price the next day, between 2020-02-26 and today. Use the following parameters:
level: -1
type: price
mark: close
length: 1
window:
debug:
start: 2020-02-26
end:
How does the script work? On every bar, the script looks back "length" days and sees if any day exceeded the "mark" price from "length" days ago, plus the limit. The probability is the ratio of such periods wherein price exceeded the limit to the total number of periods.
Jurik Bands//A follow up for my JMA script. This script is inspired by (and dedicated to) closure of sales (today, Oct 20 '21) of the famous Jurik Research.
...
Jurik Research, the real people who been doing real things by using the real instruments, while many others been reading books "How to become a billionaire in 2 days", watching 5687 hours videos of how to use RSI , and studying+applying machine learning to everything cuz suddenly it became trendy xD
...
In my JMA script I've said that JMA takes into account volatility. But how exactly? In fact, it's based on smth called Jurik Bands. Thing is they can be/should be used as an independent instrument. I won't lie, I've developed smth very similar myself for mean-reverting purposes, but we ain't gonna talk about this now (my stuff is much simpler, saying bye-bye to entropy).
...
The code is on purpose in Pine4, because lmao I'm not gonna call my stuff "Indicators", they don't "Indicate" anything. And it's on purpose doesn't follow any "coding conventions" made by geeks to make their stuff look more important. My conventions are simple: less code as possible and as simple as possible so we can actually do business based on these instruments.
...
Live Long And Prosper
Single Prints - Session Initial BalancesDisclaimer: Expose yourself to the knowledge of different trading methods. If you are unaware of what a Single Print is then do some research and broaden your knowledge.
This indicator has only been tested on BTCUSDT Binance pair. This indicator is meant to be used on the 30 minute timeframe to highlight Single Prints.
The calculations are base on 0000 UTC and what Single Prints are created during that day.
Single Prints
Single Prints are where prices moves to fast through an area (on a 30 minute timeframe), in the case of this indicator in $50 intervals, where the price has not yet cross back past, represented as orange lines. If you were viewing this on a Time Price Opportunity Chart (TPO) each $50 would be represented as a square with a letter in it. If price has only been through that area once, within that 24 hour period, then it is called a Single Print. If however the Single Print is on the lower wick of the candle it is called a Buying Tail and on the Upper Wick a Selling Tail.
Single Prints leave low volume nodes with liquidity gaps, these inefficient moves tend to get filled, and we can seek trading opportunities once they get filled, or we can also enter before they get filled and use these single prints as targets.
Single Prints are a sign of emotional buying or selling as very little time was spent at those levels and thus there is no value there.
The endpoints of single print sections are considered to be potential support or resistance points and or get filled (like a CME gap).
The above is only a very short summary, to understand Single Prints, Buying Tails and Selling Tails more please do your own research (DYOR).
References:
Trading Riot Volume Profile - Website
TOROS TPO Charts Explained - Youtube
Session Boxes
Session Boxes are the high and low of that markets session before the new market session opens. I used the data from the website Trading Hours for the time input.
White box – Start of day UTC 0000 to Market Close UTC 2000
Purple box – Asia Start UTC 0130 to London Start UTC 0700
Yellow box – London Start UTC 0700 to New York Start UTC 1330
Blue box – New York Start UTC 1330 to Market Close UTC 2000
Red box – Market Close UTC 2000 to End of day UTC 2359
References:
Trading Hours - Website
Initial Balance
The Initial Balance is the market range between the high and low of the first hour of trading for the market. In the case of crypto when is the Initial Balance if it is 24/7.
Context of Initial Balance:
The Initial Balance is traditionally the range of prices transacted in the first hour of trade. Many regard the Initial Balance as a significant range because, especially for the index futures which are tied to the underlying stocks, orders entered overnight or before the open are typically executed prior to the end of the first hour of trade. Some use it to understand how the rest of the day may develop, while others use it as a span of time to avoid trading altogether because of its potential volatility.
For this indicator I have coded the Initial Balance time as below:
White Box - To appear for the first hour of the day 0000 to 0100 UTC .
Purple Box - To appear for the first hour of the day 0130 to 0230 UTC .
Yellow Box - To appear for the first hour of the day 0700 to 0800 UTC .
Blue Box - To appear for the first hour of the day 1330 to 1430 UTC .
Red Box - To appear for the first hour of the day 2000 to 2100 UTC .
The diagram above shows some examples:
How price (white arrows) retraces the single prints.
How price (red arrows) uses the single prints as S/R.
References:
Not Hard Trading – Website
My Pivots Initial Balance - Website
Thanks go to:
StackOverFlow Bjorn Mistiaen
Trading View user mvs1231
Please message me if you have any feedback/questions.
I am looking at developing this indicator further in the future.

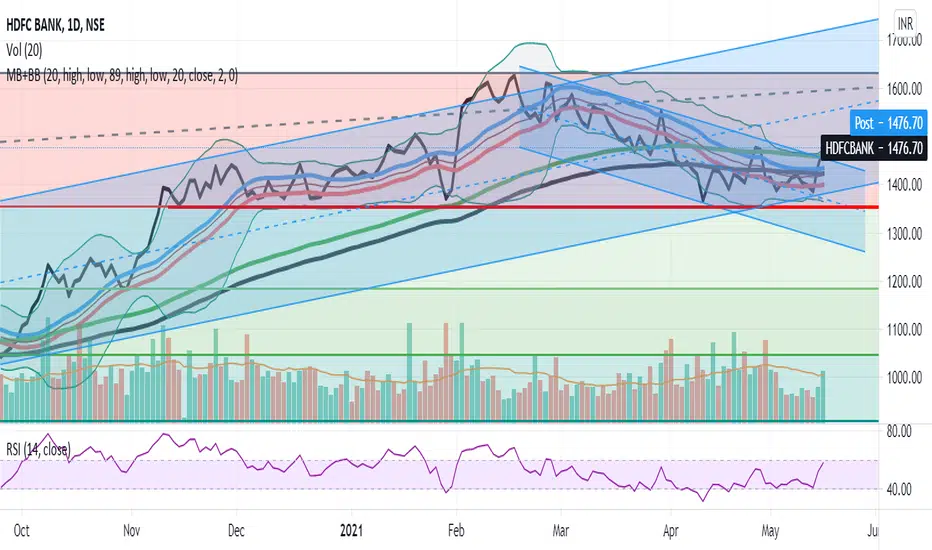
Magic BandBSE:DLF
I have integrated Moving average, Bollinger bands and Exponential moving average. It has two SMA,
The first thing is 20 SMA with blue coloured SMA line source as high and red coloured SMA line source as low, this together forms a band which can be used for a swing trade, usually useful in bull run of the stock and price tries to get support on this band.
the second thing in this is similar to the previous set up but it plots 89 period EMA, this becomes useful in the smaller timeframe when one step larger timeframe is near to 20 SMA band
the third thing is plots of Bollinger band with 20 SMA, which gives us an idea on volatility.
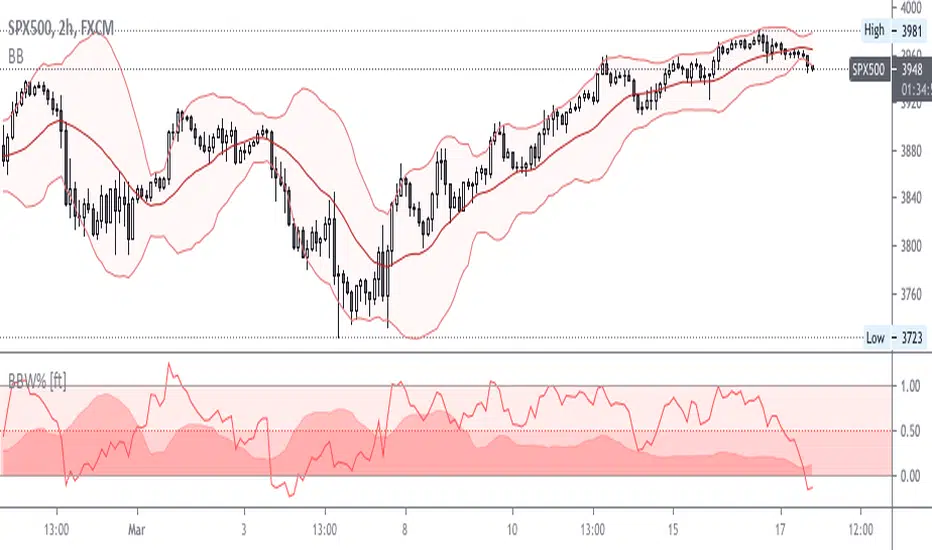
BB Width + %B - All-in-One!Simple and effective script for BB-addicted!
Fully customizable. Clean chart, realtime data.
Add "BBW Multiplier " to adjust width & %D through different mkts volatility.
Default value suites actual S&P.
Enjoy!
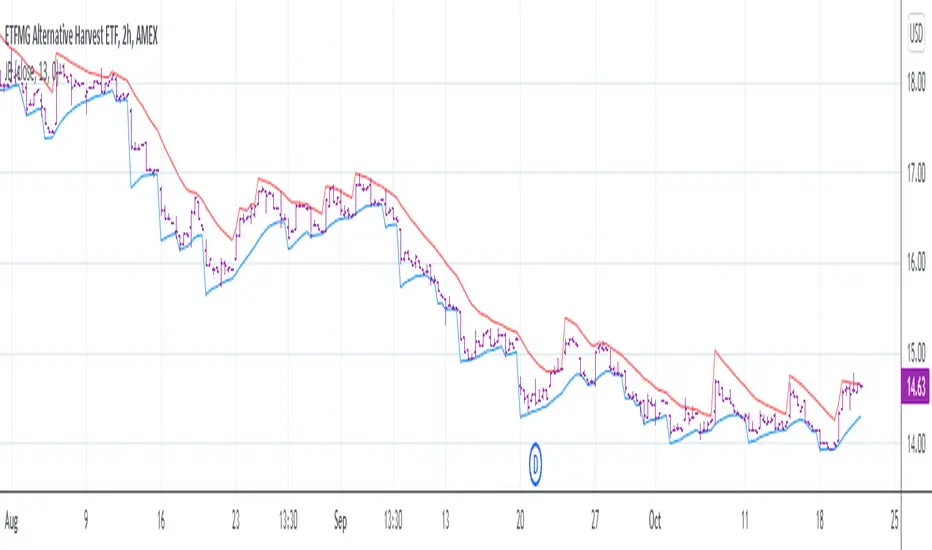
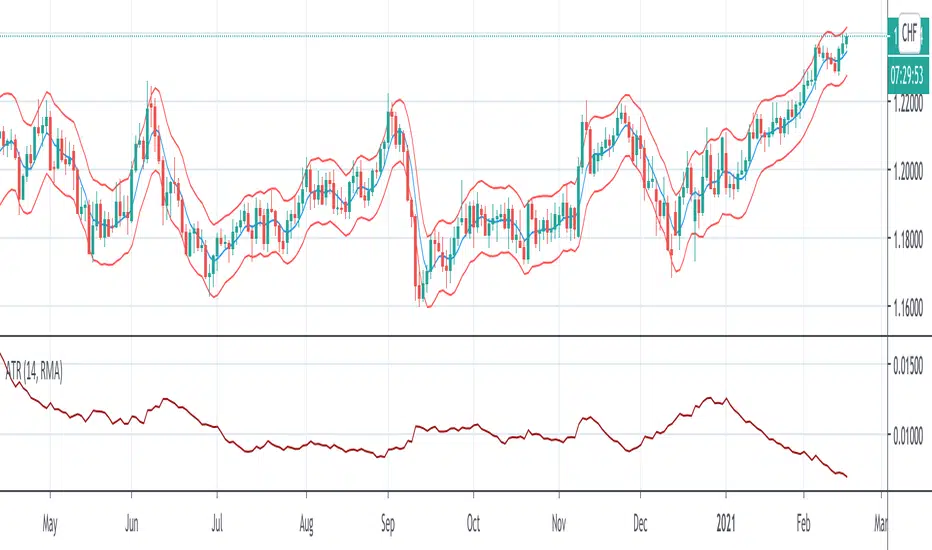
Arnaud Legoux Moving Average With ATR BandsArnaud Legoux Moving Average With ATR Bands to get an idea of the volatility.
True Range Breakout [racer8]TRB (True Range Breakout) plots the current TR (true range) as well as the previous TR high over n periods. If the current TR is greater than the previous TR high, then the TR histogram will become red. Red signals high volatility. Enter trades only when the histogram is above the TR high line. Happy trading! 🥳

AVWTR (Average Volume Weighted True Range)A better tool to measure market volatility. The true ranges are weighted by the volume and averaged through the specified period.

Separated ATR - evoThis script plots two ATR (Average True Range) values, one based on only bullish and the other based on only bearish bars. If the current bar is positive, the negative ATR will use its last known negative bar for the calculation. You can smooth bar directions by using the Heikin Ashi setting.
Use this the same way how you would use the regular ATR indicator, but with the added value of knowing which side of the market has more volatility.

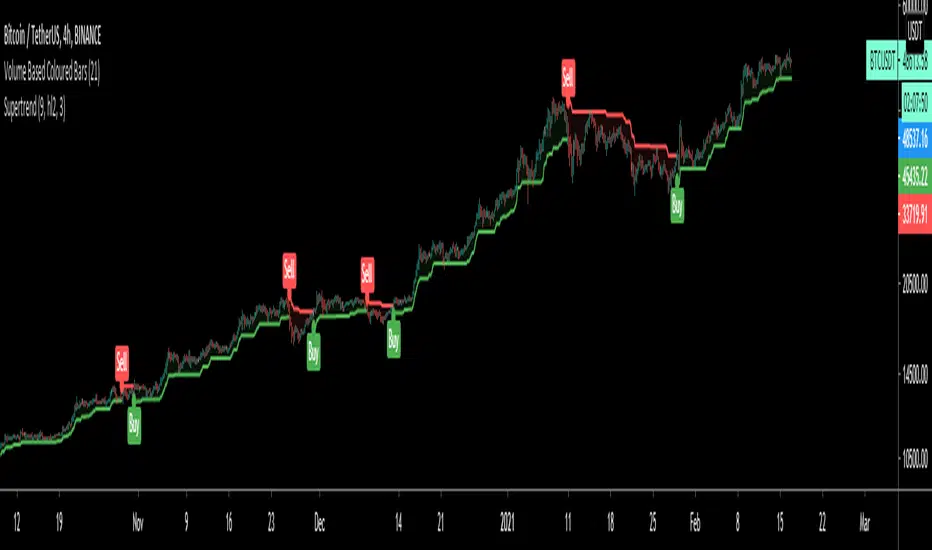
SuperTrendSuperTrend is one of the most common ATR based trailing stop indicators.
In this version you can change the ATR calculation method from the settings. Default method is RMA, when the alternative method is SMA.
The indicator is easy to use and gives an accurate reading about an ongoing trend. It is constructed with two parameters, namely period and multiplier. The default values used while constructing a superindicator are 10 for average true range or trading period and three for its multiplier.
The average true range (ATR) plays an important role in 'Supertrend' as the indicator uses ATR to calculate its value. The ATR indicator signals the degree of price volatility.
The buy and sell signals are generated when the indicator starts plotting either on top of the closing price or below the closing price. A buy signal is generated when the ‘Supertrend’ closes above the price and a sell signal is generated when it closes below the closing price.
It also suggests that the trend is shifting from descending mode to ascending mode. Contrary to this, when a ‘Supertrend’ closes above the price, it generates a sell signal as the colour of the indicator changes into red.
A ‘Supertrend’ indicator can be used on equities, futures or forex, or even crypto markets and also on daily, weekly and hourly charts as well, but generally, it fails in a sideways-moving market.
I had converted Supertrend indicator code for various platforms like Metastock in 2017, but in this TradingView version special credit goes to everget - Alex Orekhov which gave a great inspiration to look my indicators better with highlights, signals and alarms. Thank you Alex.
(Poshtrader) Bollinger Band SqueezeThe Bollinger Band Squeeze is a trading strategy designed to find consolidations with decreasing volatility. In its simplest form, this strategy is neutral and the ensuing break can be up or down. Traders, therefore, must employ other aspects of technical analysis to formulate a trading bias to act before the break or confirm the break. Acting before the break will improve the risk-reward ratio.

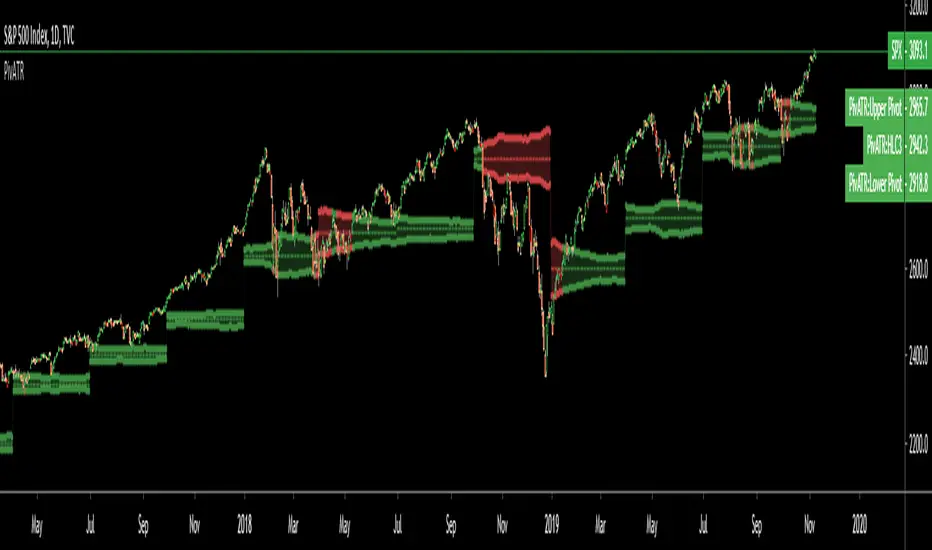
Adaptive Pivot (HLC3)SUMMARY:
Standard Pivot (HLC3) with ATR leeway added to make it adaptive to market volatility.
DESCRIPTION:
Adaptive Pivot is an indicator utilizing the simplicity of HLC3 Pivots as a turning point (and sometimes a trend indicator) while addressing it's fixed and inflexible nature.
Because the indicator is just a single line in the chart, the price may go near it but never touch it. Or it can go pass through it and never retest it again. In an attempt to lessen these from occurring, we can combine pivots with average true range (ATR). This is the specific formula I applied in this indicator:
>Upper Pivot = HLC3 + ATR
>Lower Pivot = HLC3 - ATR
This creates a kind of a range or cloud around the Pivot, making it possibly a more accurate indicator for market turning points.
ADJUSTABLE PARAMETERS:
The usual ATR parameters are included in this indicator:
>ATR_Length = input(14, title="ATR Length", minval=1)
>ATR_Smoothing = input(title="ATR Smoothing", defval="RMA", options="RMA", "SMA", "EMA", "WMA")
Added to the usual ones is this:
>ATR_Multiplier = input(1, title="ATR Multiplier", minval=0.1)
which modifies the extent of the ATR (similar to Chandelier Exit) as it is added/subtracted from the pivot values.
Pivot’s timeframe is also adjustable:
>Pivot_Timeframe = input("3M", title='Pivot Resolution')
Note: I did not lock the type to input.resolution to allow for more possible timeframes.
OTHER PARAMETERS
Indicator color will change to green when the open is above the HLC3 Pivot and change to red when the reverse is true.
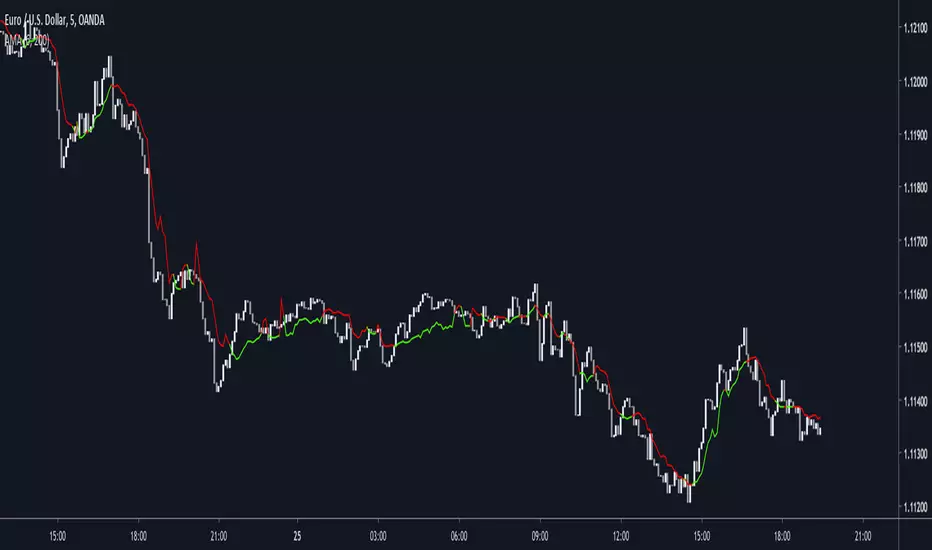
Dynamically Adjustable Moving AverageIntroduction
The Dynamically Adjustable Moving Average (AMA) is an adaptive moving average proposed by Jacinta Chan Phooi M’ng (1) originally provided to forecast Asian Tiger's futures markets. AMA adjust to market condition in order to avoid whipsaw trades as well as entering the trending market earlier. This moving average showed better results than classical methods (SMA20, EMA20, MAC, MACD, KAMA, OptSMA) using a classical crossover/under strategy in Asian Tiger's futures from 2014 to 2015.
Dynamically Adjustable Moving Average
AMA adjust to market condition using a non-exponential method, which in itself is not common, AMA is described as follow :
1/v * sum(close,v)
where v = σ/√σ
σ is the price standard deviation.
v is defined as the Efficacy Ratio (not be confounded with the Efficiency Ratio) . As you can see v determine the moving average period, you could resume the formula in pine with sma(close,v) but in pine its not possible to use the function sma with variables for length, however you can derive sma using cumulation.
sma ≈ d/length where d = c - c_length and c = cum(close)
So a moving average can be expressed as the difference of the cumulated price by the cumulated price length period back, this difference is then divided by length. The length period of the indicator should be short since rounded version of v tend to become less variables thus providing less adaptive results.
AMA in Forex Market
In 2014/2015 Major Forex currencies where more persistent than Asian Tiger's Futures (2) , also most traded currency pairs tend to have a strong long-term positive autocorrelation so AMA could have in theory provided good results if we only focus on the long term dependency. AMA has been tested with ASEAN-5 Currencies (3) and still showed good results, however forex is still a tricky market, also there is zero proof that switching to a long term moving average during ranging market avoid whipsaw trades (if you have a paper who prove it please pm me) .
Conclusion
An interesting indicator, however the idea behind it is far from being optimal, so far most adaptive methods tend to focus more in adapting themselves to market complexity than volatility. An interesting approach would have been to determine the validity of a signal by checking the efficacy ratio at time t . Backtesting could be a good way to see if the indicator is still performing well.
References
(1) J.C.P. M’ng, Dynamically adjustable moving average (AMA’) technical
analysis indicator to forecast Asian Tigers’ futures markets, Physica A (2018),
doi.org
(2) www.researchgate.net
(3) www.ncbi.nlm.nih.gov
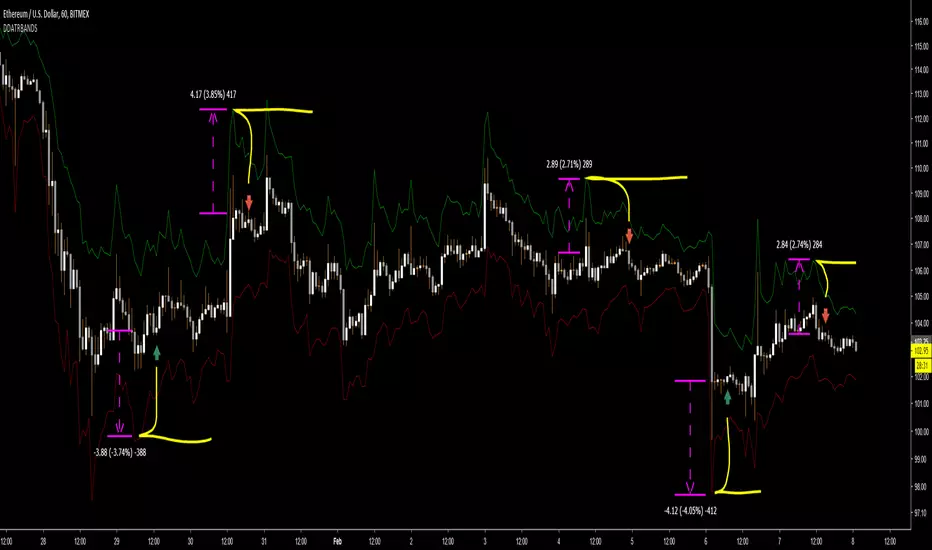
DD ATR bandsThe top band is ATR added to candle high (with given length and multiplication). The bottom one is analogic.
Created for finding initial stop loss for entry on low timeframes. Use band value at last major high/low to place the stop loss at.
It shows prices with acceptable risk and a reasonable margin for market volatility.
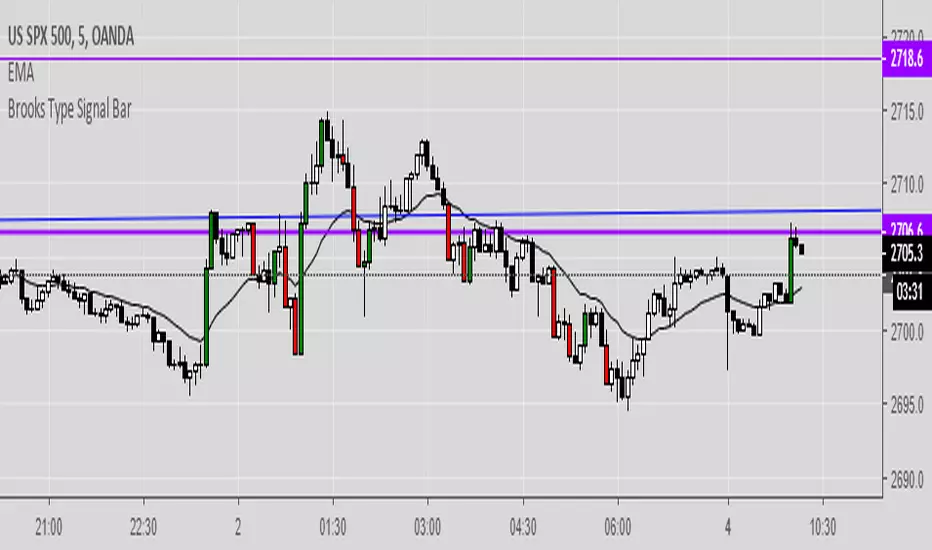
Brooks Type Signal BarIndicates "strong bars" similar to how Al Brooks defines them in his book-- these don't necessarily trigger entries but can be points of interest.
2-3 points as a signal bar size seems to work well, depending upon volatility.
btcATR Bitfinex [csg]A simple script that uses the average true range indicator and compares it against bitcoin's market cap to obtain a visual representation of bitcoin's historical volatility.
A version of this indicator will be made for other coins once tradingview gives us access to the market cap data

Bollinger Band Percent Width Crossing RSIBollinger Band width is hard to follow on log charts, but it's an excellent indicator for volatility. When BBand % width crosses down through periods of low crosses down through periods where RSI is low, you may be able to count on a substantial reversal over the intermediate or long-term.

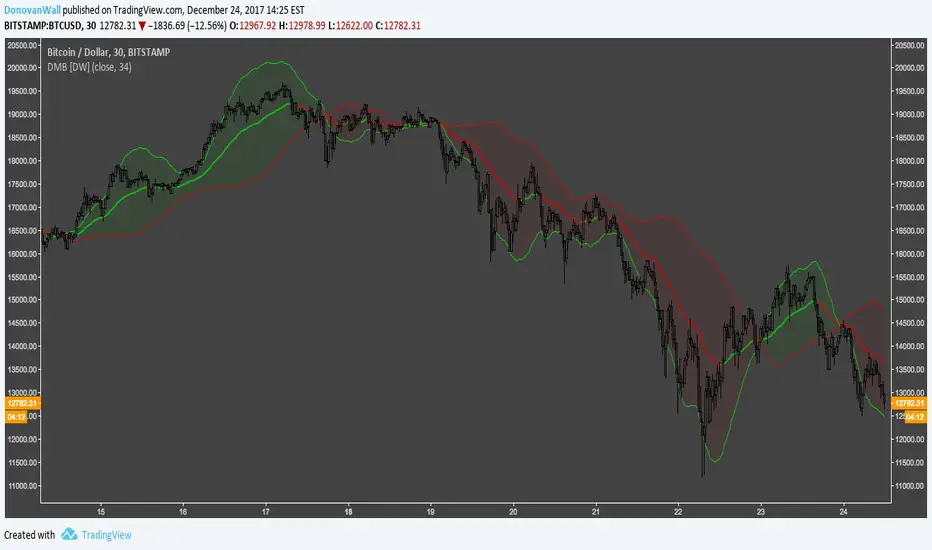
Directional Movement Bands [DW]This is a simple experimental study designed to outline trend activity and volatility.
In this study, the amount of change between current source and source of a specified lookback is calculated, then added to and subtracted from current source.
Next an exponential moving average is taken of the values for smoothing over the specified period.
Lastly, a midline is generated by taking the median of both bands.
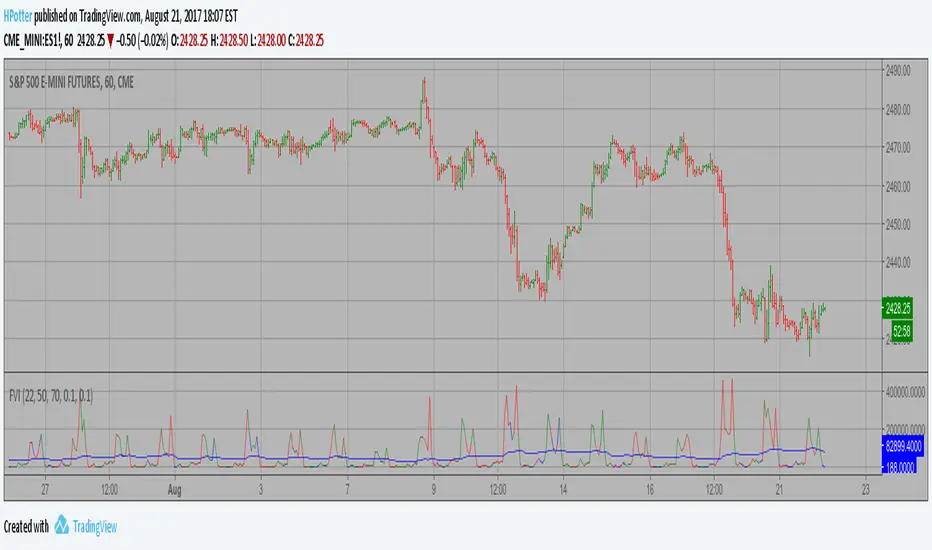
Volatility Finite Volume Elements Strategy The FVE is a pure volume indicator. Unlike most of the other indicators
(except OBV), price change doesn?t come into the equation for the FVE
(price is not multiplied by volume), but is only used to determine whether
money is flowing in or out of the stock. This is contrary to the current trend
in the design of modern money flow indicators. The author decided against a
price-volume indicator for the following reasons:
- A pure volume indicator has more power to contradict.
- The number of buyers or sellers (which is assessed by volume) will be the same,
regardless of the price fluctuation.
- Price-volume indicators tend to spike excessively at breakouts or breakdowns.
This study is an addition to FVE indicator. Indicator plots different-coloured volume
bars depending on volatility.
Moving CO-covariance (covariance on covariance)This is Covariance on Covariance. It shows you how much a given covariance period has deviated from it mean over another defined period. Because it is a time series, It can allow you to spot changes in how covariance changes. You can apply trend lines, Fibonacci retracements, etc. This is also volume weighting covariance.
This is not a directional indicator nor is moving covariance. This is used for forecasting volatility. This must be used in conjunction with moving covariance.