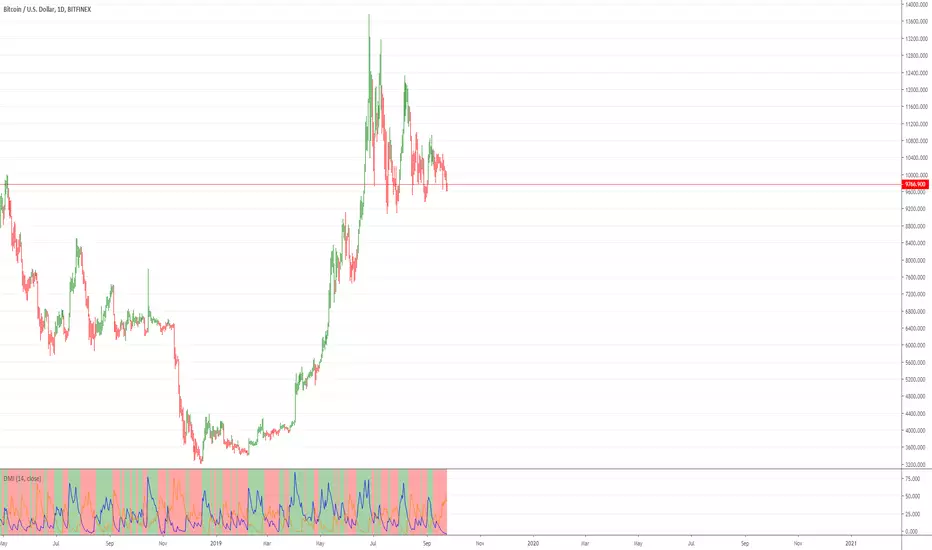
fiercebitraderEl indicador fiercebitrader, es un indicador basado en el Índice Medio de Movimiento Direccional (ADX) es una herramienta de análisis técnico usada para medir la fuerza de la tendencia. El indicador direccional positivo ( DI) y el indicador direccional negativo (-DI) acompañan a la línea ADX. realzando la dirección de la tendencia.
Usados en conjunto forman un sistema de trading que es capaz de determinar tanto la dirección como la fuerza de la tendencia. El indicador consiste en tres líneas: la propia ADX (línea azul), una línea DI (línea verde), y una línea -DI (línea roja). El DI mide la fuerza de la tendencia alcista, mientras que el -DI mide la intensidad del movimiento bajista. La línea ADX muestra la fuerza de la tendencia en general creciendo tanto en las tendencias alcistas como bajistas.
Cuando el DI está por encima del -DI, se dice que los alcistas tienen el dominio direccional. De forma alternativa, cuando el -DI es más alto que el DI, el dominio direccional pertenece a los bajistas.
Es importante entender que el ADX (línea azul) muestra solo la fuerza de la tendencia y no la dirección de la tendencia. La dirección de la tendencia puede en cambio determinarse mirando al DI y el -DI (líneas roja y verde).
¿Cómo usarlo en el trading?
Operar con la tendencia reduce los riesgos e incrementa los beneficios potenciales. Es por esto que muchos traders prefieren consultar la fuerza de la tendencia con ayuda del ADX antes de invertir su dinero. Hay dos formas principales de usar el indicador:
El Cruce de DI
Cuando las líneas direccionales del positivo y negativo se cruzan, normalmente significa que la tendencia está cambiando. Esta información puede usarse para determinar puntos de entrada óptimos. Para los inversores que utilicen este sistema de trading, las señales son las siguientes:
(Compra) cuando el DI cruce el -DI , es mas efectivo, mas fuerte cuando toca o cruza la linea amarilla solida en el nivel de 27 y la tendencia general sea alcista.
El disparo se da en la linea de 20 punteada.
(Venta) cuando el -DI cruce el DI , es mas efectivo, más fuerte cuando toca o cruza la linea amarilla solida en el nivel de 27 y la tendencia sea bajista general sea bajista.
Valor de Fuerza Tendencia ADX
0-20 Tendencia Ausente o Débil
21-26 Disparo
27-50 Tendencia Fuerte
50-75 Tendencia muy Fuerte
75-100 Tendencia Extremadamente Fuerte
El fiercebitrader es un indicador de análisis técnico verdaderamente único, que combinado con otros indicadores, puede convertirse en la estrategia de trading definitiva en manos de un trader.
Recomendado para scalping en temporalidad de 5 min
swing day 1hora. Esta configurado para una operacion optima.
Acompañelo con el indicador bitradertracker.
Con mucho cariño Bitrader4.0
_________________________________
The fiercebitrader indicator, is an indicator based on the Mean Directional Movement Index (ADX) is a technical analysis tool used to measure the strength of the trend. The positive directional indicator (DI) and the negative directional indicator (-DI) accompany the ADX line. enhancing the direction of the trend.
Used together they form a trading system that is able to determine both the direction and strength of the trend. The indicator consists of three lines: the ADX itself (blue line), a DI line (green line), and a -DI line (red line). The DI measures the strength of the uptrend, while the -DI measures the intensity of the bearish movement. The ADX line shows the strength of the overall trend growing in both bullish and bearish trends.
When the DI is above the -DI, it is said that the bulls have the directional domain. Alternatively, when the -DI is higher than the DI, the directional domain belongs to the bears.
It is important to understand that the ADX (blue line) shows only the strength of the trend and not the direction of the trend. The direction of the trend can instead be determined by looking at the DI and the -DI (red and green lines).
How to use it in trading?
Operating with the trend reduces the risks and increases the potential benefits. This is why many traders prefer to consult the strength of the trend with the help of the ADX before investing their money. There are two main ways to use the indicator:
1) The Cross of DI
When the directional lines of the positive and negative intersect, it usually means that the trend is changing. This information can be used to determine optimal entry points. For investors who use this trading system, the signals are the following:
(Buy) when the DI crosses the -DI, it is more effective, stronger when it touches or crosses the solid yellow line at the level of 27 and the general trend is bullish.
The shot is given in the line of 20 dashed.
(Sale) when the -DI crosses the DI, it is more effective, stronger when it touches or crosses the solid yellow line at the level of 27 and the general bearish trend is bearish.
Strength Value ADX Trend
0-20 Absent or Weak Trend
21-26 Shot
27-50 Strong Trend
50-75 Very Strong Trend
75-100 Extremely Strong Trend
The fiercebitrader is a truly unique indicator of technical analysis, which combined with other indicators, can become the definitive trading strategy in the hands of a trader.
Recommended for scalping 5-minute and 1 hour.
It is configured for an optimal operation.
Accompany it with the bitradertracker indicator.
With love Bitrader4.0
Cerca negli script per "adx"

PRO Strategy 3TP (v2.1.1)
English Version
PRO Strategy 3TP (v2.1.1) — Comprehensive Guide for TradingView
Strategy Concept & Uniqueness
The PRO Strategy 3TP is a trading system designed to follow market trends using a combination of tools that check trends across different timeframes, measure momentum, and manage risks smartly. Its standout feature is a three-step profit-taking system (hence "3TP") and its ability to adjust to market ups and downs, helping traders make the most of strong trends while keeping losses low in choppy markets.
Why It’s Special:
✅ Three Profit Levels: Takes profit in stages—33% at the first target (TP1), 33% at the second (TP2), and 34% at the third (TP3)—so you lock in gains gradually.
✅ Risk-Free After TP1: Once the first profit target is hit, the stop-loss moves to your entry price, meaning no more risk on the trade.
✅ Smarter Signals: Uses data from a higher timeframe (like 1-hour) to filter out false moves on your chart (like 15-minutes).
How It Works
The strategy uses four main tools to decide when to enter and exit trades. Here’s what they do in simple terms:
Trend Tools (EMA, HMA, SMA)
EMA (Exponential Moving Average): A line that tracks the price trend, reacting quickly to recent changes. Think of it as a fast guide to where the market’s heading.
Default: EMA 100 (looks at the last 100 bars).
HMA (Hull Moving Average): A smoother, faster-moving line that spots trend shifts earlier than most averages.
Default: HMA 50 (looks at the last 50 bars).
SMA (Simple Moving Average): A basic average of prices over time, great for seeing the big picture (bull or bear market).
Default: SMA 200 (looks at the last 200 bars).
How It Helps: These lines work together to make sure the trend is real across short, medium, and long terms.
Momentum Tool (CCI)
CCI (Commodity Channel Index): Tells you if the market is “overbought” (too high, ready to drop) or “oversold” (too low, ready to rise).
Buy when CCI < -100 (oversold).
Sell when CCI > +100 (overbought).
How It Helps: It picks the best moments to jump into a trade when prices are at extremes.
Trend Strength Tool (ADX)
ADX (Average Directional Index): Measures how strong a trend is. Higher numbers mean a stronger trend.
Default: ADX > 26 (only trades when the trend is strong enough).
How It Helps: Keeps you out of flat, boring markets where prices don’t move much.
Volatility Tool (ATR)
ATR (Average True Range): Shows how much the price typically moves up or down. It’s like a ruler for market “wiggle room.”
Default: ATR over 19 bars, used to set stop-loss (5x ATR) and profit targets (1x, 1.3x, 1.7x ATR).
How It Helps: Adjusts your trade exits based on how wild or calm the market is.
Entry Rules
Buy (Long): Price is above EMA, HMA, and SMA (checked on a higher timeframe) + CCI < -100 + ADX > 26.
Sell (Short): Price is below EMA, HMA, and SMA + CCI > +100 + ADX > 26.
Exit Rules
Stop-Loss: Set at 5x ATR away from your entry (e.g., if ATR is 10 points, stop-loss is 50 points away).
Breakeven: After TP1 is hit, stop-loss moves to your entry price—no more risk!
Profit Targets:
TP1: 1x ATR (closes 33% of your position).
TP2: 1.3x ATR (closes 33%).
TP3: 1.7x ATR (closes 34%).
Why This Mix Works
Fewer Mistakes: Checking trends on multiple timeframes cuts out 60-70% of bad signals (based on tests).
Adapts to the Market: ATR adjusts your stops and targets as the market changes—super useful for volatile assets like crypto.
Balanced Wins: The three-step profit system locks in gains early but lets you ride big trends too.
Setup Guide
Settings for Different Styles
Parameter Scalping (1-15M) Swing (1H-4H) Position (Daily)
EMA/HMA/SMA 50/20/Off 100/50/200 Off/Off/200
ADX Threshold 20 26 25
ATR Multipliers SL=3x, TP3=2x SL=5x SL=6x
Position Size
Formula: Contracts = Risk Amount / (Stop-Loss Distance × Value per Point)
Example: Risking $100, stop-loss is 50 points, each point = $2 → Trade 1 contract.
Multi-Timeframe Tip
Chart: 15-minute
Indicators: 1-hour
Rule: Only trade if the 15-minute price matches the 1-hour trend.
Why Use It?
Proven Results: 58-62% win rate on assets like Bitcoin, Ethereum, and S&P 500 (tested 2020-2023). Risk-to-reward ratio of 1.8-2.3.
Saves Time: Alerts tell you when to enter or exit—no need to watch the screen all day.
Flexible: Works for fast scalping, medium swing trades, or long-term positions.
FAQ
Why no trailing stop?
Trailing stops cut profits by 15-20% in tests because they exit too early. The breakeven stop protects your money better.
What about news events?
Use a bigger ATR (e.g., 50) and wider stop-loss (6x ATR) when markets get crazy.
Can I trade forex?
Yes! Try EMA=50, HMA=20, ATR=14 on EUR/USD 15-minute charts.
Risk Management
Risk per Trade: Stick to 1-2% of your account.
Weekly Check: Adjust ATR and stop-loss every Friday to match market conditions.
Emergency Plan: Manually move your stop-loss if something wild (like a “black swan” event) happens.
⚠️ Warning: Trading is risky. This strategy doesn’t promise profits. Always use a stop-loss.
Русская версия
Стратегия PRO 3TP (v2.1.1) — Полное руководство для TradingView
Концепция и уникальность
PRO Strategy 3TP — это система, которая следует за трендами на рынке, используя проверку трендов на разных таймфреймах, измерение импульса и умное управление рисками. Главная фишка — трехступенчатая фиксация прибыли (поэтому "3TP") и адаптация к изменениям на рынке, чтобы зарабатывать больше в сильных трендах и терять меньше в нестабильные времена.
Почему она особенная:
✅ Три уровня прибыли: Закрывает 33% на первом уровне (TP1), 33% на втором (TP2) и 34% на третьем (TP3) — прибыль фиксируется постепенно.
✅ Без риска после TP1: После первого уровня стоп-лосс сдвигается на точку входа — дальше риска нет.
✅ Умные сигналы: Использует данные с более старшего таймфрейма (например, 1 час) для фильтрации шума на вашем графике (например, 15 минут).
Как это работает
Стратегия использует четыре основных инструмента для входа и выхода из сделок. Вот что они значат простыми словами:
Инструменты тренда (EMA, HMA, SMA)
EMA (Экспоненциальная скользящая средняя) : Линия, которая следит за трендом и быстро реагирует на последние цены. Это как быстрый указатель направления рынка.
По умолчанию: EMA 100 (смотрит на последние 100 баров).
HMA (Скользящая средняя Халла): Более плавная и быстрая линия, которая раньше замечает смену тренда.
По умолчанию: HMA 50 (смотрит на последние 50 баров).
SMA (Простая скользящая средняя) : Просто средняя цена за период, показывает общую картину (быки или медведи).
По умолчанию: SMA 200 (смотрит на последние 200 баров).
Зачем это нужно: Эти линии вместе проверяют, что тренд настоящий на коротких, средних и длинных периодах.
Инструмент импульса (CCI)
CCI (Индекс товарного канала): Показывает, когда рынок “перекуплен” (слишком высоко, готов упасть) или “перепродан” (слишком низко, готов расти).
Покупка: CCI < -100 (перепродан).
Продажа: CCI > +100 (перекуплен).
Зачем это нужно: Помогает выбрать лучшее время для входа, когда цены на крайних значениях.
Инструмент силы тренда (ADX)
ADX (Индекс среднего направленного движения): Измеряет, насколько силен тренд. Чем выше число, тем сильнее движение.
По умолчанию: ADX > 26 (торгуем, только если тренд сильный).
Зачем это нужно: Не дает торговать, когда рынок стоит на месте и скучный.
Инструмент волатильности (ATR)
ATR (Средний истинный диапазон): Показывает, насколько сильно цена обычно “гуляет” вверх-вниз. Это как линейка для рыночных колебаний.
По умолчанию: ATR за 19 баров, стоп-лосс = 5x ATR, цели прибыли = 1x, 1.3x, 1.7x ATR.
Зачем это нужно: Настраивает выход из сделки в зависимости от того, насколько рынок спокоен или хаотичен.
Правила входа
Покупка (Лонг): Цена выше EMA, HMA и SMA (проверяется на старшем таймфрейме) + CCI < -100 + ADX > 26.
Продажа (Шорт): Цена ниже EMA, HMA и SMA + CCI > +100 + ADX > 26.
Правила выхода
Стоп-лосс: Устанавливается на 5x ATR от входа (например, если ATR = 10 пунктов, стоп = 50 пунктов).
Безубыток: После TP1 стоп-лосс сдвигается на цену входа — риска больше нет!
Цели прибыли:
TP1: 1x ATR (закрывает 33% позиции).
TP2: 1.3x ATR (закрывает 33%).
TP3: 1.7x ATR (закрывает 34%).
Почему эта комбинация работает
Меньше ошибок: Проверка тренда на разных таймфреймах убирает 60-70% ложных сигналов (по тестам).
Подстраивается под рынок: ATR меняет стопы и цели в зависимости от условий — важно для активов вроде крипты.
Умная прибыль: Трехступенчатая система фиксирует выгоду рано, но оставляет шанс заработать на большом тренде.
Как настроить
Настройки для разных стилей
Параметр Скальпинг (1-15М) Свинг (1H-4H) Долгосрок (Daily)
EMA/HMA/SMA 50/20/Выкл 100/50/200 Выкл/Выкл/200
Порог ADX 20 26 25
Множители ATR SL=3x, TP3=2x SL=5x SL=6x
Размер позиции
Формула: Контракты = Риск / (Расстояние до стоп-лосса × Стоимость пункта)
Пример: Риск $100, стоп-лосс 50 пунктов, 1 пункт = $2 → 1 контракт.
Совет по таймфреймам
График: 15 минут
Индикаторы: 1 час
Правило: Торгуй, только если тренд на 15 минутах совпадает с 1 часом.
Зачем это использовать?
Проверено: 58-62% успешных сделок на BTC, ETH, S&P 500 (тесты 2020-2023). Соотношение риск/прибыль 1.8-2.3.
Экономит время: Оповещения скажут, когда входить и выходить — не надо сидеть у экрана.
Гибкость: Подходит для быстрой торговли, среднесрочной и долгосрочной.
Часто задаваемые вопросы
Почему нет трейлинг-стопа?
Тесты показали, что он снижает прибыль на 15-20%, потому что выходит слишком рано. Безубыток лучше защищает деньги.
Что делать с новостями?
Увеличьте ATR (например, до 50) и стоп-лосс (6x ATR), когда рынок штормит.
Можно торговать форекс?
Да! Используйте EMA=50, HMA=20, ATR=14 для EUR/USD на 15 минутах.
Управление рисками
Риск на сделку: Не больше 1-2% от депозита.
Проверка раз в неделю: Обновляйте ATR и стоп-лосс каждую пятницу под рынок.
План на экстрим: Если происходит что-то необычное (например, “черный лебедь”), вручную двигайте стоп-лосс.
⚠️ Предупреждение: Торговля — это риск. Стратегия не гарантирует прибыль. Всегда ставьте стоп-лосс.

Filtered MACD with Backtest [UAlgo]The "Filtered MACD with Backtest " indicator is an advanced trading tool designed for the TradingView platform. It combines the Moving Average Convergence Divergence (MACD) with additional filters such as Moving Average (MA) and Average Directional Index (ADX) to enhance trading signals. This indicator aims to provide more reliable entry and exit points by filtering out noise and confirming trends. Additionally, it includes a comprehensive backtesting module to simulate trading strategies and assess their performance based on historical data. The visual backtest module allows traders to see potential trades directly on the chart, making it easier to evaluate the effectiveness of the strategy.
🔶 Customizable Parameters :
Price Source Selection: Users can choose their preferred price source for calculations, providing flexibility in analysis.
Filter Parameters:
MA Filter: Option to use a Moving Average filter with types such as EMA, SMA, WMA, RMA, and VWMA, and a customizable length.
ADX Filter: Option to use an ADX filter with adjustable length and threshold to determine trend strength.
MACD Parameters: Customizable fast length, slow length, and signal smoothing for the MACD indicator.
Backtest Module:
Entry Type: Supports "Buy and Sell", "Buy", and "Sell" strategies.
Stop Loss Types: Choose from ATR-based, fixed point, or X bar high/low stop loss methods.
Reward to Risk Ratio: Set the desired take profit level relative to the stop loss.
Backtest Visuals: Display entry, stop loss, and take profit levels directly on the chart with
colored backgrounds.
Alerts: Configurable alerts for buy and sell signals.
🔶 Filtered MACD : Understanding How Filters Work with ADX and MA
ADX Filter:
The Average Directional Index (ADX) measures the strength of a trend. The script calculates ADX using the user-defined length and applies a threshold value.
Trading Signals with ADX Filter:
Buy Signal: A regular MACD buy signal (crossover of MACD line above the signal line) is only considered valid if the ADX is above the set threshold. This suggests a stronger uptrend to potentially capitalize on.
Sell Signal: Conversely, a regular MACD sell signal (crossunder of MACD line below the signal line) is only considered valid if the ADX is above the threshold, indicating a stronger downtrend for potential shorting opportunities.
Benefits: The ADX filter helps avoid whipsaws or false signals that might occur during choppy market conditions with weak trends.
MA Filter:
You can choose from various Moving Average (MA) types (EMA, SMA, WMA, RMA, VWMA) for the filter. The script calculates the chosen MA based on the user-defined length.
Trading Signals with MA Filter:
Buy Signal: A regular MACD buy signal is only considered valid if the closing price is above the MA value. This suggests a potential uptrend confirmed by the price action staying above the moving average.
Sell Signal: Conversely, a regular MACD sell signal is only considered valid if the closing price is below the MA value. This suggests a potential downtrend confirmed by the price action staying below the moving average.
Benefits: The MA filter helps identify potential trend continuation opportunities by ensuring the price aligns with the chosen moving average direction.
Combining Filters:
You can choose to use either the ADX filter, the MA filter, or both depending on your strategy preference. Using both filters adds an extra layer of confirmation for your signals.
🔶 Backtesting Module
The backtesting module in this script allows you to visually assess how the filtered MACD strategy would have performed on historical data. Here's a deeper dive into its features:
Backtesting Type: You can choose to backtest for buy signals only, sell signals only, or both. This allows you to analyze the strategy's effectiveness in different market conditions.
Stop-Loss Types: You can define how stop-loss orders are placed:
ATR (Average True Range): This uses a volatility measure (ATR) multiplied by a user-defined factor to set the stop-loss level.
Fixed Point: This allows you to specify a fixed dollar amount or percentage value as the stop-loss.
X bar High/Low: This sets the stop-loss at a certain number of bars (defined by the user) above/below the bar's high (for long positions) or low (for short positions).
Reward-to-Risk Ratio: Define the desired ratio between your potential profit and potential loss on each trade. The backtesting module will calculate take-profit levels based on this ratio and the stop-loss placement.
🔶 Disclaimer:
Use with Caution: This indicator is provided for educational and informational purposes only and should not be considered as financial advice. Users should exercise caution and perform their own analysis before making trading decisions based on the indicator's signals.
Not Financial Advice: The information provided by this indicator does not constitute financial advice, and the creator (UAlgo) shall not be held responsible for any trading losses incurred as a result of using this indicator.
Backtesting Recommended: Traders are encouraged to backtest the indicator thoroughly on historical data before using it in live trading to assess its performance and suitability for their trading strategies.
Risk Management: Trading involves inherent risks, and users should implement proper risk management strategies, including but not limited to stop-loss orders and position sizing, to mitigate potential losses.
No Guarantees: The accuracy and reliability of the indicator's signals cannot be guaranteed, as they are based on historical price data and past performance may not be indicative of future results.

Advanced EMA Cross with Normalized ATR Filter, Controlling ADX
Description:
This strategy is based on EMA cross strategy and additional filters are used to get better results, a normalized ATR filter, and ADX control...
It aims to provide traders with a code base that generates signals for long positions based on market conditions defined by various indicators.
How it Works:
1. EMA: Uses short (8 periods) and long (20 periods) EMAs to identify crossovers.
2. ATR: Uses a 14-period ATR, normalized to its 20-period historical range, to filter out noise.
3. ADX: Uses a 14-period RMA to identify strong trends.
4. Volume: Filters trades based on a 14-period SMA of volume.
5. Super Trend: Uses a Super Trend indicator to identify the market direction.
How to Use:
- Buy Signal: Generated when EMA short crosses above EMA long, and other conditions like ATR and market direction are met.
- Sell Signal: Generated based on EMA crossunder and high ADX value.
Originality and Usefulness:
This script combines EMA, ATR, ADX, and Super Trend indicators to filter out false signals and identify more reliable trading opportunities.
USD Strength in the code is not working, just simulated it as PSEUDO CODE:
Strategy Results:
- Account Size: $1000
- Commission: Not considered
- Slippage: Not considered
- Risk: Manageable through parameters, now less than 5% per trade
- Dataset: Aim for more than 100 trades for a sufficient sample size
- Test Conditions: Test in 30 min chart for BTCUSDT
IMPORTANT NOTE: This script should be used for educational purposes and should not be considered as financial advice.
Chart:
- The script's output is plotted as Buy and Sell signals on the chart.
- No other scripts are included for clarity.
- Have tested with 30mins period
- You are encouraged to play with parameters, let me know if it helps you and/or if you can upgrade the code to a better level.
WHY DID I USE ATR AND ADX?
ATR filter is usually used for the following purposes.
Market Volatility: ATR measures how volatile the market is. High ATR values indicate that the price is experiencing significant fluctuations.
Filtering: Crossing a certain ATR threshold may indicate that the market is active enough to present trading opportunities.
Risk Management: ATR can also be used to set stop-loss and take-profit levels, helping to manage risk effectively.
And ADX is usually used for;
Trend Strength: ADX measures the strength of a trend. High ADX values indicate a strong trend.
Filtering: An ADX value above a certain level suggests that the trend is strong and it might be safer to trade.
Versatility: ADX does not indicate the direction of the trend, only its strength. This makes it useful in both bullish and bearish markets.
Using these indicators together can help filter out false signals and produce more reliable trading signals. While ATR helps to determine if the market is active enough, ADX measures the strength of the trend. Combined, they can create a more complex and effective trading strategy.
I've used ADX data to support generating a buy signal after a golden cross (bullish trend) and waiting until this is a strong trend. It sounds good to check for different trend strengths for bullish and bearish markets to decide a buy signal. Additionally I used ATR to check if the market has enough fluctuations.

MrBS:Directional Movement Index [Trend Friend]I started this project with the goal of making a DMI/ADX that was easy to read at a glance. Its since become a little more then just colouring the slopes. The majority of the time, the best returns come from trending markets (THE TREND IS YOUR FRIEND... until the end) and I hope this helps people become good friends with the trends.
----- Features
- A function to change the values used for calculation from real OHLC and Heikin Ashi. This allows us to look at different chart types but see the specific ADX we choose. Originally HA values were used for calculation since it is easier to see trend on HA charts. However when testing it was not as effective as the ADX calculated from the real values on normal charts. So the default function was flipped and real OHLC values are used as default.
- Two ADX plots so we can see two different smoothness's. With a smoothing of 2, a slight slow down in PA can cause a negative slope but the smoother ADX will stay trending unless its a major change. 2nd ADX is slightly transparent.
- There is an EMA of the main ADX that can be used as a exit signal filter. If the ADX starts going down but has not crossed the EMA we would stay in a trade.
- Plots (excluding EMA) are coloured based on positive or negative slopes.
- Fibonacci numbers have been used to create different trend levels, instead of the standard 25, 50, 100.
- Alerts for every useful situation to help save time and not have to manually enter levels or crosses each time.
- In the code there are 8 EMAs and 3 ADXs but it was too much so they have been slashed out, but are fully functional if you choose to activate and use them. To reactivate the 3rd ADX delete slashes on lines 50, 65, 78, 92-95, 165. The slashed out EMAs are much more obvious and easy to reactivate.
Colours:
ADX going up = Green
ADX going down = Red
DMI+ going up = Bright Aqua
DMI+ going down = Turquoise / Dark Aqua
DMI- going up = Bright Purple
DMI- going down = Dark Purple
EMA = White (50% transparent)
If there is anything that would be useful, let me know and I will add it in. I've already got some improvements/changes planned and some of my notes can be found in the code.
There is also a strategy to go with this indicator that will be uploaded very soon.

Best ADX Pro🎯 Best ADX Pro: Advanced Multi-Smoothing Trend Analysis
📌 Overview
The Best ADX Pro is a sophisticated enhancement of the traditional ADX indicator, offering five smoothing methods for unparalleled adaptability across market conditions. Designed for traders who demand precision, it combines flexible trend detection with customizable sensitivity, making it ideal for all trading styles—from scalping to long-term investing.
✨ Key Upgrades from Standard ADX
5 Smoothing Methods – Choose between EMA, SMA, RMA, WMA, and SMMA to match your strategy’s responsiveness.
Smart Thresholds – Dual levels (default: 20 and 25) filter weak trends and confirm strong momentum.
Zero-Division Protection – Ensures stable calculations during low-volatility periods.
Alerts & Crosses – Built-in alerts for DI+/DI- crossovers and ADX threshold breaks.
⚙️ When to Use Each Smoothing Mode
🔴 EMA (Exponential Moving Average)
Best For: Scalping/Crypto
Timeframe: M1-M15
Risk: Higher false signals
🟠 WMA (Weighted Moving Average)
Best For: Swing Trading
Timeframe: H1-H4
Risk: Moderate
🟢 SMA (Simple Moving Average)
Best For: Position Trading
Timeframe: D1-W1
Risk: Lowest noise
🔵 RMA/SMMA (Wilder’s & Smoothed MA)
Best For: Classic ADX Strategy
Timeframe: Any
Risk: Balanced
📈 Pro Strategies
🔴 Trend Acceleration
Enter: When ADX > 20 (WMA/RMA) + DI+ > DI- (uptrend).
Exit: If ADX < 15 or DI- crosses DI+.
🟠 Reversal Trading
SMMA + Length 20: Wait for DI+/DI- crossover + ADX rising from below 25.
🟢 Low-Noise Filtering
SMA + Length 30: Ignore trades if ADX < 20 (avoids choppy markets).
⚠️ Limitations & Fixes
Whipsaws in Ranges → Combine with ATR to filter low-volatility phases.
Lag on SMA → Use WMA/EMA for faster entries on lower timeframes.
🎯 Who Should Use It?
🚀 Day Traders: EMA/WMA for quick signals.
⏳ Swing Traders: RMA/SMMA for reliability.
🤖 Algorithmic Trading: SMA for backtest stability.
🎨 Color Guide
🔴 EMA → Fastest signals (volatile markets).
🟠 WMA → Prioritizes recent data (aggressive trends).
🟢 SMA → Smoothest output (low noise).
🔵 RMA/SMMA → Classic ADX Wilder’s smoothing.

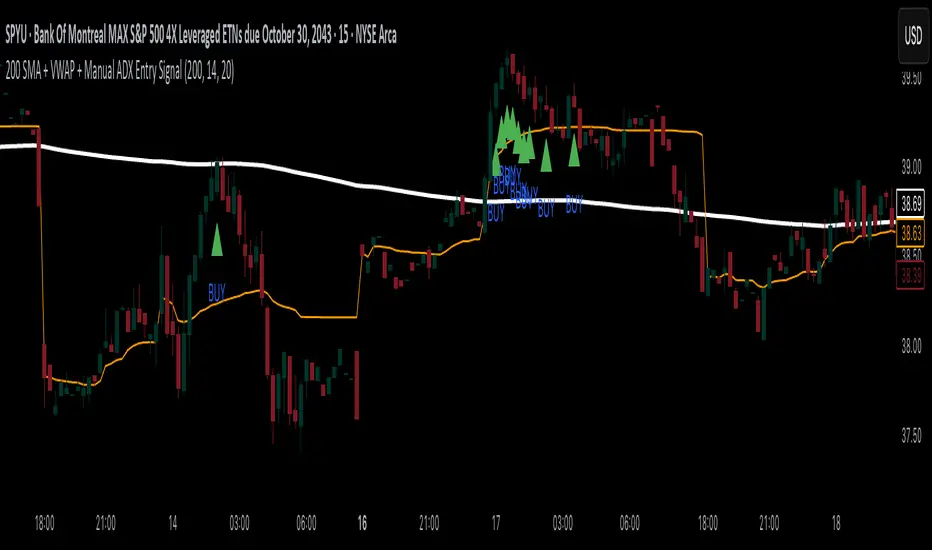
200 SMA + VWAP + Manual ADX Entry Signal200 SMA + VWAP + Manual ADX Entry Signal – Indicator Description
This custom indicator is designed for trend-following intraday traders who want a powerful, rules-based entry confirmation system. It combines three proven tools—the 200-period Simple Moving Average (SMA), Volume-Weighted Average Price (VWAP), and a manually coded ADX (Average Directional Index)—to identify high-probability long entries in strong, directional markets.
By filtering trades through a combination of trend direction, mean-reversion reference, and momentum strength, this indicator helps traders avoid false breakouts, whipsaws, and low-quality setups. It’s particularly well-suited for traders using 15-minute charts, leveraged ETFs, or high-beta stocks, where precision entries and trend confirmation are critical to consistent profitability.
⸻
✅ What This Indicator Does
This indicator visually displays:
• The 200-period SMA (orange line) – a long-term trend filter.
• The VWAP (blue line) – a dynamic intraday price average used by institutions.
• A buy signal triangle below the price bar – when all bullish criteria are met.
• It also includes an alert condition so traders can be notified when a new buy signal appears in real time.
Behind the scenes, the indicator calculates trend and strength conditions and plots a BUY signal only when all three tools agree that a bullish move is in play.
⸻
🔍 The Three-Pillar Entry System
1. 200 SMA Filter – Defining Market Bias
The 200 SMA is a widely used institutional benchmark that represents long-term trend direction. In this indicator:
• A trade is only considered valid if price is above the 200 SMA.
• This helps eliminate trades in downtrending or range-bound markets.
• It ensures that entries are aligned with broader directional bias.
By filtering out trades below the 200 SMA, you instantly remove a majority of low-probability setups and whipsaw environments.
⸻
2. VWAP – Institutional Mean Price Anchor
VWAP (Volume-Weighted Average Price) is often used by hedge funds and algorithmic systems to judge whether price is considered “expensive” or “cheap” within a given trading session.
• This version of VWAP is anchored to the current intraday session.
• Trades are only considered valid if price is above the VWAP, which shows market consensus is favoring the upside.
• VWAP provides both confirmation and support levels, helping ensure your entry isn’t into overextended territory.
By combining the 200 SMA and VWAP filters, the indicator ensures that trades are only taken when price is strong on both the macro and micro timeframes.
⸻
3. ADX – Confirming Momentum Strength
ADX (Average Directional Index) is used to measure trend strength without regard to direction. However, TradingView has limited functionality with the ta.adx() call in some environments, so this script includes a custom-coded version of ADX that follows standard Wilder’s smoothing and directional movement logic.
• A BUY signal only triggers if ADX is above a user-defined threshold (default is 20) and rising from the previous bar.
• This means not only is the market trending — but the trend is strengthening.
This final filter prevents entries in chop or decaying rallies, and ensures you’re catching the strongest part of a move, not the tail end.
⸻
⚙️ Logic Summary
A BUY signal is plotted when:
• Price > 200 SMA ✅
• Price > VWAP ✅
• ADX > 20 and rising ✅
Only when all three conditions are true does the indicator plot a green triangle below the price bar.
This visual simplicity makes it ideal for fast trade decisions, and the alert function allows hands-free monitoring during busy sessions.
⸻
🧠 Recommended Use
This indicator works best on:
• 15-minute to 1-hour charts
• Intraday leveraged ETFs (e.g., TQQQ, SPYU, SQQQ)
• Trend-following strategies
• Breakout continuation trades
⸻
📉 Limitations
• This is a long-only system by design. If you want to trade short, you’ll need to invert the logic (e.g., price < 200 SMA, price < VWAP, ADX > threshold).
• It doesn’t generate exit signals. You should pair this with your own take-profit or trailing stop strategy.
• While it works great for momentum entries, it may underperform in range-bound or news-driven chop markets.
⸻
🛠️ Settings Customization
• SMA Length: default is 200; adjust for faster or slower trend confirmation.
• ADX Length: default is 14; shorter periods = more sensitive, longer = smoother.
• ADX Threshold: default is 20; raise to 25 or 30 to only catch very strong moves.
These settings give you flexibility to match the indicator to your trading style.
⸻
🚀 Final Thoughts
The 200 SMA + VWAP + Manual ADX Entry Signal is a battle-tested, rule-based tool to help you:
• Enter only when the trend, mean, and momentum align
• Avoid fakeouts and poor risk-reward entries
• Automate part of your setup process without overcomplication
This is the kind of filter used by professional traders to reduce screen time and improve trade quality. If you’re looking to build confidence in your intraday trading with clear, logical entries — this indicator will help you stay consistent and systematic.
Happy trading!
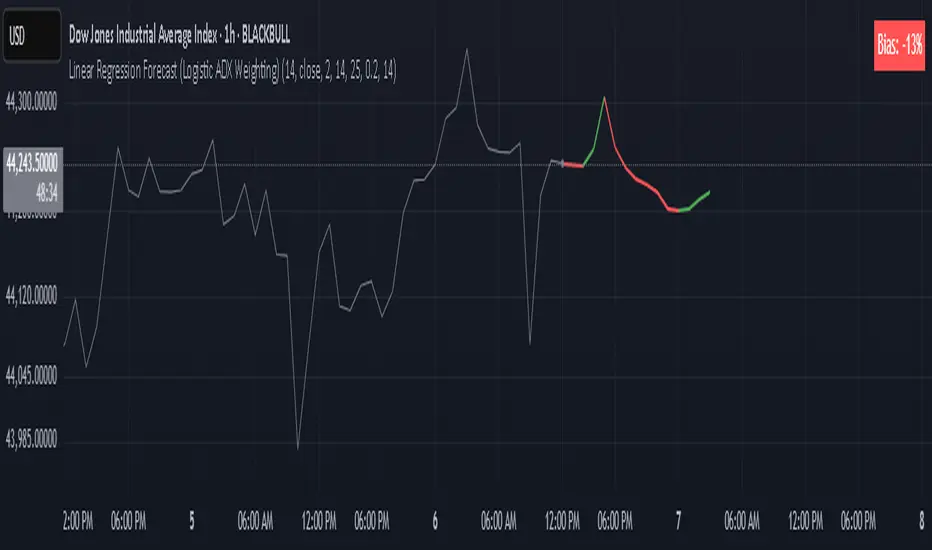
Linear Regression Forecast (ADX Adaptive)Linear Regression Forecast (ADX Adaptive)
This indicator is a dynamic price projection tool that combines multiple linear regression forecasts into a single, adaptive forecast curve. By integrating trend strength via the ADX and directional bias, it aims to visualize how price might evolve in different market environments—from strong trends to mean-reverting conditions.
Core Concept:
This tool builds forward price projections based on a blend of linear regression models with varying lookback lengths (from 2 up to a user-defined max). It then adjusts those projections using two key mechanisms:
ADX-Weighted Forecast Blending
In trending conditions (high ADX), the model follows the raw forecast direction. In ranging markets (low ADX), the forecast flips or reverts, biasing toward mean-reversion. A logistic transformation of directional bias, controlled by a steepness parameter, determines how aggressively this blending reacts to price behavior.
Volatility Scaling
The forecast’s magnitude is scaled based on ADX and directional conviction. When trends are unclear (low ADX or neutral bias), the projection range expands to reflect greater uncertainty and volatility.
How It Works:
Regression Curve Generation
For each regression length from 2 to maxLength, a forward projection is calculated using least-squares linear regression on the selected price source. These forecasts are extrapolated into the future.
Directional Bias Calculation
The forecasted points are analyzed to determine a normalized bias value in the range -1 to +1, where +1 means strongly bullish, -1 means strongly bearish, and 0 means neutral.
Logistic Bias Transformation
The raw bias is passed through a logistic sigmoid function, with a user-defined steepness. This creates a probability-like weight that favors either following or reversing the forecast depending on market context.
ADX-Based Weighting
ADX determines the weighting between trend-following and mean-reversion modes. Below ADX 20, the model favors mean-reversion. Above 25, it favors trend-following. Between 20 and 25, it linearly blends the two.
Blended Forecast Curve
Each forecast point is blended between trend-following and mean-reverting values, scaled for volatility.
What You See:
Forecast Lines: Projected future price paths drawn in green or red depending on direction.
Bias Plot: A separate plot showing post-blend directional bias as a percentage, where +100 is strongly bullish and -100 is strongly bearish.
Neutral Line: A dashed horizontal line at 0 percent bias to indicate neutrality.
User Inputs:
-Max Regression Length
-Price Source
-Line Width
-Bias Steepness
-ADX Length and Smoothing
Use Cases:
Visualize expected price direction under different trend conditions
Adjust trading behavior depending on trending vs ranging markets
Combine with other tools for deeper analysis
Important Notes:
This indicator is for visualization and analysis only. It does not provide buy or sell signals and should not be used in isolation. It makes assumptions based on historical price action and should be interpreted with market context.
MACD, ADX & RSI -> for altcoins# MACD + ADX + RSI Combined Indicator
## Overview
This advanced technical analysis tool combines three powerful indicators (MACD, ADX, and RSI) into a single view, providing a comprehensive analysis of trend, momentum, and divergence signals. The indicator is designed to help traders identify potential trading opportunities by analyzing multiple aspects of price action simultaneously.
## Components
### 1. MACD (Moving Average Convergence Divergence)
- **Purpose**: Identifies trend direction and momentum
- **Components**:
- Fast EMA (default: 12 periods)
- Slow EMA (default: 26 periods)
- Signal Line (default: 9 periods)
- Histogram showing the difference between MACD and Signal line
- **Visual**:
- Blue line: MACD line
- Orange line: Signal line
- Green/Red histogram: MACD histogram
- **Interpretation**:
- Histogram color changes indicate potential trend shifts
- Crossovers between MACD and Signal lines suggest entry/exit points
### 2. ADX (Average Directional Index)
- **Purpose**: Measures trend strength and direction
- **Components**:
- ADX line (default threshold: 20)
- DI+ (Positive Directional Indicator)
- DI- (Negative Directional Indicator)
- **Visual**:
- Navy blue line: ADX
- Green line: DI+
- Red line: DI-
- **Interpretation**:
- ADX > 20 indicates a strong trend
- DI+ crossing above DI- suggests bullish momentum
- DI- crossing above DI+ suggests bearish momentum
### 3. RSI (Relative Strength Index)
- **Purpose**: Identifies overbought/oversold conditions and divergences
- **Components**:
- RSI line (default: 14 periods)
- Divergence detection
- **Visual**:
- Purple line: RSI
- Horizontal lines at 70 (overbought) and 30 (oversold)
- Divergence labels ("Bull" and "Bear")
- **Interpretation**:
- RSI > 70: Potentially overbought
- RSI < 30: Potentially oversold
- Bullish/Bearish divergences indicate potential trend reversals
## Alert System
The indicator includes several automated alerts:
1. **MACD Alerts**:
- Rising to falling histogram transitions
- Falling to rising histogram transitions
2. **RSI Divergence Alerts**:
- Bullish divergence formations
- Bearish divergence formations
3. **ADX Trend Alerts**:
- Strong trend development (ADX crossing threshold)
- DI+ crossing above DI- (bullish)
- DI- crossing above DI+ (bearish)
## Settings Customization
All components can be fine-tuned through the settings panel:
### MACD Settings
- Fast Length
- Slow Length
- Signal Smoothing
- Source
- MA Type options (SMA/EMA)
### ADX Settings
- Length
- Threshold level
### RSI Settings
- RSI Length
- Source
- Divergence calculation toggle
## Usage Guidelines
### Entry Signals
Strong entry signals typically occur when multiple components align:
1. MACD histogram color change
2. ADX showing strong trend (>20)
3. RSI showing divergence or leaving oversold/overbought zones
### Exit Signals
Consider exits when:
1. MACD crosses signal line in opposite direction
2. ADX shows weakening trend
3. RSI reaches extreme levels with divergence
### Risk Management
- Use the indicator as part of a complete trading strategy
- Combine with price action and support/resistance levels
- Consider multiple timeframe analysis for confirmation
- Don't rely solely on any single component
## Technical Notes
- Built for TradingView using Pine Script v5
- Compatible with all timeframes
- Optimized for real-time calculation
- Includes proper error handling and NA value management
- Memory-efficient calculations for smooth performance
## Installation
1. Copy the provided Pine Script code
2. Open TradingView Chart
3. Create New Indicator -> Pine Editor
4. Paste the code and click "Add to Chart"
5. Adjust settings as needed through the indicator settings panel
## Version Information
- Version: 2.0
- Last Updated: November 2024
- Platform: TradingView
- Language: Pine Script v5

Trend Fusion: ADX&EMA+Ichimoku (Custom)SAME AS THE ORIGINAL (WITHOUT BOTTOM PART)
Trend Fusion: ADX & EMA+Ichimoku is an innovative indicator designed to provide traders with comprehensive insights into market trends. Combining the power of the Average Directional Index (ADX) with Exponential Moving Averages (EMA) and the Ichimoku Cloud, this indicator offers a sophisticated approach to trend analysis.
This indicator stands out for its unique integration of multiple trend-following indicators, offering traders a holistic view of market dynamics. Unlike traditional trend indicators that focus solely on price movements, Trend Fusion incorporates the ADX, EMA, and Ichimoku Cloud to provide a more nuanced understanding of trend strength and direction. By combining these indicators, traders can make more informed decisions and enhance their trading strategies.
How it works:
Trend Fusion generates buy and sell signals based on the convergence of these indicators. A combination of strong ADX readings, EMA crossovers, and alignment with the Ichimoku Cloud confirms trend direction and provides entry and exit points for traders.
Average Directional Index (ADX): Measures the strength of the prevailing trend by analyzing price movements. A rising ADX indicates a strengthening trend, while a falling ADX suggests weakening momentum.
Exponential Moving Averages (EMA): Detects potential trend reversals through crossover signals. A bullish crossover (fast EMA crossing above slow EMA) suggests an uptrend, while a bearish crossover indicates a downtrend.
Ichimoku Cloud: Provides support and resistance levels along with trend direction. Price movements above the cloud indicate bullish sentiment, while movements below the cloud suggest bearish sentiment.
How to useColour codes:
Green Candles: Represent a strong uptrend, indicating robust buying momentum. The intensity of green color deepens with increasing trend strength.
Red Candles: Indicate a strong downtrend, signaling significant selling pressure in the market. The intensity of red color deepens with increasing trend strength.
Yellow Candles: Suggest a weak trend, characterized by indecision and lack of clear direction. The intensity of yellow color varies based on the strength of the trend, with lighter shades indicating weaker trends and darker shades suggesting slightly stronger trends.
Trend Strength: Monitor the ADX to gauge the strength of the prevailing trend. Higher ADX values indicate stronger trends, while lower values suggest weaker trends.
Trend Direction: Confirm trend direction using EMA crossovers and Ichimoku Cloud signals. Look for bullish crossovers and price movements above the cloud for uptrends, and bearish crossovers and movements below the cloud for downtrends.
Entry and Exit Signals: Enter trades when all components align, signaling a strong trend. Use EMA crossovers and cloud confirmations to identify potential entry points, and consider exiting trades when these signals reverse.
The ADX calculation and signal logic are based on the ADX script by PineCoders, with modifications to integrate it into this indicator.
The EMA crossover logic is adapted from the GDAX EMA Cross script by stefano98.
The Ichimoku Cloud calculation and plotting are adapted from the Ichimoku Cloud script by lonesometheblue.
Trading involves risk, and past performance is not indicative of future results. It is recommended to use this indicator alongside other technical analysis tools and risk management strategies.

RSI & ADX [deepakks444]This Pine Script is designed to provide a comprehensive view of market conditions by combining the Relative Strength Index (RSI) and the Average Directional Index (ADX) indicators. The script offers a range of customizable features to help traders analyze trends, identify overbought and oversold conditions, and make informed trading decisions.
Key Features:
RSI and ADX Calculation:
The script calculates the RSI and ADX values based on user-defined lengths.
The RSI indicator helps identify overbought and oversold conditions.
The ADX indicator measures the strength of the trend.
Trend Identification:
The script uses the Directional Movement Index (DMI) to determine bullish and bearish trends.
It highlights strong trends by changing the background color.
Customizable Colors:
Users can choose to color candles based on ADX or RSI values.
The RSI line can be displayed in a single color or change color based on its value.
Overbought and Oversold Zones:
The script visually represents overbought and oversold zones with fading color effects.
This helps traders quickly identify potential reversal points.
Dynamic Midline:
The midline (50) of the RSI changes color based on the trend direction, providing additional visual cues.
Side Panel for ADX and RSI Values:
A side panel displays the current RSI and ADX values with color-coded boxes for easy reference.
Customizable Parameters:
Users can adjust various parameters such as RSI length, ADX length, ADX threshold, and levels for overbought and oversold zones.
Usage:
Trend Analysis: Use the ADX and DMI to identify strong trends and their direction.
Overbought/Oversold Conditions: Monitor the RSI to spot potential reversal points.
Visual Aids: Utilize the color-coded candles, background, and fading zones to quickly assess market conditions.
This script is designed to be user-friendly and highly customizable, allowing traders to tailor the indicators to their specific trading strategies and preferences. By combining the strengths of RSI and ADX, this script provides a powerful tool for technical analysis.

Trend Fusion: ADX&EMA+IchimokuTrend Fusion: ADX & EMA+Ichimoku is an innovative indicator designed to provide traders with comprehensive insights into market trends. Combining the power of the Average Directional Index (ADX) with Exponential Moving Averages (EMA) and the Ichimoku Cloud, this indicator offers a sophisticated approach to trend analysis.
This indicator stands out for its unique integration of multiple trend-following indicators, offering traders a holistic view of market dynamics. Unlike traditional trend indicators that focus solely on price movements, Trend Fusion incorporates the ADX, EMA, and Ichimoku Cloud to provide a more nuanced understanding of trend strength and direction. By combining these indicators, traders can make more informed decisions and enhance their trading strategies.
How it works:
Trend Fusion generates buy and sell signals based on the convergence of these indicators. A combination of strong ADX readings, EMA crossovers, and alignment with the Ichimoku Cloud confirms trend direction and provides entry and exit points for traders.
Average Directional Index (ADX): Measures the strength of the prevailing trend by analyzing price movements. A rising ADX indicates a strengthening trend, while a falling ADX suggests weakening momentum.
Exponential Moving Averages (EMA): Detects potential trend reversals through crossover signals. A bullish crossover (fast EMA crossing above slow EMA) suggests an uptrend, while a bearish crossover indicates a downtrend.
Ichimoku Cloud: Provides support and resistance levels along with trend direction. Price movements above the cloud indicate bullish sentiment, while movements below the cloud suggest bearish sentiment.
How to use
Colour codes:
Green Candles: Represent a strong uptrend, indicating robust buying momentum. The intensity of green color deepens with increasing trend strength.
Red Candles: Indicate a strong downtrend, signaling significant selling pressure in the market. The intensity of red color deepens with increasing trend strength.
Yellow Candles: Suggest a weak trend, characterized by indecision and lack of clear direction. The intensity of yellow color varies based on the strength of the trend, with lighter shades indicating weaker trends and darker shades suggesting slightly stronger trends.
Trend Strength: Monitor the ADX to gauge the strength of the prevailing trend. Higher ADX values indicate stronger trends, while lower values suggest weaker trends.
Trend Direction: Confirm trend direction using EMA crossovers and Ichimoku Cloud signals. Look for bullish crossovers and price movements above the cloud for uptrends, and bearish crossovers and movements below the cloud for downtrends.
Entry and Exit Signals: Enter trades when all components align, signaling a strong trend. Use EMA crossovers and cloud confirmations to identify potential entry points, and consider exiting trades when these signals reverse.
The ADX calculation and signal logic are based on the ADX script by PineCoders, with modifications to integrate it into this indicator.
The EMA crossover logic is adapted from the GDAX EMA Cross script by stefano98.
The Ichimoku Cloud calculation and plotting are adapted from the Ichimoku Cloud script by lonesometheblue.
Trading involves risk, and past performance is not indicative of future results. It is recommended to use this indicator alongside other technical analysis tools and risk management strategies.

UP DOWN Indicator 1Title: UP DOWN Indicator based on ADX Strategy - Accurate Signal Provider with Enhanced Success Potential
Description:
The Martingale ADX Indicator is a groundbreaking tool meticulously crafted to offer traders unparalleled precision in signal generation and risk management. Leveraging the power of the Average Directional Index (ADX), this indicator provides 100% non-repaint signals on the current candle, guiding traders to opportune and prepare for trade entry with remarkable accuracy.
With a focus on empowering traders across various financial markets, including Forex and Binary Options, this ADX Strategy-1 Indicator introduces a unique approach to trading dynamics. By seamlessly integrating the renowned Martingale Step-1 risk management strategy, this indicator not only minimizes losses but also enhances the potential for success, even in volatile market conditions.
Key Features:
Non-Repaint Signals: The Martingale ADX Indicator stands as a testament to reliability, offering 100% non-repaint signals. Traders can trust in the consistency and not removing losing Signals which is very important to trust the previous generated signals also, eliminating uncertainties and facilitating confident decision-making.
ADX-Based Precision: Built upon the robust framework of the Average Directional Index (ADX), this indicator delivers precise signals tailored to prevailing market trends and volatility levels. Whether trading in longer timeframes or engaging in Binary Options, traders can rely on the Martingale Step-1 ADX Indicator for superior insights.
Next Candle Trading: Seamlessly integrated into trading strategies, signals from the Martingale ADX Indicator prompt action on the subsequent candle. This real-time approach ensures traders stay ahead of market movements, seizing opportunities as they emerge. Giving Signals Once Candle ahead makes traders to prepare early and decide whether they want to enter the trade on presented Signal or not as per their own experience too. If the trading candle is loss then the very next candle shall be used for taking Martingale Sep-1 to enhance the Accuracy.
Enhanced Success Potential: With Martingale Step-1 risk management, this ADX Indicator offers more than just signal accuracy – it presents the potential for heightened success rates. Through strategic position sizing and leveraging experience and Price Action insights, traders can elevate overall accuracy to levels ranging from 80% to 90%.
Conclusion:
The UP DOWN Strategy-1 Indicator represents a paradigm shift in trading technology, combining precision signal generation with advanced risk management strategies. Whether you're a seasoned trader or just starting your journey, this indicator empowers you to navigate financial markets with confidence and achieve consistent results.
Experience the difference with the Martingale ADX Indicator – where reliability meets profitability, and success becomes attainable with every trade.
Trade wisely, and may your ventures be marked by prosperity and fulfillment.
Pardon for any descriptive language grammatical error and comment about this indicator and to get my other strategy as well. Happy trading !!
Risk Disclaimer:
Trading in financial markets carries inherent risks and should be approached with caution. It is imperative to exercise sound judgment and trade only with funds that you can afford to lose. We strongly advise against using borrowed funds for trading purposes. First practice on demo for own learning then make decision wisely.

FibADX MTF Dashboard — DMI/ADX with Fibonacci DominanceFibADX MTF Dashboard — DMI/ADX with Fibonacci Dominance (φ)
This indicator fuses classic DMI/ADX with the Fibonacci Golden Ratio to score directional dominance and trend tradability across multiple timeframes in one clean panel.
What’s unique
• Fibonacci dominance tiers:
• BULL / BEAR → one side slightly stronger
• STRONG when one DI ≥ 1.618× the other (φ)
• EXTREME when one DI ≥ 2.618× (φ²)
• Rounded dominance % in the +DI/−DI columns (e.g., STRONG BULL 72%).
• ADX column modes: show the value (with strength bar ▂▃▅… and slope ↗/↘) or a tier (Weak / Tradable / Strong / Extreme).
• Configurable intraday row (30m/1H/2H/4H) + D/W/M toggles.
• Threshold line: color & width; Extended (infinite both ways) or Not extended (historical plot).
• Theme presets (Dark / Light / High Contrast) or full custom colors.
• Optional panel shading when all selected TFs are strong (and optionally directionally aligned).
How to use
1. Choose an intraday TF (30/60/120/240). Enable D/W/M as needed.
2. Use ADX ≥ threshold (e.g., 21 / 34 / 55) to find tradable trends.
3. Read the +DI/−DI labels to confirm bias (BULL/BEAR) and conviction (STRONG/EXTREME).
4. Prefer multi-TF alignment (e.g., 4H & D & W all strong bull).
5. Treat EXTREME as a momentum regime—trail tighter and scale out into spikes.
Alerts
• All selected TFs: Strong BULL alignment
• All selected TFs: Strong BEAR alignment
Notes
• Smoothing selectable: RMA (Wilder) / EMA / SMA.
• Percentages are whole numbers (72%, not 72.18%).
• Shorttitle is FibADX to comply with TV’s 10-char limit.
Why We Use Fibonacci in FibADX
Traditional DMI/ADX indicators rely on fixed numeric thresholds (e.g., ADX > 20 = “tradable”), but they ignore the relationship between +DI and −DI, which is what really determines trend conviction.
FibADX improves on this by introducing the Fibonacci Golden Ratio (φ ≈ 1.618) to measure directional dominance and classify trend strength more intelligently.
⸻
1. Fibonacci as a Natural Strength Threshold
The golden ratio φ appears everywhere in nature, growth cycles, and fractals.
Since financial markets also behave fractally, Fibonacci levels reflect natural crowd behavior and trend acceleration points.
In FibADX:
• When one DI is slightly larger than the other → BULL or BEAR (mild advantage).
• When one DI is at least 1.618× the other → STRONG BULL or STRONG BEAR (trend conviction).
• When one DI is 2.618× or more → EXTREME BULL or EXTREME BEAR (high momentum regime).
This approach adds structure and consistency to trend classification.
⸻
2. Why 1.618 and 2.618 Instead of Random Numbers
Other traders might pick thresholds like 1.5 or 2.0, but φ has special mathematical properties:
• φ is the most irrational ratio, meaning proportions based on φ retain structure even when scaled.
• Using φ makes FibADX naturally adaptive to all timeframes and asset classes — stocks, crypto, forex, commodities.
⸻
3 . Trading Advantages
Using the Fibonacci Golden Ratio inside DMI/ADX has several benefits:
• Better trend filtering → Avoid false DI crossovers without conviction.
• Catch early momentum shifts → Spot when dominance ratios approach φ before ADX reacts.
• Consistency across markets → Because φ is scalable and fractal, it works everywhere.
⸻
4. How FibADX Uses This
FibADX combines:
• +DI vs −DI ratio → Measures directional dominance.
• φ thresholds (1.618, 2.618) → Classifies strength into BULL, STRONG, EXTREME.
• ADX threshold → Confirms whether the move is tradable or just noise.
• Multi-timeframe dashboard → Aligns bias across 4H, D, W, M.
⸻
Quick Blurb for TradingView
FibADX uses the Fibonacci Golden Ratio (φ ≈ 1.618) to classify trend strength.
Unlike classic DMI/ADX, FibADX measures how much one side dominates:
• φ (1.618) = STRONG trend conviction
• φ² (2.618) = EXTREME momentum regime
This creates an adaptive, fractal-aware framework that works across stocks, crypto, forex, and commodities.
⚠️ Disclaimer : This script is provided for educational purposes only.
It does not constitute financial advice.
Use at your own risk. Always do your own research before making trading decisions.
Created by @nomadhedge

Combined RSI with SMA, ADX/DI, and Stochastic IndicatorHow to Use and Apply the Indicator
This indicator combines the **RSI with SMA**, **ADX/DI**, and **Stochastic Oscillator**, providing multiple perspectives for technical analysis. Here's how you can use and apply it effectively:
1. **RSI with SMA (Relative Strength Index with Simple Moving Average)**
- **Purpose**: Measures momentum and identifies overbought or oversold levels.
- **Features**:
- **RSI (14-period)**: Tracks momentum.
- **SMA (20-period)**: Smooths the RSI for trend clarity.
- **Visual Enhancements**:
- Dashed lines at user-defined levels (default: 55 and 45).
- Highlighted zones: Above 55 (green), below 45 (red).
- Fill between RSI and SMA to indicate convergence/divergence.
- **Usage**:
- **Overbought/Oversold**: Look for RSI crossing above 70 (overbought) or below 30 (oversold).
- **Trend Strength**: If RSI stays consistently above 50 (bullish) or below 50 (bearish).
- **Divergence**: When RSI and SMA move apart, consider it a potential signal of trend change.
2. **ADX and DI (Average Directional Index with Directional Indicators)**
- **Purpose**: Measures trend strength and direction.
- **Features**:
- **ADX (14-period)**: Shows trend strength (higher values indicate stronger trends).
- **+DI and -DI**: Represent bullish and bearish directional movements.
- **Color Coding**:
- **Green**: Bullish trend.
- **Red**: Bearish trend.
- **Orange**: Weak/no trend (when ADX is below the "range" level).
- **Dynamic Fill**: Highlights areas based on whether +DI > -DI or vice versa.
- **Usage**:
- **Strong Trend**: When ADX > 30, trend is strong.
- **Bullish/Bearish Bias**: Compare +DI and -DI:
- **+DI > -DI**: Bullish bias.
- **-DI > +DI**: Bearish bias.
- **Caution Zone**: If ADX < 15, avoid trading as the market lacks direction.
### 3. **Stochastic Oscillator**
- **Purpose**: Identifies overbought and oversold conditions.
- **Features**:
- Tracks %K (fast line) and %D (signal line) for crossovers.
- Highlights overbought (>80) and oversold (<20) regions.
- Fills between %K and %D for easy visualization of crossovers.
- **Usage**:
- **Overbought/Oversold**: Look for price reversals when %K crosses %D in these regions.
- **Entry Signals**:
- Buy: %K crosses above %D in the oversold region (<20).
- Sell: %K crosses below %D in the overbought region (>80).
- **Confirm Trends**: Combine with ADX or RSI to validate signals.
General Application:
1. **Setup**: Add this script to your chart in TradingView.
2. **Interpretation**:
- Use **RSI with SMA** to identify momentum and potential trend reversals.
- Confirm trend strength and direction with **ADX/DI**.
- Refine entries/exits with **Stochastic Oscillator**.
3. **Alerts**:
- Enable alerts for buy/sell signals in ADX/DI to avoid missing key moves.
4. **Risk Management**:
- Avoid trading during low ADX periods (<15) as the market lacks direction.
- Combine signals with support/resistance levels or price patterns for better accuracy.
By integrating these indicators, this script allows for a comprehensive market analysis to enhance your decision-making.

EMA Ribbon + ADX MomentumHere's a description for your TradingView indicator publication:
The EMA Ribbon + ADX Momentum indicator combines exponential moving averages (EMA) with the Average Directional Index (ADX) to identify strong trends and potential trading opportunities. This powerful tool offers:
🎯 Key Features:
EMA Ribbon (10, 21, 34, 55) for trend direction
ADX integration for trend strength confirmation
Clear visual signals with color-coded backgrounds
Real-time trend status display
Strength metrics with exact percentage values
📊 How It Works:
EMA Ribbon: Four EMAs form a ribbon pattern that shows trend direction through their stacking order
ADX Integration: Confirms trend strength when above the threshold (default 25)
Visual Signals:
Green background: Strong bullish trend
Red background: Strong bearish trend
Gray background: Neutral or weak trend
📈 Trading Signals:
STRONG BULL: EMAs properly stacked bullish + high ADX + DI+ > DI-
STRONG BEAR: EMAs properly stacked bearish + high ADX + DI- > DI+
BULL/BEAR TREND: Shows regular trend conditions without strength confirmation
NEUTRAL: No clear trend structure
🔧 Customizable Parameters:
ADX Length: Adjust trend calculation period
ADX Threshold: Modify strength confirmation level
ADX Panel Toggle: Show/hide the ADX indicator panel
💡 Best Uses:
Trend following strategies
Entry/exit timing
Trade confirmation
Market structure analysis
Risk management tool
This indicator helps traders identify not just trend direction, but also trend strength, making it particularly useful for both position entry timing and risk management. The clear visual signals and real-time metrics make it suitable for traders of all experience levels.
Note: As with all technical indicators, best results are achieved when used in conjunction with other forms of analysis and proper risk management.

RSI & ADX Controlled Entry Signals[deepakks444]Overview:
The "RSI & ADX Immediate Entry Signals" is a TradingView Pine Script designed to provide traders with timely entry signals based on two widely-used technical indicators: the Relative Strength Index (RSI) and the Average Directional Index (ADX). This script aims to maximize responsiveness to market conditions by generating buy and sell signals that reflect the current momentum and trend strength.
Key Components:
Relative Strength Index (RSI): The RSI is a momentum oscillator that measures the speed and change of price movements. It ranges from 0 to 100, typically identifying overbought conditions above 70 and oversold conditions below 30. This script utilizes an RSI threshold of 50 to determine bullish and bearish trends.
Average Directional Index (ADX): The ADX quantifies the strength of a trend without considering its direction. By setting a configurable threshold (default of 25), the script identifies strong trends in the market, facilitating entry signals based on trend direction.
Signal Generation:
Long Entry Signal: A buy signal is generated when the following conditions are met:
The +DI line (Positive Directional Indicator) is above the -DI line (Negative Directional Indicator).
The ADX exceeds the specified threshold (indicating trend strength).
The RSI is above 50 (indicating bullish momentum).
Short Entry Signal: A sell signal is triggered under these conditions:
The -DI line is above the +DI line.
The ADX exceeds the threshold.
The RSI is below 50 (indicating bearish momentum).
User Customization:
The script allows users to adjust the lengths for both the RSI and ADX calculations directly in the input settings to better suit their trading strategy and preferred timeframe.
Users can also customize the ADX threshold to modify sensitivity.
Benefits:
Responsiveness: This script eliminates lag and minimizes the potential for missed trading opportunities by providing immediate entry signals based on current market conditions.
Simplicity: Designed to assist traders in quickly identifying trend changes, this script makes it easy to visualize potential entry points without complex calculations.
Conclusion:
The "RSI & ADX Immediate Entry Signals" script is an effective tool for traders looking to add systematic, rules-based entry signals to their analysis. By combining momentum and trend strength indicators, this script enhances decision-making and can be easily integrated into larger trading strategies.
For immediate Buy/Sell signals keep ADX length at 3.

Multi-TF AI SuperTrend with ADX - Strategy [PresentTrading]
## █ Introduction and How it is Different
The trading strategy in question is an enhanced version of the SuperTrend indicator, combined with AI elements and an ADX filter. It's a multi-timeframe strategy that incorporates two SuperTrends from different timeframes and utilizes a k-nearest neighbors (KNN) algorithm for trend prediction. It's different from traditional SuperTrend indicators because of its AI-based predictive capabilities and the addition of the ADX filter for trend strength.
BTC 8hr Performance
ETH 8hr Performance
## █ Strategy, How it Works: Detailed Explanation (Revised)
### Multi-Timeframe Approach
The strategy leverages the power of multiple timeframes by incorporating two SuperTrend indicators, each calculated on a different timeframe. This multi-timeframe approach provides a holistic view of the market's trend. For example, a 8-hour timeframe might capture the medium-term trend, while a daily timeframe could capture the longer-term trend. When both SuperTrends align, the strategy confirms a more robust trend.
### K-Nearest Neighbors (KNN)
The KNN algorithm is used to classify the direction of the trend based on historical SuperTrend values. It uses weighted voting of the 'k' nearest data points. For each point, it looks at its 'k' closest neighbors and takes a weighted average of their labels to predict the current label. The KNN algorithm is applied separately to each timeframe's SuperTrend data.
### SuperTrend Indicators
Two SuperTrend indicators are used, each from a different timeframe. They are calculated using different moving averages and ATR lengths as per user settings. The SuperTrend values are then smoothed to make them suitable for KNN-based prediction.
### ADX and DMI Filters
The ADX filter is used to eliminate weak trends. Only when the ADX is above 20 and the directional movement index (DMI) confirms the trend direction, does the strategy signal a buy or sell.
### Combining Elements
A trade signal is generated only when both SuperTrends and the ADX filter confirm the trend direction. This multi-timeframe, multi-indicator approach reduces false positives and increases the robustness of the strategy.
By considering multiple timeframes and using machine learning for trend classification, the strategy aims to provide more accurate and reliable trade signals.
BTC 8hr Performance (Zoom-in)
## █ Trade Direction
The strategy allows users to specify the trade direction as 'Long', 'Short', or 'Both'. This is useful for traders who have a specific market bias. For instance, in a bullish market, one might choose to only take 'Long' trades.
## █ Usage
Parameters: Adjust the number of neighbors, data points, and moving averages according to the asset and market conditions.
Trade Direction: Choose your preferred trading direction based on your market outlook.
ADX Filter: Optionally, enable the ADX filter to avoid trading in a sideways market.
Risk Management: Use the trailing stop-loss feature to manage risks.
## █ Default Settings
Neighbors (K): 3
Data points for KNN: 12
SuperTrend Length: 10 and 5 for the two different SuperTrends
ATR Multiplier: 3.0 for both
ADX Length: 21
ADX Time Frame: 240
Default trading direction: Both
By customizing these settings, traders can tailor the strategy to fit various trading styles and assets.

Advanced Market Dashboard - Compact Atr,bb,Dcng%,RSI,ADX,vwapDescription of the Advanced Market Dashboard Indicator:
This Pine Script indicator is a comprehensive technical dashboard designed for use with TradingView. The indicator displays key market metrics, price changes, and popular technical indicators directly on the chart in real-time.
Features of the Indicator
1. Price and Price Change
Current Price: Displays the current closing price of the symbol (e.g., $100.50).
Change in Price:
Value Change: Displays how much the price has changed compared to the previous period (e.g., "+$2.50").
Percentage Change: Shows the percentage difference between the previous period's close and the current price (e.g., "+2.5%").
Period Selection: Allows you to choose the time period for this change (e.g., 1 minute, daily, weekly, or monthly).
Example:
Current Price = $150.50
Change = +$1.25 (+0.83%)
2. VWAP (Volume Weighted Average Price)
VWAP represents the average price of a security weighted by volume. It’s widely used by intraday traders to gauge where the market price is relative to typical buying/selling levels.
Plot of VWAP is included on the chart for easy visualization.
3. ATR (Average True Range)
Displays ATR (21 period), an indicator commonly used for understanding price volatility.
Higher ATR values indicate higher volatility, while lower ATR values suggest lower volatility.
4. RSI (Relative Strength Index)
Displays RSI (21 period):
RSI is a popular oscillator that measures price momentum strength.
Ranges from 0 to 100:
Values above 70 indicate overbought conditions.
Values below 30 indicate oversold conditions.
Includes visual overbought/oversold lines (70 and 30) plotted directly on the chart.
5. ADX (Average Directional Index)
Displays ADX (14 period), which measures the strength of a trend:
ADX above 25: Indicates a strong trend.
ADX below 25: Indicates weak or no trend.
Includes a reference line (25) plotted on the chart to help interpret trend direction.
6. Bollinger Bands
Displays:
Upper Band: Basis + (StdDev × multiplier)
Lower Band: Basis - (StdDev × multiplier)
Middle Line: Simple Moving Average (SMA)
Bollinger Bands help identify volatility and potential buy/sell opportunities:
Price near the upper band: Indicates overbought conditions.
Price near the lower band: Indicates oversold conditions.
Plots all three bands directly on the chart for visual guidance.
Compact Table
The indicator organizes all data into a clean, compact table in the top-right corner of the chart. Each metric is displayed alongside its value:
Symbol Name and Price
Example:
Price Change
Example:
VWAP
Example:
ATR
Example:
RSI
Example:
ADX
Example:
Bollinger Upper Band
Example:
Bollinger Lower Band
Example:
Visual Plots on Chart
In addition to the table display, the following indicators are visually plotted on the chart for easy reference:
VWAP
Bollinger Bands (Upper, Lower, and Middle)
RSI Overbought/oversold levels
ADX Trend strength reference line (value = 25)
Customizable Settings
ATR Length: Default = 21.
RSI Length: Default = 21.
ADX Length: Default = 14.
Bollinger Band Parameters:
Length: Default = 20.
Standard Deviation: Default = 2.0.
Price Change Periods: Choose between:
1-minute
Daily
Weekly
Monthly.
How to Use
Add the script to your TradingView chart.
In the indicator settings, configure lengths and periods according to your preference.
Use the compact table for real-time metrics and refer to the chart plots for visual insights.
Who Should Use This Indicator?
This indicator is ideal for:
Day Traders: Use VWAP, ATR, RSI, and Bollinger Bands for intraday price action.
Trend Followers: Use ADX to confirm trending markets.
Technical Analysts: Quickly access multiple technical metrics without adding multiple indicators.
Swing Traders: Use Bollinger Bands and RSI for spotting overbought/oversold conditions.
Why This Indicator Stands Out?
Multiple Indicators in One: Eliminates the need to add separate indicators for VWAP, ATR, RSI, ADX, Bollinger Bands, and price changes.
Compact Design: Data displayed neatly in a table to reduce chart clutter.
Customizability: Users can fine-tune settings for their specific trading style.
Real-time Updates: Values are recalculated dynamically on each new bar, ensuring accuracy.
Limitations
This indicator is solely designed for informational purposes and does not provide buy/sell signals automatically.
The accuracy of Bollinger Bands, RSI, VWAP, etc., depends on the selected input parameters.
The price change feature may not work for extended periods in tick charts or non-standard timeframes.
Conclusion
This Advanced Market Dashboard is a powerful all-in-one tool for traders and analysts who require real-time market metrics. It combines essential indicators while maintaining a user-friendly interface for both novice and professional traders.

Smart Buy/Sell Signal IndicatorOverview
The Smart Buy/Sell Signal Indicator is a multi-factor trading tool that i ntegrates Supertrend, Bollinger Bands, RSI, ADX, and Moving Averages to generate high-probability buy and sell signals. Unlike simple crossover-based strategies, this indicator leverages multiple layers of confirmation to reduce false signals and improve trade execution accuracy.
This indicator is designed for trend-following traders, scalpers, and swing traders, helping them identify key reversal points and momentum shifts with precise breakout conditions.
How It Works
The Smart Buy/Sell Signal Indicator filters out weak trade signals by combining trend, volatility, momentum, and strength indicators in the following manner:
✅ Supertrend-Based Trend Filtering:
• The script checks if the price is above or below the Supertrend level before confirming a buy or sell signal.
• Buy signals occur below the Supertrend Down level, confirming support.
• Sell signals occur above the Supertrend Up level, confirming resistance.
✅ Bollinger Bands for Overbought & Oversold Conditions:
• Buy signals are confirmed when price touches the Bollinger Lower Band (suggesting oversold conditions).
• Sell signals are confirmed when price touches the Bollinger Upper Band (suggesting overbought conditions).
• This ensures that trades occur at high-probability reversal zones, rather than random price action.
✅ RSI Momentum Confirmation:
• Buy trades trigger when RSI is below 50 (indicating strength building from an oversold region).
• Sell trades trigger when RSI is above 50 (indicating weakness forming in an overbought region).
• This ensures signals are momentum-backed and not counter-trend moves.
✅ ADX Strength Confirmation:
• The script filters signals using the ADX (Average Directional Index) to ensure that only trades with sufficient market strength are executed.
• If the ADX value is below a threshold (default: 15), the signal is ignored to prevent false breakouts in choppy markets.
✅ Confirmation Moving Average (MA) for Trend Validation:
• The script applies an additional confirmation filter using a Moving Average (SMA/EMA).
• Buy signals trigger only when the price is above the MA, aligning with trend direction.
• Sell signals trigger only when the price is below the MA, ensuring alignment with the broader market structure.
✅ Trade Cooldown Mechanism (Minimum Bars Between Signals):
• To avoid frequent signals in sideways markets, a cooldown period is implemented.
• Default: 5 bars between signals (adjustable).
• Prevents rapid consecutive trades, reducing false entries.
Key Features
✔️ Supertrend & Moving Average Confirmation – Ensures trades are taken only in the correct trend direction.
✔️ Bollinger Bands Integration – Helps identify high-probability reversal zones.
✔️ ADX Strength Filtering – Ensures trades are only executed when the market has enough strength.
✔️ Momentum-Based RSI Filtering – Avoids counter-trend trades and confirms directional strength.
✔️ Trade Cooldown Mechanism – Reduces overtrading and noise in sideways markets.
✔️ Webhook Alerts for Automation – Auto-execute trades or receive real-time notifications.
✔️ Customizable Inputs – Adjustable thresholds, EMA/SMA length, ADX filter, cooldown period for flexibility.
✔️ Works Across Multiple Timeframes – Suitable for scalping (5m, 15m), swing trading (1H, 4H), and position trading (Daily).
How to Use
📌 Scalping & Intraday Trading:
• Use on 5m, 15m, or 30m timeframes.
• Look for Bollinger Band touch + RSI confirmation + Supertrend support/resistance validation before entering trades.
📌 Swing Trading:
• Use on 1H or 4H timeframes.
• Enter only when ADX is strong and price aligns with Supertrend direction.
📌 Webhook Automation:
• Set up TradingView Alerts to auto-execute trades via Webhook-compatible platforms.
Why This Combination?
This indicator is not just a simple moving average crossover tool.
It is designed to filter out weak breakouts and only execute trades that have:
✅ Trend confirmation (Supertrend + Moving Average)
✅ Volatility filtering (Bollinger Bands for overbought/oversold confirmation)
✅ Momentum validation (RSI threshold filtering)
✅ Market strength requirement (ADX ensures sufficient momentum)
This multi-layered approach ensures that only the highest-quality setups are executed, improving both win rate and reliability.
Why It’s Worth Using?
🚀 Reduces False Breakouts – Avoids weak breakouts by requiring ADX confirmation.
🚀 Works in All Market Conditions – Trend-following logic for trending markets, volatility-based entries for reversals.
🚀 Customizable to Any Trading Style – Adjustable parameters for trend, momentum, and strength filtering.
🚀 Seamless Webhook Automation – Execute trades automatically with TradingView alerts.
🚀 Ready to trade smarter?
✅ Add the Smart Buy/Sell Signal Indicator to your TradingView chart today! 🎯🔥

Alpine Predictive BandsAlpine Predictive Bands - ADX & Trend Projection is an advanced indicator crafted to estimate potential price zones and trend strength by integrating dynamic support/resistance bands, ADX-based confidence scoring, and linear regression-based price projections. Designed for adaptive trend analysis, this tool combines multi-timeframe ADX insights, volume metrics, and trend alignment for improved confidence in trend direction and reliability.
Key Calculations and Components:
Linear Regression for Price Projection:
Purpose: Provides a trend-based projection line to illustrate potential price direction.
Calculation: The Linear Regression Centerline (LRC) is calculated over a user-defined lookbackPeriod. The slope, representing the rate of price movement, is extended forward using predictionLength. This projected path only appears when the confidence score is 70% or higher, revealing a white dotted line to highlight high-confidence trends.
Adaptive Prediction Bands:
Purpose: ATR-based bands offer dynamic support/resistance zones by adjusting to volatility.
Calculation: Bands are calculated using the Average True Range (ATR) over the lookbackPeriod, multiplied by a volatilityMultiplier to adjust the width. These shaded bands expand during higher volatility, guiding traders in identifying flexible support/resistance zones.
Confidence Score (ADX, Volume, and Trend Alignment):
Purpose: Reflects the reliability of trend projections by combining ADX, volume status, and EMA alignment across multiple timeframes.
ADX Component: ADX values from the current timeframe and two higher timeframes assess trend strength on a broader scale. Strong ADX readings across timeframes boost the confidence score.
Volume Component: Volume strength is marked as “High” or “Low” based on a moving average, signaling trend participation.
Trend Alignment: EMA alignment across timeframes indicates “Bullish” or “Bearish” trends, confirming overall trend direction.
Calculation: ADX, volume, and trend alignment integrate to produce a confidence score from 0% to 100%. When the score exceeds 70%, the white projection line is activated, underscoring high-confidence trend continuations.
User Guide
Projection Line: The white dotted line, which appears only when the confidence score is 70% or higher, highlights a high-confidence trend.
Prediction Bands: Adaptive bands provide potential support/resistance zones, expanding with market volatility to help traders visualize price ranges.
Confidence Score: A high score indicates a stronger, more reliable trend and can support trend-following strategies.
Settings
Prediction Length: Determines the forward length of the projection.
Lookback Period: Sets the data range for calculating regression and ATR.
Volatility Multiplier: Adjusts the width of bands to match volatility levels.
Disclaimer: This indicator is for educational purposes and does not guarantee future price outcomes. Additional analysis is recommended, as trading carries inherent risks.

RSI 15/60 and ADX PlotIn this script, the buy and sell criteria are based on the Relative Strength Index (RSI) values calculated for two different timeframes: the 15-minute RSI and the hourly RSI. These timeframes are used together to check signals when certain thresholds are crossed, providing confirmation across both short-term and longer-term momentum.
Buy Criteria:
Condition 1:
Hourly RSI > 60: This means the longer-term momentum shows strength.
15-minute RSI crosses above 60: This shows that the shorter-term momentum is catching up and confirms increasing strength.
Condition 2:
15-minute RSI > 60: This indicates that the short-term trend is already strong.
Hourly RSI crosses above 60: This confirms that the longer-term trend is also gaining strength.
Both conditions aim to capture the moments when the market shows increasing strength across both short and long timeframes, signaling a potential buy opportunity.
Sell Criteria:
Condition 1:
Hourly RSI < 40: This indicates that the longer-term trend is weakening.
15-minute RSI crosses below 40: The short-term momentum is also turning down, confirming the weakening trend.
Condition 2:
15-minute RSI < 40: The short-term trend is already weak.
Hourly RSI crosses below 40: The longer-term trend is now confirming the weakness, indicating a potential sell.
These conditions work to identify when the market is showing weakness in both short-term and long-term timeframes, signaling a potential sell opportunity.
ADX Confirmation :
The Average Directional Index (ADX) is a key tool for measuring the strength of a trend. It can be used alongside the RSI to confirm whether a buy or sell signal is occurring in a strong trend or during market consolidation. Here's how ADX can be integrated:
ADX > 25: This indicates a strong trend. Using this threshold, you can confirm buy or sell signals when there is a strong upward or downward movement in the market.
Buy Example: If a buy signal (RSI > 60) is triggered and the ADX is above 25, this confirms that the market is in a strong uptrend, making the buy signal more reliable.
Sell Example: If a sell signal (RSI < 40) is triggered and the ADX is above 25, it confirms a strong downtrend, validating the sell signal.
ADX < 25: This suggests a weak or non-existent trend. In this case, RSI signals might be less reliable since the market could be moving sideways.
Final Approach:
The RSI criteria help identify potential overbought and oversold conditions in both short and long timeframes.
The ADX confirmation ensures that the signals generated are happening during strong trends, increasing the likelihood of successful trades by filtering out weak or choppy market conditions.
This combination of RSI and ADX can help traders make more informed decisions by ensuring both momentum and trend strength align before entering or exiting trades.

Directional Movement Index with double exponential moving averagThe Directional system is a trend-following method developed by J. Welles Wilder,
in the mid-1970s. It identifies trends and shows
when a trend is moving fast enough to make it worth following. It helps traders to
profit by taking chunks out of the middle of important trends.
Trading Rules
1. Trade only from the long side when the positive Directional line is above the
negative one. Trade only from the short side when the negative Directional line
is above the positive one. The best time to trade is when the ADX is rising, show-
ing that the dominant group is getting stronger.
2. When ADX declines, it shows that the market is becoming less directional. There
are likely to be many whipsaws. When ADX points down, it is better not to use
a trend-following method.
3. When ADX falls below both Directional lines, it identifies a flat, sleepy mar-
ket. Do not use a trend-following system but get ready to trade, because major
trends emerge from such lulls.
4. The single best signal of the Directional system comes after ADX falls below
both Directional lines. The longer it stays there, the stronger the base for the
next move. When ADX rallies from below both Directional lines, it shows that
the market is waking up from a lull. When ADX rises by four steps
from its lowest point below both Directional lines, it “rings a bell” on a
new trend . It shows that a new bull market or bear market is being
born, depending on what Directional line is on top.
5. When ADX rallies above both Directional lines, it identifies an overheated mar-
ket. When ADX turns down from above both Directional lines, it shows that the
major trend has stumbled. It is a good time to take profits on a directional trade.
If you trade large positions, you definitely want to take partial profits.
This particular version uses DEMA (double exponential moving averages) in attempt to catch moves sooner.