ADX and DI - Trader FelipeADX and DI - Trader Felipe
This indicator combines the Average Directional Index (ADX) and the Directional Indicators (DI+ and DI-) to help traders assess market trends and their strength. It is designed to provide a clear view of whether the market is in a trending phase (either bullish or bearish) and helps identify potential entry and exit points.
What is ADX and DI?
DI+ (Green Line):
DI+ measures the strength of upward (bullish) price movements. When DI+ is above DI-, it signals that the market is experiencing upward momentum.
DI- (Red Line):
DI- measures the strength of downward (bearish) price movements. When DI- is above DI+, it suggests that the market is in a bearish phase, with downward momentum.
ADX (Blue Line):
ADX quantifies the strength of the trend, irrespective of whether it is bullish or bearish. The higher the ADX, the stronger the trend:
ADX > 20: Indicates a trending market (either up or down).
ADX < 20: Indicates a weak or sideways market with no clear trend.
Threshold Line (Gray Line):
This horizontal line, typically set at 20, represents the threshold for identifying whether the market is trending or not. If ADX is above 20, the market is considered to be in a trend. If ADX is below 20, it suggests that the market is not trending and is likely in a consolidation phase.
Summary of How to Use the Indicator:
Trend Confirmation: Use ADX > 20 to confirm a trending market. If ADX is below 20, avoid trading.
Long Entry: Enter a long position when DI+ > DI- and ADX > 20.
Short Entry: Enter a short position when DI- > DI+ and ADX > 20.
Avoid Sideways Markets: Do not trade when ADX is below 20. Look for other strategies for consolidation phases.
Exit Strategy: Exit the trade if ADX starts to decline or if the DI lines cross in the opposite direction.
Combine with Other Indicators: Use additional indicators like RSI, moving averages, or support/resistance to filter and confirm signals.
Cerca negli script per "adx"

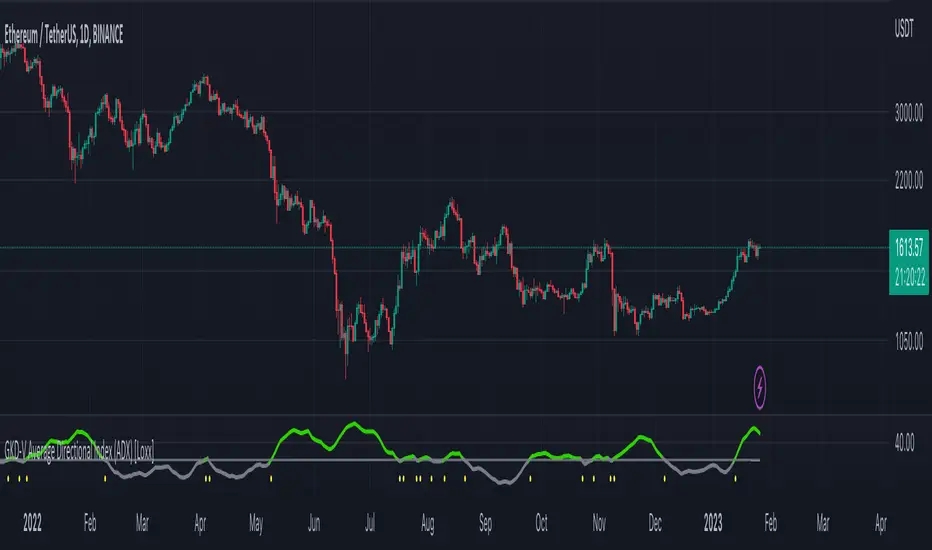
GKD-V Average Directional Index (ADX) [Loxx]Giga Kaleidoscope Average Directional Index (ADX) is a Volatility/Volume module included in Loxx's "Giga Kaleidoscope Modularized Trading System".
█ Giga Kaleidoscope Modularized Trading System
What is Loxx's "Giga Kaleidoscope Modularized Trading System"?
The Giga Kaleidoscope Modularized Trading System is a trading system built on the philosophy of the NNFX (No Nonsense Forex) algorithmic trading.
What is an NNFX algorithmic trading strategy?
The NNFX algorithm is built on the principles of trend, momentum, and volatility. There are six core components in the NNFX trading algorithm:
1. Volatility - price volatility; e.g., Average True Range, True Range Double, Close-to-Close, etc.
2. Baseline - a moving average to identify price trend
3. Confirmation 1 - a technical indicator used to identify trends.
4. Confirmation 2 - a technical indicator used to identify trends.
5. Continuation - a technical indicator used to identify trends.
6. Volatility/Volume - a technical indicator used to identify volatility/volume breakouts/breakdown.
7. Exit - a technical indicator used to determine when a trend is exhausted.
How does Loxx's GKD (Giga Kaleidoscope Modularized Trading System) implement the NNFX algorithm outlined above?
Loxx's GKD v1.0 system has five types of modules (indicators/strategies). These modules are:
1. GKD-BT - Backtesting module (Volatility, Number 1 in the NNFX algorithm)
2. GKD-B - Baseline module (Baseline and Volatility/Volume, Numbers 1 and 2 in the NNFX algorithm)
3. GKD-C - Confirmation 1/2 and Continuation module (Confirmation 1/2 and Continuation, Numbers 3, 4, and 5 in the NNFX algorithm)
4. GKD-V - Volatility/Volume module (Confirmation 1/2, Number 6 in the NNFX algorithm)
5. GKD-E - Exit module (Exit, Number 7 in the NNFX algorithm)
(additional module types will added in future releases)
Each module interacts with every module by passing data between modules. Data is passed between each module as described below:
GKD-B => GKD-V => GKD-C(1) => GKD-C(2) => GKD-C(Continuation) => GKD-E => GKD-BT
That is, the Baseline indicator passes its data to Volatility/Volume. The Volatility/Volume indicator passes its values to the Confirmation 1 indicator. The Confirmation 1 indicator passes its values to the Confirmation 2 indicator. The Confirmation 2 indicator passes its values to the Continuation indicator. The Continuation indicator passes its values to the Exit indicator, and finally, the Exit indicator passes its values to the Backtest strategy.
This chaining of indicators requires that each module conform to Loxx's GKD protocol, therefore allowing for the testing of every possible combination of technical indicators that make up the six components of the NNFX algorithm.
What does the application of the GKD trading system look like?
Example trading system:
Backtest: Strategy with 1-3 take profits, trailing stop loss, multiple types of PnL volatility, and 2 backtesting styles
Baseline: Leader Exponential Moving Average
Volatility/Volume: Average Directional Index (ADX) as shown on the chart above
Confirmation 1: Double Smoothed Stochastic of Momentum
Confirmation 2: Jurik Turning Point Oscillator
Continuation: Fisher Transform
Exit: Rex Oscillator
Each GKD indicator is denoted with a module identifier of either: GKD-BT, GKD-B, GKD-C, GKD-V, or GKD-E. This allows traders to understand to which module each indicator belongs and where each indicator fits into the GKD protocol chain.
Giga Kaleidoscope Modularized Trading System Signals (based on the NNFX algorithm)
Standard Entry
1. GKD-C Confirmation 1 Signal
2. GKD-B Baseline agrees
3. Price is within a range of 0.2x Volatility and 1.0x Volatility of the Goldie Locks Mean
4. GKD-C Confirmation 2 agrees
5. GKD-V Volatility/Volume agrees
Baseline Entry
1. GKD-B Baseline signal
2. GKD-C Confirmation 1 agrees
3. Price is within a range of 0.2x Volatility and 1.0x Volatility of the Goldie Locks Mean
4. GKD-C Confirmation 2 agrees
5. GKD-V Volatility/Volume agrees
6. GKD-C Confirmation 1 signal was less than 7 candles prior
Continuation Entry
1. Standard Entry, Baseline Entry, or Pullback; entry triggered previously
2. GKD-B Baseline hasn't crossed since entry signal trigger
3. GKD-C Confirmation Continuation Indicator signals
4. GKD-C Confirmation 1 agrees
5. GKD-B Baseline agrees
6. GKD-C Confirmation 2 agrees
1-Candle Rule Standard Entry
1. GKD-C Confirmation 1 signal
2. GKD-B Baseline agrees
3. Price is within a range of 0.2x Volatility and 1.0x Volatility of the Goldie Locks Mean
Next Candle:
1. Price retraced (Long: close < close or Short: close > close )
2. GKD-B Baseline agrees
3. GKD-C Confirmation 1 agrees
4. GKD-C Confirmation 2 agrees
5. GKD-V Volatility/Volume agrees
1-Candle Rule Baseline Entry
1. GKD-B Baseline signal
2. GKD-C Confirmation 1 agrees
3. Price is within a range of 0.2x Volatility and 1.0x Volatility of the Goldie Locks Mean
4. GKD-C Confirmation 1 signal was less than 7 candles prior
Next Candle:
1. Price retraced (Long: close < close or Short: close > close )
2. GKD-B Baseline agrees
3. GKD-C Confirmation 1 agrees
4. GKD-C Confirmation 2 agrees
5. GKD-V Volatility/Volume Agrees
PullBack Entry
1. GKD-B Baseline signal
2. GKD-C Confirmation 1 agrees
3. Price is beyond 1.0x Volatility of Baseline
Next Candle:
1. Price is within a range of 0.2x Volatility and 1.0x Volatility of the Goldie Locks Mean
3. GKD-C Confirmation 1 agrees
4. GKD-C Confirmation 2 agrees
5. GKD-V Volatility/Volume Agrees
█ Average Directional Index (ADX)
What is Average Directional Index (ADX)
Trading in the direction of a strong trend reduces risk and increases profit potential. The average directional index (ADX) is used to determine when the price is trending strongly. In many cases, it is the ultimate trend indicator. After all, the trend may be your friend, but it sure helps to know who your friends are.
ADX is used to quantify trend strength. ADX calculations are based on a moving average of price range expansion over a given period of time. The default setting is 14 bars, although other time periods can be used. ADX can be used on any trading vehicle such as stocks, mutual funds, exchange-traded funds and futures.
ADX is plotted as a single line with values ranging from a low of zero to a high of 100. ADX is non-directional; it registers trend strength whether price is trending up or down. The indicator is usually plotted in the same window as the two directional movement indicator (DMI) lines, but for our purposes here, we are only concerned with the ADX itself.
Signals
Traditional: ADX is above the threshold cutoff; both longs/shorts triggered when ADX is above the threshold cutoff
Crossing: ADX crosses above/below the threshold cutoff; longs or shorts are only valid on the candle where the cross happens. Both cross-ups and cross-downs are valid for both shorts and longs
Signal Modifiers
X-Bar Rule: If signals occur within XX bars, then the signal is still valid
Bars Rising: This is for traditional signals only. This requires that an upward slop of ADX be present over XX bars
Other things to note
The GKD trading system requires that a GKD-V indicator be present in the indicator chain, but the GKD-V indicator doesn't need to be active. You can turn on/off the Volatility Ratio as you wish so you can backtest your trading strategy with the filter on or off.
Additional features will be added in future releases.
This indicator is only available to ALGX Trading VIP group members . You can see the Author's Instructions below to get more information on how to get access.
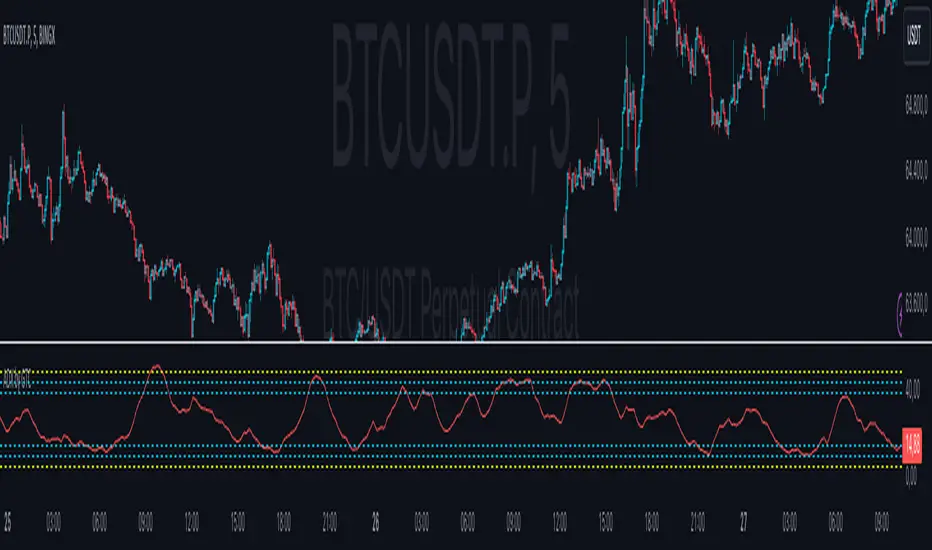
Range Opening (ADX)▶ OVERVIEW
Range Opening (ADX) dynamically detects market opening ranges triggered by ADX (Average Directional Index) momentum shifts. Upon a user-defined ADX crossover or crossunder event, it builds a volume-based range box that tracks high and low prices over a fixed bar length and visualizes order flow pressure with delta volume and breakout buffer zones.
▶ RANGE TRIGGER VIA ADX CROSSOVER
The range begins when ADX crosses a custom threshold, indicating a shift in trend strength:
Users choose between ADX crossover or crossunder as the trigger.
Once triggered, the indicator starts collecting price and volume data for the specified “Range Opening Length.”
The ADX plot on the subchart is colored dynamically using a green-to-magenta gradient based on its strength.
A small label marks the ADX crossover/crossunder event visually.
▶ RANGE DEVELOPMENT BOX
While the range is forming:
Price highs and lows over the defined period are collected and stored.
A temporary gray box is drawn between the maximum high and minimum low, showing the developing range.
At each bar, delta volume is updated:
Positive if close > open
Negative if close < open
A total delta volume value is shown inside the developing box for real-time monitoring.
▶ RANGE COMPLETION & BREAKOUT LINES
Once the range completes (after the defined bar count):
The gray box is replaced with a finalized, color-coded range box.
Color Logic:
Green box if delta volume is positive (bullish bias)
Magenta box if delta is negative (bearish bias)
Two solid horizontal lines are drawn:
Top line from the range high
Bottom line from the range low
Two dashed lines are added above and below the range using ATR-based buffers, acting as buffer zones.
These lines extend until a new ADX trigger occurs, helping track future price interaction with the range.
▶ INFO PANEL & STATUS MONITORING
A compact data table appears in the top-right corner, offering quick insight:
ADX: Current value, color-coded to strength.
Threshold: User-defined trigger level.
Range Status:
Shows a green diamond when range is still forming.
Shows a magenta diamond after the range has completed.
Tooltip updates to “Developing” or “Formatted” based on stage.
▶ USAGE
Traders can use Range Opening (ADX) to:
Identify periods of strength expansion and price consolidation using ADX signals.
Track breakout potential and liquidity zones formed during opening-type setups.
Monitor delta volume to gauge buying/selling bias inside short-term ranges.
Use ATR buffer zones for breakout confirmation or fade setups.
Visually mark where the most recent structured range was defined.
▶ CONCLUSION
Range Opening (ADX) offers a systematic method to detect and monitor market ranges triggered by volatility surges. With real-time delta volume insight, persistent breakout levels, and ADX-driven logic, it serves as a versatile tool for both breakout traders and range strategists looking to capitalize on momentum-based setups.

[SM-042] EMA 5-8-13 with ADX FilterWhat is the strategy?
The strategy combines three exponential moving averages (EMAs) — 5, 8, and 13 periods — with an optional ADX (Average Directional Index) filter. It is designed to enter long or short positions based on EMA crossovers and to exit positions when the price crosses a specific EMA. The ADX filter, if enabled, adds a condition that only allows trades when the ADX value is above a certain threshold, indicating trend strength.
Who is it for?
This strategy is for traders leveraging EMAs and trend strength indicators to make trade decisions. It can be used by anyone looking for a simple trend-following strategy, with the flexibility to adjust for trend strength using the ADX filter.
When is it used?
- **Long trades**: When the 5-period EMA crosses above the 8-period EMA, with an optional ADX condition (if enabled) that requires the ADX value to be above a specified threshold.
- **Short trades**: When the 5-period EMA crosses below the 8-period EMA, with the ADX filter again optional.
- **Exits**: The strategy exits a long position when the price falls below the 13-period EMA and exits a short position when the price rises above the 13-period EMA.
Where is it applied?
This strategy is applied on a chart with any asset on TradingView, with the EMAs and ADX plotted for visual reference. The strategy uses `strategy.entry` to open positions and `strategy.close` to close them based on the set conditions.
Why is it useful?
This strategy helps traders identify trending conditions and filter out potential false signals by using both EMAs (to capture short-term price movements) and the ADX (to confirm the strength of the trend). The ADX filter can be turned off if not desired, making the strategy flexible for both trending and range-bound markets.
How does it work?
- **EMA Crossover**: The strategy enters a long position when the 5-period EMA crosses above the 8-period EMA, and enters a short position when the 5-period EMA crosses below the 8-period EMA.
- **ADX Filter**: If enabled, the strategy checks whether the ADX value is above a set threshold (default is 20) before allowing a trade.
- **Exit Conditions**: Long positions are closed when the price falls below the 13-period EMA, and short positions are closed when the price rises above the 13-period EMA.
- **Plotting**: The strategy plots the three EMAs and the ADX value on the chart for visualization. It also displays a horizontal line at the ADX threshold.
This setup allows for clear decision-making based on the interaction between different time-frame EMAs and trend strength as indicated by ADX.

ADX by GTCADX with 6 configurable lines
Average Directional Index (ADX)
Definition
The Average Directional Index (ADX) is a specific indicator used by technical analysts and traders to determine the strength of a trend. The trend can be either bullish or bearish, which is shown by two indicators that often accompany the ADX, the positive directional indicator, commonly known as +DI, and the negative directional indicator, also known as -DI. For this reason, the Average Directional Index is presented with three separate lines, which symbolize each indicator. Each line is used to help evaluate a trade and whether it should be taken long or short, if at all. The ADX indicator on TradingView does not show the +DI and -DI lines by itself, but you can use the Directional Movement Index (DMI) indicator to view all three at the same time.
History
The Average Directional Index was initially designed by Welles Wilder for daily commodity charts, but was later modified so that it could be used in other markets and for various time frames. These modifications allowed the ADX to become what it is today: an indicator for tracking the strength of market trends and analyzing those trends with the help of additional directional indicators.
Calculations
Due to the fact that the Average Directional Index includes multiple lines, the indicator requires a sequence of calculations, which are outlined below.
Start by calculating the +DM, -DM, and True Range (TR) for each period you are analyzing. Please note:
+DM = Current High - Previous High
-DM = Previous Low - Current Low
You can use +DM when Current High - Previous High > Previous Low - Current Low.
Use -DM when Previous Low - Current Low > Current High - Previous High.
The TR is the largest of the following values: Current High - Current Low, Current High - Previous Close, or Current Low - Previous Close.
Go ahead and smooth your +DM, -DM, and TR period averages. Then plug in the -DM and +DM values to calculate the smoothed averages of them.
First xTR = Sum of first x TR readings (x = number of...)
Next xTR value = First xTR - (Previous xTR/14) + Current TR
Next, divide the smoothed +DM value by the smoothed TR value to get your +DI value. Multiply this value by 100.
Divide the smoothed -DM value by the smoothed TR value to get your -DI value. Multiply this value by 100.
The formula for the Directional Movement Index (DX) is +DI minus -DI, then divided by the sum of +DI and -DI (these are all absolute values). Multiply this value by 100.
To get the ADX, you will need to keep calculating the DX values for x periods. Smooth the results over the periods to get your ADX value.
First ADX = the sum of x periods of DX / x
Lastly, ADX = ((Previous ADX * 13) + Current DX) / x
Conclusions and what to look for
The Average Directional Index (ADX), as well as the Negative (-DI) / Positive (+DI) Directional Indicators, are momentum indicators and help investors determine the strength of a trend and the direction of the trend...
The Average Directional Index projects the market price and is clearly seen when prices are rising (when +DI is above -DI), and when prices are falling (when -DI is above +DI). When there are crossovers between the +DI and -DI lines, it can mean potential trading signals as a bearish or bullish market is emerging.
A trend shows the most strength when the Average Directional Index is above 25 (potential buy signal), and a trend is weak or the price is considered trendless if the ADX is below 20, according to the creator of the concept, Wilder. Thought, if the ADX is below 20, it may not be the most suitable time to enter a trade.
If the market presents itself as not following a particular trend, this does not mean that the price is not moving, but it could be making a change or that the direction is not present at that moment.
Limitations
Crossovers between the lines of the indicators can occur quite frequently. In the event that this occurs too frequently, there is most likely to be confusion among traders and the potential for losing money can be high. These moments in question are known as "false signals" and are more frequent when the ADX is calculated below 25.
The Average Directional Index should be combined with other indicators that examine price and with others that can help filter signals and control risk to get the most out of the tool. Like most indicators, it works best when combined with well-functioning data processors and other analytical tools.
Summary
In short, the Average Directional Index
ADX Divergence and Gap Monitor [theUltimator5]ADX Divergence and Gap Monitor is a custom technical analysis tool designed to visualize momentum imbalances and sudden shifts in trend participation using the ADX system. It combines traditional ADX, DI+ and DI− calculations with dynamic filtering and visual highlighting to help identify key moments of directional acceleration or weakening.
🔍 What It Does:
This indicator builds on the Average Directional Index (ADX) system to detect conditions where market trend strength diverges significantly from directional input (DI) activity. It includes two major visual signals:
Highlight Backgrounds
These appear when the indicator detects a “gap” or sudden acceleration in DI values while ADX remains low, suggesting early-stage momentum bursts or signal noise spikes.
The trigger threshold for DI change can be adjusted using the Gap Trigger Level input.
A background highlight is shown when DI+ or DI− increases sharply, either from a low-ADX environment or from a rapid standalone spike.
GAP Markers
Optional yellow label markers display the word "GAP" just below the lowest line (ADX, DI+, or DI−) whenever a gap condition is triggered. These provide a more noticeable visual cue without crowding the chart.
You can enable or disable the markers with the Show GAP Markers toggle.
🧠 Advanced Divergence Detection:
The script also scans for dominant ADX divergence events, where ADX is significantly higher than DI+ or DI−, indicating strong trend force with weak directional participation. When these conditions are met:
Red or green background fills appear depending on whether DI+ or DI− is being overpowered.
These conditions are based on customizable moving averages and DI strength relationships.
⚙️ Key Inputs:
ADX Length: Period for ADX calculation
DI Moving Average: Smoothing length for directional index signals
Gap Trigger Level: Minimum DI change needed to trigger a GAP highlight
Show Highlight Backgrounds: Toggle to display or hide background signals
Show GAP Markers: Toggle to show or hide text-based GAP labels
🧪 Use Cases:
Spot early breakouts or reversals when DI activity spikes while ADX is still low
Identify periods of trend exhaustion or false breakouts using divergence logic
Confirm trade entry points when ADX begins to rise after a GAP event

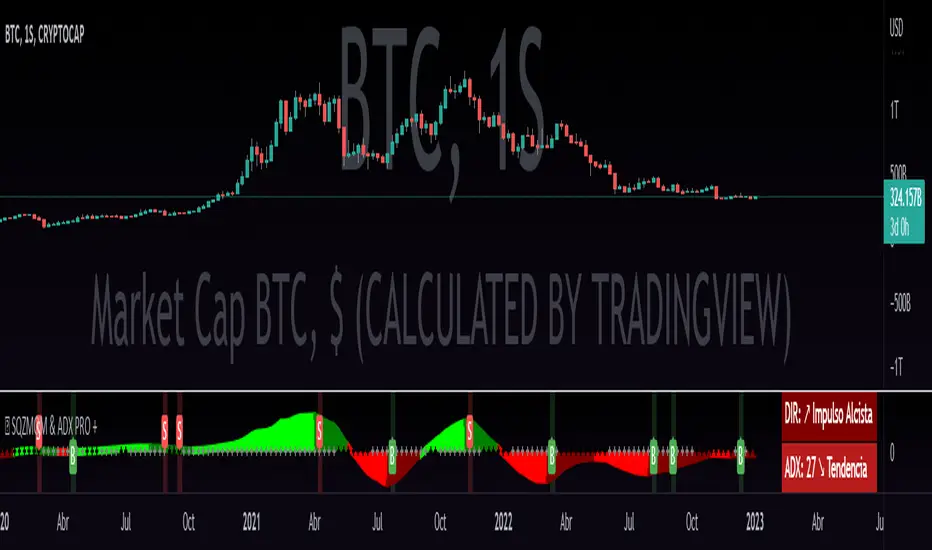
QZMOM & ADX PRO+The Momentum Squeeze Indicator is a momentum oscillator that indicates how explosively the price will move. Its first known version was called "TTM Squeeze" by John Carter explained in his book "Mastering the Trade" (chapter 11) and popularized in TradingView by a developer named LazyBear.
The black crosses on the center line show that the market has just entered a consolidation. This means low volatility, the market is preparing for an explosive move (up or down). The gray crosses mean the "Squeeze". Carter suggests waiting until the first gray after a black cross and taking a position in the direction of the oscillator. For its part, LazyBear recommends using an additional indicator such as ADX to improve the effectiveness of entry points and position closures.
Oscillator understanding improvements:
During the indicator creation process we were able to better understand the logic of the oscillator and based on that knowledge we implemented improvements.
Oscillator development improvements:
Side panel:
The ADX algorithm was incorporated, which is displayed numerically on the right panel of the indicator, shows the value of ADX and its directionality.
Added an arrow pointer to indicate oscillator directionality.
Two exponential moving averages of 11 and 55 periods have been added to the right panel, this will mark if the trend is bullish or bearish depending on the crossover of the EMAs.
An indicator of the Indicator Squeeze was also included, which marks the periods of price consolidation (OFF) and the periods in which the price should react explosively.
Added a feature that allows automatic color changing of the panels based on the color of the oscillator and the ADX.
o ADX: Dark green (bullish force).
o ADX: Light green (loss of bullish strength).
o ADX: Dark red (bearish force).
o ADX: Light red (loss of bearish strength).
o ADX: Orange (loss of strength, disinterest and low volume).
Signs:
A very famous strategy that we have learned is that of the trading expert Jaime Merino, who by combining the Momentum Squeeze Indicator and a ADX común, logró vincular eficientemente la debilidad del ADX con el inicio de un momentum alcista o bajista. La parametrización de su estrategia se señaló en alertas de compra y venta, que se representan de la siguiente manera:
B (Comprar): se activa cuando un movimiento bajista marcado por el ADX (pendiente negativa) termina y el oscilador toma direccionalidad alcista (impulso alcista).
S (Vender): se activa cuando un movimiento alcista marcado por el ADX (pendiente negativa) termina y el oscilador toma direccionalidad bajista (momentum bajista).
Filter:
To prevent any trader from trading against the trend, a filter was added that limits bearish entry alerts when the trend is up and vice versa, that is, when the EMA 10 is above the EMA 55, it is understood that the trend is up in that time frame, therefore bearish entry alerts will not be triggered. It will be the decision of each trader to activate or deactivate this function.
Alerts:
This is without a doubt the most awaited function for all Latin American traders, (Just kidding), but being aware, I am very proud of the implementation of alerts for each improvement made to this indicator, if you decide to use the Momentum Squeeze Indicator you can automate alerts for the following actions:
Buy and sell alerts.
Alerts to activate the Squeeze to (ON).
Oscillator quadrant change alerts
or bullish momentum.
or bearish momentum.
o Bullish force.
o Bearish force.
Recommendations:
One of the things that became clearer in the development of this indicator is the coloring of the dials, which is why we recommend the use of four colors, one for each oscillator grid.
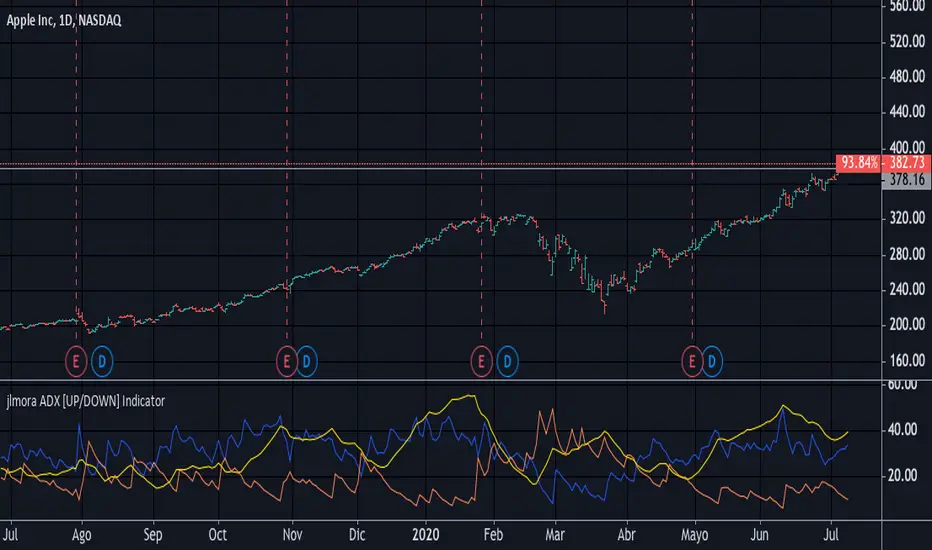
jlmora ADX IndicatorThe ADX also informs us of the prevailing market trend through the positive / negative movement indicators. Being able to determine the existence of a trend in the market and its strength is fundamental, since not all indicators or systems work correctly in different types of markets.
1. Operate only from long positions when the positive directional line is above the negative. Trade only from short positions when the negative directional line is above the positive. The best time to trade is when the ADX is on the rise, showing that the dominant group is strengthening.
2. When the ADX falls, it shows that the market is becoming less discretionary. There are likely to be a few unexpected turns. When the ADX points down, it is preferable not to use trend tracking methods.
3. When the ADX falls below both directional lines, this identifies a flat and sleepy market. Do not use a trend tracking system, but be prepared to trade as major trends emerge from such calm periods.
4. The best individual directional signal is given after the ADX falls below both directional lines. The longer it stays there, the stronger the base of the next move will be. When the ADX rebounds from below both directional lines, it shows that the market is waking up from a calm period. When the ADX grows four or more steps (for example, 9 to 13) from its lowest point below both directional lines, it is "ringing the bell" on a new trend. It shows that a new bull or bear market is emerging, depending on which directional line is above it. When the ADX rebounds above both directional lines, it is identifying an overheated market. When the ADX crosses both directional lines down, it shows that a major trend has entered. It is a good time to collect benefits in a directional operation. If you trade from long positions, you will definitely want to pick up partial gains. Market indicators give strong signals and weak signals. For example, when a moving average changes direction, it is a strong signal. A downward inflection of the ADX is a weak signal. Once you see that the ADX has been turned down, you should be very careful adding to open positions. You should start to collect profits, reduce positions and try to exit.
Triple SWMA + EMA Crossover Color Candle+ ADX Color Candle V2! IMPORTANT !
To better see the color of the bars I suggest you deactivate the Borders option in the chart settings / Symbol, LIKE THIS:
════════════════════════════════════════════════════════════════════════════════════════════════════════════════════
The indicator is the same as the previous version, with the only difference that now the indicator is composed of an addition of secondary candles colored according to the EMA cross, while the main candles based on the ADX, the SWMA are inserted into secondary candles
════════════════════════════════════════════════════════════════════════════════════════════════════════════════════
1) SWMA
There are 3 SWMA , with the possibility of modifying the Source and the length of each one, also each SWMA can be removed or can all of them be removed with the ON / OFF option in Inputs-STYLE. (ALL SWMA?)
════════════════════════════════════════════════════════════════════════════════════════════════════════════════════
2) EMA Fast and Slow, Cross
There are two EMAs, fast and slow, both with the possibility of changing the source and length, in the chart settings it is possible to change the color of EMA Long and EMA Short:
EMA Long = Ema Fast > Ema Slow
EMA Short = Ema Slow > Ema Fast
Ema cross has a style choice option, the possible choices are:
NONE = nothing
ALL = all choices
LINE = ema200 colored based on Ema Long-Short
BAR COLOR = color candles based on Ema Long-Short
PLOTSHAPE = signals based on Ema Long-Short
LINE + BAR COLOR = line + bar color
BAR COLOR + PLOTSHAPE = bar color + plotshape
════════════════════════════════════════════════════════════════════════════════════════════════════════════════════
3) ADX Candle
The candles are colored according to 4 inputs:
Color 1 ( Silver ) = ADX < 20
Color 2 (Black) = ADX cross-ADX Index (adx+adx 14 period back) / 2
Color 3 (Lime) = ADX > 0 and DI delta (DI plus - DI minus) > 0
Color 4 (Red) = ADX > 0 and DI delta (DI plus - DI minus) < 0
all colors are editable and if you don't want to have ADX Candle on the chart, just remove the ON / OFF option in Inputs-STYLE. (BAR COLOR ADX )

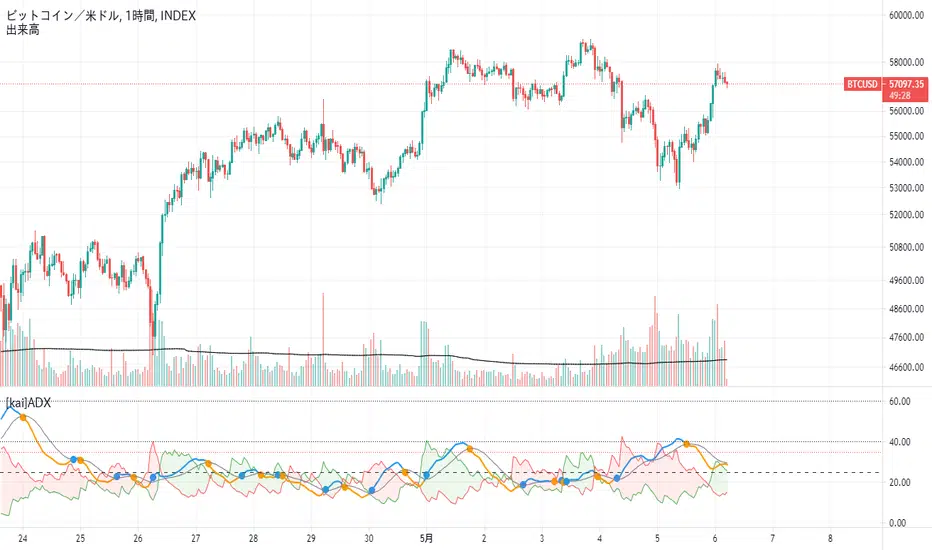
[kai]ADXIt is an indicator that makes it easy to understand the change of ADX by adding a moving average to the famous indicator ADX.
Since ADX and DI have a part where the calculation formula of DI + and DI- is fixed to one bar, there was a problem that it does not make much sense to increase the length.
The biggest feature of this indicator is that it allows you to calculate multiple bars by increasing the multipler option.
For example, by setting multipler = 4 in the 1-hour time frame, it is possible to resemble the calculation result of the 4-hour bar in a multi-time frame.
How to use this Inge is the same as how to use ADX and DI
When ADX (orange) GX (blue circle), take a position in the direction of DI (green zone, red zone),
I think the payment is good when ADX (blue) is DX (orange circle)
when DI +(green), DI-(red) is 35 or more, contrarian is dangerous.
有名なインジケーターのADXに移動平均を付けてADXの変化をわかりやすくしたインジケーターです
ADXとDIはDI+,DI-の計算式がバー一本固定の部分があるので、lengthを増やしてもあまり意味がない問題がありました
このインジではmultiplerオプションを増やすことによって、複数のバーを計算できるようにしたのが最大の特徴になります
例えば1時間足でmultipler=4にすることでかなりマルチタイムフレームの4時間足の計算結果に似せることができます
このインジの使い方は、ADX、DIの使い方と同じです
ADX(オレンジ)がGX(青丸)した時にDI(緑塗り、赤塗り)の方向にポジションを取って、
ADX(青)がDX(オレンジ丸)した時に、決済がよいと思います
DI+(緑),DI-(赤)が35以上の時に逆張りは危険です
Volatility Adjusted ADX (VADX)I sincerely wish to express my heartfelt gratitude to the vast community of coders on TradingView who have previously crafted various Average Directional Index (ADX) scripts. Their innovative approaches have laid a solid foundation, and I'm incredibly grateful for their inspiring work. In essence, their accomplishments have ignited the creative spark that led to the development of the Volatility Adjusted ADX (VADX) script.
VADX is not your run-of-the-mill script. It distinguishes itself from the myriad of ADX indicators on TradingView due to its unique volatility-adjustment mechanism. The primary purpose of this script is to augment the ADX's ability to quantify trend strength by introducing a layer of sensitivity to volatility shifts through the Average True Range (ATR). The interaction between these two crucial market measurements is where the novelty lies.
While the standard ADX does an excellent job of diagnosing the trend's vigor, its evaluation can sometimes be skewed when markets oscillate between periods of high and low volatility. Integrating the ATR – a reliable indicator of market volatility – into the ADX calculation mitigates this limitation, resulting in a more robust, volatility-adjusted trend strength measurement.
The specifics of the mathematical adjustment, our secret ingredient, will remain undisclosed for proprietary reasons. Nevertheless, I assure you that it creates a dynamic and balanced interplay between the trend strength and volatility, enabling a more nuanced understanding of the market.
The VADX script is user-friendly and includes three main inputs: ADX Smoothing, DI Length, and ATR Length. The ADX Smoothing parameter refines the ADX calculation, DI Length determines the period for the Directional Movement System calculation, and the ATR Length sets the period for the Average True Range.
Using this indicator is as easy as pie. After adding it to your chart, VADX will manifest itself as a separate panel beneath your price chart. When the VADX is escalating, it indicates that the strength of the trend is intensifying. Conversely, a declining VADX suggests diminishing trend strength. Two horizontal lines at the 25 and 75 levels provide a simple interpretation guide – they denote weak and strong trend phases, respectively.
This robust indicator is adaptable and can be effectively applied across multiple markets - from stocks, forex, and futures to cryptocurrencies. It also delivers valuable insights on any timeframe. However, as with any new indicator, I highly recommend initial testing and optimization to match your unique trading style and objectives.
To wrap up, the VADX indicator sets itself apart with its novel volatility adjustment, a feature not commonly found in existing TradingView scripts. This distinctive capability affords traders a more comprehensive view of the trend's strength by accounting for market volatility, adding an extra layer of depth to traditional ADX interpretation. I sincerely hope that this script enriches your trading arsenal and assists you in navigating the market with enhanced precision. As always, happy trading!

RiverFlow ADX ScreenerRiverFlow ADX Screener, Scans ADX and Donchian Trend values across various Timeframes. This screener provides support to the Riverflow indicator. Riverflow concept is based on Two indicators. Donchian Channel and ADX or DMI.
How to implement?
1.Donchian Channel with period 20
2. ADX / DMI 14,14 threshold 20
Entry / Exit:
1. Buy/Sell Signal from ADX Crossovers.
2. Trend Confirmation Donchian Channel.
3. Major Trend EMA 200
Buy/Sell:
After a buy/sell is generated by ADX Crossover, Check for Donchian Trend. it has to be in same direction as trend. for FTT trades take 2x limit. for Forex and Stocks take 1:1.5, SL must be placed below recent swing. One can use Riverflow indicator for better results.
ADX Indicator is plotted with
Plus: Green line
Minus: Red Line
ADX strength: plotted as Background area.
TREND: Trend is represented by Green and Red Area around Threshold line
Table:
red indicates down trend
green indicates up trend
grey indicates sideways
Weak ADX levels are treated sideways and a channel is plotted on ADX and PLUS and MINUS lines . NO TRADES are to be TAKEN on within the SIDEWAYS region.
Settings are not required as it purely works on Default settings. However Donchian Length can be changed from settings.
Timeframes below 1Day are screened. Riverflow strategy works on timeframe 5M and above timeframe. so option is not provided for lower timeframes.
Best suits for INTRADAY and LONG TERM Trading

Triple SWMA + EMA Crossover Color Candle+ ADX Color CandleIMPORTANT
The indicator allows you to view the Color Bars only if it is in the foreground, to do this just put the indicator before the description of the symbol, LIKE THIS:
════════════════════════════════════════════════════════════════════════════════════════════════════════════════════════════════
This indicator is composed of:
1) Tiple SWMA
There are 3 SWMA, with the possibility of modifying the Source and the length of each one, also each SWMA can be removed or can all of them be removed with the ON / OFF option in Inputs-STYLE. (ALL SWMA?)
════════════════════════════════════════════════════════════════════════════════════════════════════════════════════════════════
2) EMA Fast and Slow, Cross
There are two EMAs, fast and slow, both with the possibility of changing the source and length, in the chart settings it is possible to change the color of EMA Long and EMA Short
EMA Long = Ema Fast > Ema Slow
EMA Short = Ema Slow > Ema Fast
Ema cross has a style choice option, the possible choices are:
ALL = all choices
LINE = ema200 colored based on Ema Long-Short
BAR COLOR = color candles based on Ema Long-Short
PLOTSHAPE = signals based on Ema Long-Short
LINE + BAR COLOR = line + bar color
BAR COLOR + PLOTSHAPE = bar color + plotshape
if you don't want to have EMA Fast and Slow, Cross on the chart, just remove the ON / OFF option in Inputs-STYLE. (EMA style)
════════════════════════════════════════════════════════════════════════════════════════════════════════════════════════════════
3) ADX Candle
The candles are colored according to 4 inputs:
Color 1 (Silver) = ADX < 20
Color 2 (Black) = ADX cross-ADX Index (adx+adx 14 period back) / 2
Color 3 (Lime) = ADX > 0 and DI delta (DI plus - DI minus) > 0
Colo 4 (Red) = ADX > 0 and DI delta (DI plus - DI minus) < 0
all colors are editable and if you don't want to have ADX Candle on the chart, just remove the ON / OFF option in Inputs-STYLE. (BAR COLOR ADX)

Crypto Directional Movement Index DMI/ADXCrypto ADX + DMI
This indicator is a customised version of the ADX + DMI by J. Welles Wilder in 1978, with default settings optimal for cryptocurrencies.
What is the DMI (ADX) Indicator?
According to Investopedia:
DMI (ADX) consists of three indicators that measure a trend’s strength and direction. Three lines compose the Direction Movement Index (DMI): ADX (black line), DI+ (green line), and DI- (red line). The Average Directional Index (ADX) line shows the strength of the trend. The higher the ADX value, the stronger the trend. The color of the lines can be altered, but black, green, and red are the default in most software.
The Plus Direction Indicator (DI+) and Minus Direction Indicator (DI-) show the current price direction. When the DI+ is above DI-, the current price momentum is up. When the DI- is above DI+, the current price momentum is down.
This Version
The ADX default value has been changed to from 14 to 2 (optimal for cryptocurrencies). The background flashes red when the –DMI goes above the HZ1 threshold and green when the +DMI does the same. There is an option to change it so that it’ll only flash when the ADX and the DMI are both above the threshold. The ADX changes color when above HZ1.
Red and green plotshapes appear at DMI crossovers and three horizontal lines have also been added.
Any suggestions are most welcome

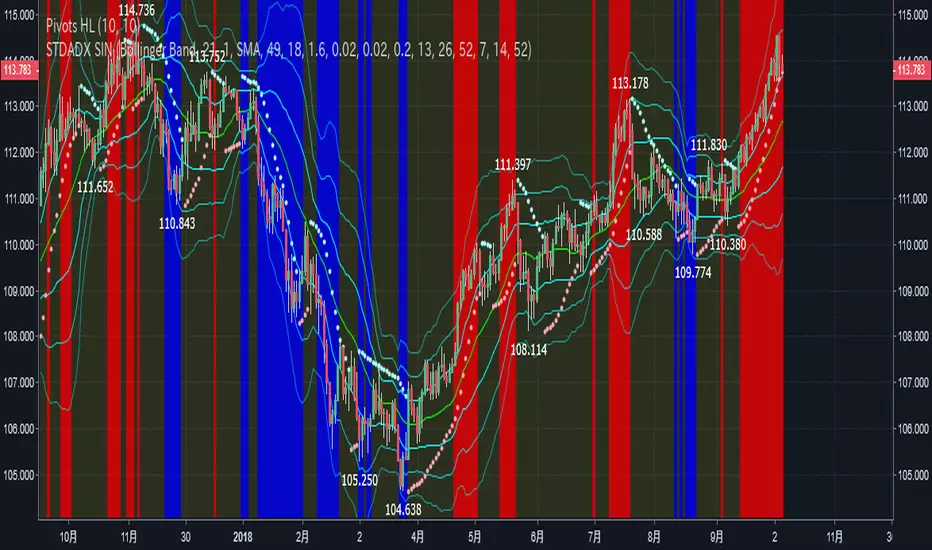
STD-ADX Trade Signal(TypeM Ver2.0)==日本語説明も併記 // Japanese discription is following ==
Draw the trend judgment on the chart by combining the " Triple Smoothed ADX ", " Triple Standard Deviation " and "Bollinger Band".
This script was created by adding logic to STD-ADX Trade Signal(Basic Ver1.0) and making adjustments.
The comparison between this script and STD-ADX Trade Signal(Basic Ver1.0) is as follows.
In addition, we can set alerts at the time of occurrence of each signal of buying trend, selling trend, profit fixing of each selling and buying.
Red = Up trend
Blue = Down trend
Yellow = Range
" Triple Smoothed ADX " and " Triple Standard Deviation " in combination with" Triple STD-ADX " is recommended.
========================================================
「 Triple Smoothed ADX 」と「 Triple Standard Deviation 」、「Bollinger Band」を組み合わせたトレンド判断をチャート上に描画します。
このスクリプトは「 STD-ADX Trade Signal(Basic Ver1.0) 」にロジックを追加、調整してできています。
STD-ADX Trade Signal(Basic Ver1.0) との比較は次の通りです。
また、買いトレンド、売りトレンド、売買それぞれの利益確定の各シグナルの発生時点でアラートを設定できるようにしています。
赤=上昇トレンド
青=下降トレンド
黄=レンジ
「 Triple Smoothed ADX 」と「 Triple Standard Deviation 」を組み合わせた「Triple STD-ADX」を併せて表示させることをおすすめします。
NSDT MA+ADXThis script combines Moving Averages with ADX Strength, but with an added bonus. Rather than having the Moving Average line always plot on the chart, it will reference the ADX strength based on the settings by the trader.
This way, the Moving Average will not show on the chart unless there is also a strong direction in the trend. This may potentially be used to help with entries when trend trading due to adding the ADX for trend strength.
In the examples below, the ADX settings in the MA+ADX indicator are matched with the settings of a standalone ADX indicator at the bottom of the chart (not included, just for reference).
MA+ADX
prnt.sc
ADX Only
prnt.sc
You will see how the MA only plots when the ADX is over the threshold, currently set at 25. (arrows drawn to indicate confluence)

Excellent ADXThe Average Directional movement indeX (ADX) is an indicator that helps you determine the trend direction, pivot points, and much more else! But it looks not so easy as other famous indicators. It seems strange or even terrible, but don't be afraid. Let's understand how it works and get its power into your analysis tactics.
In the beginning, imagine a drunk man goes through a ladder: step by step. Up, up, down, up, down, down, up...
How can we understand which direction he goes? Exactly! We can count the number of steps in each direction. In the above example, in the upward – 4, in the downward – 3. So, it looks like he goes in an upward direction.
The ADX indicator counts the same steps, but for price. The size of each step equals 1 ATR for "DI Length" candles. On the indicator chart, we have the green and red lines. The green line represents a number of steps upward. The red line shows one downward. When the red line upper green, then the price goes below, then the trend is directed down. Later the green line comes above the red one, and then the trend changes the direction to upward. Wow? After that, you can easy detect the trend direction on the market!
But it is still not the end. On the chart, we also have the fat blue line. This is the ADX line, and it represents the power of the trend. It is calculated from a distance between the green and red curves. The ADX line value grows if the distance is increased. If the movement is really powerful, then a number of steps into a direction much more prominent than one in an opposed direction. Then the blue line grows faster. But if the growth has stopped and the blue line turns back or already had changed self-direction, then it is a signal that the trend has ended too. It's an excellent sign to close the position (but not always). Easy? Not quite. Thresholds help you there. The indicator has two additional parameters: upper and lower thresholds to evaluate the trend-over signal strength. An u-turn of the ADX line above the upper threshold sends a strong signal. If one occurs between both thresholds, it is a bit weak signal. But if the blue line goes below the lower threshold, it looks like there is no trend, and the price goes side. We can also say that the price goes side when the ADX value gradually falls down.
The Excellent ADX indicator helps you catch pivot/pullback signals based on green, red, and blue lines. Each such signal is highlighted as a green (buy) or red (sell) dot on the plot. The size of the dot represents the strength of the signal. You can also check the position of green and red lines from each other to determine the trend direction and the place where it has been changed. The Excellent ADX indicator helps you there too. It highlights the trend direction by the background-color, so you'll never miss it! The Excellent ADX good compliance with the Price Channel indicator built for the same length. You can use them together to be on a trend wave always!

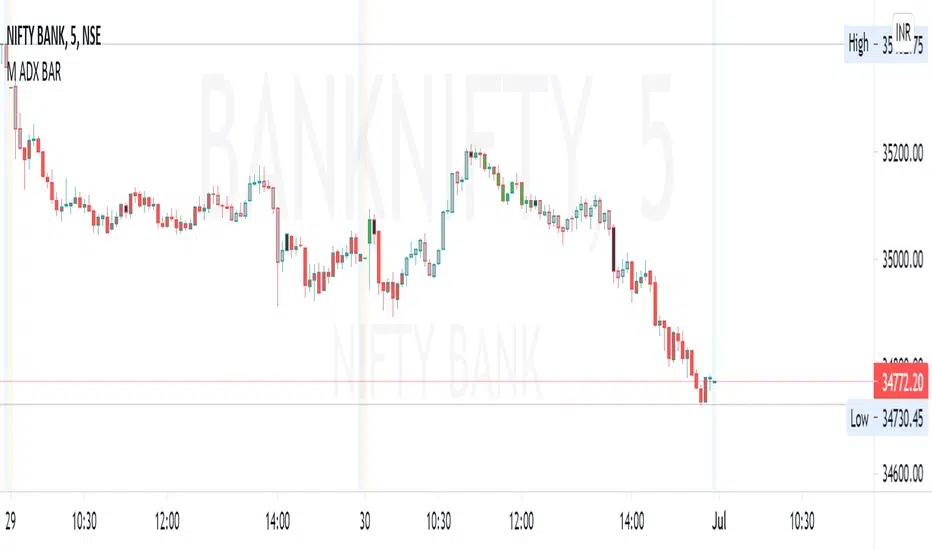
M ADX BARBar colors based on ADX and DI strength.
How to study:
ADX is less then 20 (adjustable value) is SILVER (no trend)
ADX >0 and DI delta (DI plus - DI minus) is >0 color LIME (trend up)
ADX>0 and DI delta <0 color RED (trend down)
ADX cross ADX Index ( adx+adx 14 period back)/2 color is BLACK and means start/end of trend
Converting the ADX into Bars for ease of use... (combining with RSI gives best results.. Timeframe 3min or more
[ALERTS] ADX and DIThe average directional index (ADX) is a technical analysis metric. Analysts use it to determine the relative strength of a trend, with the direction of the trend either upwards or downwards.
The Average Directional Index (ADX) along with the Negative Directional Indicator (-DI) and the Positive Directional Indicator (+DI) are momentum strength indicators that evolved for use in stock trading. Commodities trader J. Welles Wilder pioneered their use. Technical traders who use charting techniques want to know when first spotting a shifting trend how strong that trend is and how likely it is to sustain itself over time. The ADX helps investors determine trend strength as they plan their investment strategies.
Confirmation on a chart and other momentum indicators help investors spot trend reversals. But some trends are more potent than others and investors want to better understand the strength of a trend. The ADX identifies a strong positive trend when the ADX is over 25 and a weak trend when the ADX is below 20. Investors can determine directional movement by analyzing the difference between two consecutive low prices and their correlated highs. The movement is +DM when the current high price, less the previous high price, is greater than the previous low price less the current low. The opposite applies in determining the negative or –DI.
When analyzing charts, stock price is the single most important variable to follow. ADX and other indicators are supplementary to price movements in providing additional directional information and support. For example, some of the best trends come about from price range consolidation. It is those tugs of war between buying and selling volumes that lead to breakouts and other trading opportunities.
The Inventor of the Average Directional Index
J. Welles Wilder, Jr. is a former American engineer and real estate developer who went on to revolutionize trading analysis by applying mathematical systems to the world of investing. In addition to developing the ADX, Wilder is also responsible for several other commonly used technical analysis tools including the Average True Range (ATR), the Relative Strength Index (RSI) and the Parabolic SAR.
www.investopedia.com
This script has alerts and includes the filter for markets with no trend defined.
Green Alert --> Long
Red Alert --> Short
Yellow Area --> Weak trend. ADX below threshold
Green candles --> Bullish Market
Red Candles --> Bearish Market
Orange candles --> No defined trend
Enjoy!

DMI Histogram & SRSI Crossover with ADX filteringUses DMI rendered as a histogram & overbought/sold SRSI crossovers to highlight areas of increased likelihood of reversal/signals.
This is the same as the DMI Histogram & SRSI found at the below link except that it uses ADX to filter trades and the DMI Thresholds are set to 0/-0 (optional if you want more aggressive filtering at a set threshold. Leave at zero if you only want to use ADX to filter).
Red dot above histogram - indicates overbought SRSI crossover occurred above the DMI threshold in an upward DMI and ADX > 25
Green dot below histogram - indicates oversold SRSI crossover occurred below the DMI threshold in a downward DMI and ADX > 25
Red plotted line is the ADX
DMI threshold can be adjusted to eliminate choppy low DMI crossovers (displayed as transparent red zone on the histogram). Set to 0 / -0 to display all SRSI crossovers for that DMI.
SRSI overbought/sold adjustable. Note : it has been offset to align with the histogram (-50 to 50 instead of the standard 0 to 100).
Other settings standard for SRSI etc.
Also ADX is displayed offset around the threshold and aligned with the horizontal 0 axis. So if you filter out trades where ADX < 25 then the ADX line will be plotted so values < 25 display below zero and vice versa. It makes it easier to visually identify the trend strength (when it passes over 0 it represents confirmed trend strength and the DMI/SRSI crossover signals will then display).
You can adjust the ADX threshold in the settings. Standard are usually 20 or 25(default).

Directional Movement Indicator (DMI and ADX) - TartigradiaDirection Movement Indicator (DMI) is a trend indicator invented by Welles Wilder, who also authored RSI.
DMI+ and DMI- respectively indicate pressure towards bullish or bearish trends.
ADX is the average directional movement, which indicates whether the market is currently trending (high values above 25) or ranging (below 20) or undecided (between 20 and 25).
DMX is the non smoothed ADX, which allows to detect transitions from trending to ranging markets and inversely with zero lag, but at the expense of having much more noise.
This is an extended indicator, from the original one by BeikabuOyaji, please show them some love if you appreciate this indicator:
Usage: To use this indicator for entry: when DMI+ crosses over DMI-, there is a bullish sentiment, however ADX also needs to be above 25 to be significant, otherwise the move is not necessarily sustainable.
Inversely, when DMI+ crosses under DMI- and ADX is above 25, then the sentiment is significantly bearish, but if ADX is below 20, the signal should be disregarded.
This indicator automatically highlights the background in green when ADX is above 25, and in red when ADX is below 20, to ease interpretation.
Also, arrows can be activated in the Style menu to automatically show when the two conditions described above are met, or these can be used in a strategy.

Parabolic SAR with the ADX overlayThe following indicator and chart pattern is based on a twist from Welles Wilder's parabolic stop and reverse . This is a trend following system which is essentially a dynamic trailing stop loss for longs and shorts. The system is often criticized for it's poor performance in choppy rangebound markets so people often combine it with other signals that attempt to identify a "trend" the ADX is a popular indicator with three indicators, the DI+ "Positive Directional Indicator" the DI- "Negative Directional Indicator" and then a combination of the two, the ADX "Average Directional Indicator". Generally speaking, if the DI+ is above the DI- and the ADX is greater than 25 then we are in a positive trending market. If the DI+ is less than the DI- and the ADX is greater than 25 then we are in a negative trending market. If the ADX is less than 25 then there is no trend in place and we are in a range bound "choppy market".
So, I created this chart to show when the ADX is > 25 (or you can enter your own number) and the DI+ is > DI- then the background will be green. Vice versa, when the ADX is >25 and the DI+ is < DI- then we are in a negative trending market and the background color will be red. If the ADX is < 25 (or whatever you choose) then we are in a choppy 'range-bound" market.
Regarding the ParSAR. Pay attention to the "+" marks. they indicate whether we are bullish or bearish. When we cross through a + then we revert to the opposite. "Stop And Reverse". They are a simple calculation of a starting percentage, an incremental increase in that percentage, and a max percentage increase. If you want your system to trade less, decrease the "maximum" If you want it to trade more, increase the maximum.
Tinker around with these and you might find a healthy strategy you can trade on.
If you add Take Profit Targets and Stop Loss Targets, this is an even more productive strategy. Try it out on BINANCE:ETHUSDT with a 2hr time horizon and 0.02, 0.023, 0.2.

LIZ ADX+DMIThe thick lines represent ADX .
When the volatility increases, it faces up and the color changes from gray to green.
When the background is gray and starts to turn green from below the horizontal line of reference value of 20, the volatility increases, indicating that the environment is becoming easier to trade.
When ADX rises and then peaks out, the line goes down and the previously green line changes to gray.
This means that the trend that was going on before is now over.People who hold positions use them to sign off their hands.
Also, those who want to see the trend change and build a new position with a backstop can use it to sign their entries.
When the background is gray (due to the deterioration of ADX ), it indicates that the volatility is low, there is no value width, and the direction is unclear, so it's not a good time to trade.
The two thin lines, red and blue, are DMI.A red line at the top and a blue line at the bottom indicates that the buying power is dominant, and the gap between the two lines is painted red.
On the other hand, if the blue line is up and the red line is down, it shows that the selling power is superior and it is painted blue.
When the two ADX lines intersect, and the color between the lines is changing from red to blue or blue to red, it indicates that the buyer's advantage has changed.
You can look at when the line crosses, and then enter in the new direction of dominance and build a position.
You can also determine that your position is in line with the market flow if it is in line with your current predominance.
However, in the opposite case, it suggests that the position you have is not in the right direction.
When two DMI lines are crossed frequently, it indicates a range or random rate.
In such cases, the background is often gray, indicating that it is difficult to make a profit in trade.
If you are interested in the invitation-only indicator, please contact us on private chat.
太い線はADXを表してます。
ボラティリティーが上昇すると上を向き、色がグレーから緑に変化します。
背景がグレーの期間で、水平線で示す基準値20より低い位置から上を向き緑に変化し始める時、ボラティリティーが上昇し、トレードしやすい環境になりつつある事を示唆しています。
ADXが上昇し、やがてピークアウトするとラインが下を向き、それまで緑だったラインの色がグレーに変わります。これは、それまで続いていたトレンドが一旦終了した事を意味します。
ポジションを持っていた人は、手仕舞いのサインに使います。
また、トレンドの転換を確認し、逆張りで新規ポジションの構築を狙っている人はエントリーのサインに使えます。
ADXが低下しているせいで,背景がグレーになっている時は,ボラティリティーが低下しており、値幅がなく、方向性がはっきりしないという理由で取引に向いていない時期である事を示します。
赤、青2本の細いラインはDMIです。赤いラインが上、青いラインが下の時は買い勢力が優勢である事を示し、2本の線の間が赤に塗られます。
反対に青いラインが上、赤いラインが下の時は売り勢力が優勢である事を示し、青に塗られます。
2本のADXラインが交差し、線の間に塗られた色が、
赤から青、または青から赤に変化する時、買い方売り方の優劣が入れ替わった事を示唆します。
ラインがクロスするタイミングを見て、新しく優勢になった方向にエントリーし、ポジションを構築できます。
また、自分が既に持っているポジションが、現在優勢である方向と一致している時はマーケットの流れに合っていると判断できます。
しかし反対の時は、あなたが持っているポジションの方向が合っていない事を示唆しています。
2本のDMIラインが頻繁にクロスしている時は、レンジ相場やランダム相場である事を示唆します。
そのような時は背景もグレーになっている時が多く、トレードで利益を出すのが難しい環境である事を表しています。
招待専用インジに興味ある方はプライベートチャットに連絡をください。
