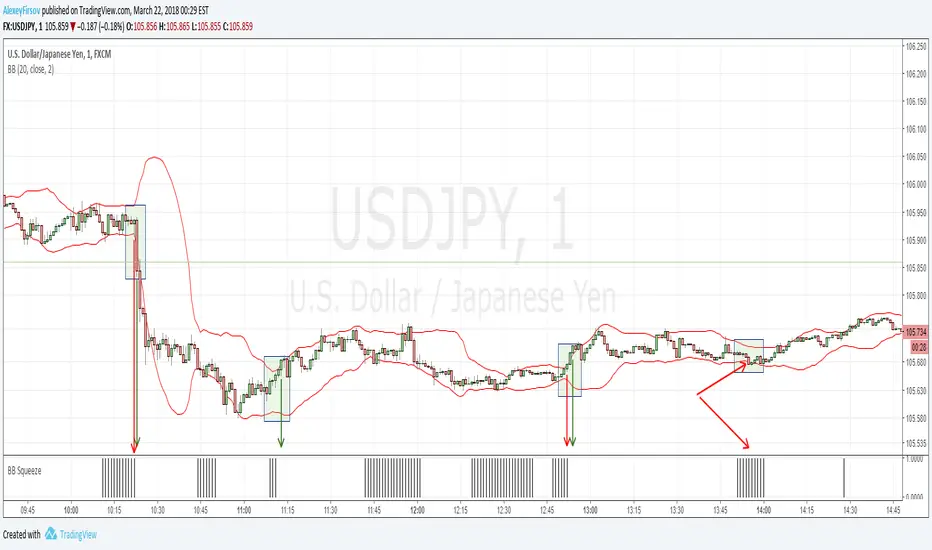
Bollinger Bands SqueezeEnglish:
Simple histogram, showing Squeeze of Bollinger Bands.
Usage is simple - when price is in Squeeze, no entries in any direction. For using with Bollinger Bands indicator, including binary options.
Russian
Простой индикатор, наглядной отображающий стадию Сжатия лент Боллинджера.
Простой в использовании - когда цена в Сжатии - не входим в сделку. Особенно эффективен при связке с индикатором лент Боллинджера и входе в сделку при раскрытии лент. Также применим для бинарных опционов
Example/Пример
Cerca negli script per "binary"
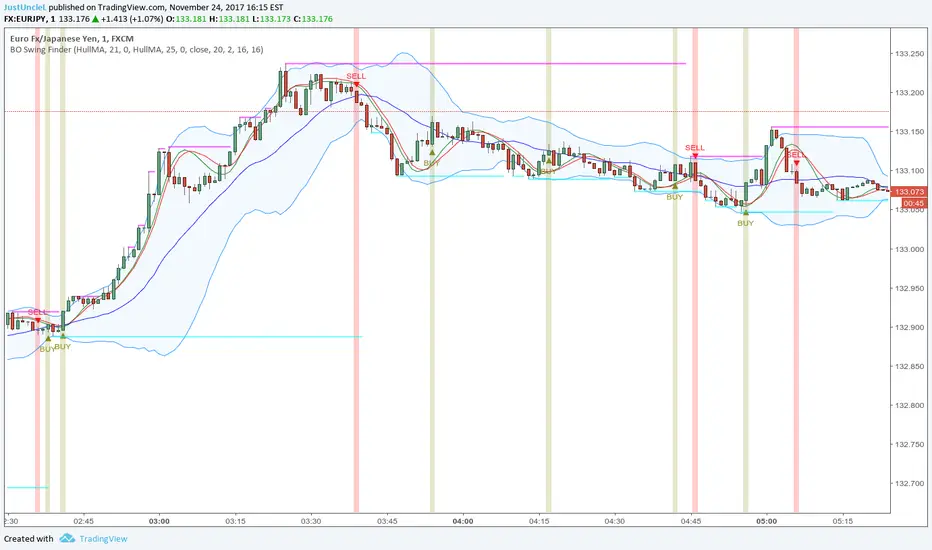
BO Swing Finder R0.6 by JustUncleLThis indicator alert study attempts to detect confirmed Swing points. It uses Bollinger Band centre line crosses as the main signal. The main detection occurs by looking for the first BB centre line cross that was initiated from outside the Bollinger Channel (alternatively KC channel can be used).
The optional HullMA (any any other MA pair) are used to confirm the swing direction. The indicator also plots the two KitKat Support and Resistance lines with optional High/Low labelling on KitKat1 lines.
This indicator tool is suitable for any time frame and can be traded with Binary Option (even 1min) orders (2-3 candle expiry) or as Forex trade orders. It is suitable for Currencies, Cryptocurrencies and Metals. May also be useful on other markets as well.
The MA filtering options, each MA line can be a different type, with an optional offset:
SMA = Simple Moving Average.
EMA = Exponential Moving Average.
WMA = Weighted Moving Average
VWMA = Volume Weighted Moving Average
SMMA = Smoothed Simple Moving Average.
DEMA = Double Exponential Moving Average
TEMA = Triple Exponential Moving Average.
HullMA = Hull Moving Average, fast moving MA.
SSMA = Ehlers Super Smoother Moving average, similar results to HullMA.
ZEMA = Near Zero Lag Exponential Moving Average.
TMA = Triangular (smoothed) Simple Moving Average.
NOTE: The signal calculations do occur on the current candle, so the state of the signal may re-build until the current candle is closed. I have designed the script to behave this way on purpose. This gives traders the option of
preparing their trade early or even taking the trade early if they want. Otherwise the trader can be more conservative and wait for signal candle to close, to give them a confirmed signal. (This is NOT re-painting as the historical signal states are fixed and will not change, unless you change some setup options.)
Hints:
1) As with all indicator and alerting tools, not all signals will yield a tradable successful swing. You need to apply you own analysis on each signal to determine the probability of success.
2) When using the MA to filter the signals you should use it for two types of filtering:
Supportive that confirm swing like fast moving MAs with fairly short lengths, eg HullMA(21,25).
Long Term Direction with smoother longer length MAs like SMMA(180,220) to show up swings back into direction of the longer term trends.
Inspiration: @Lyiness
References:
Momentum VMA KITKAT CROSS v2.1 by vdubus (- Vdubus_Channel www.vdubus.co.uk)
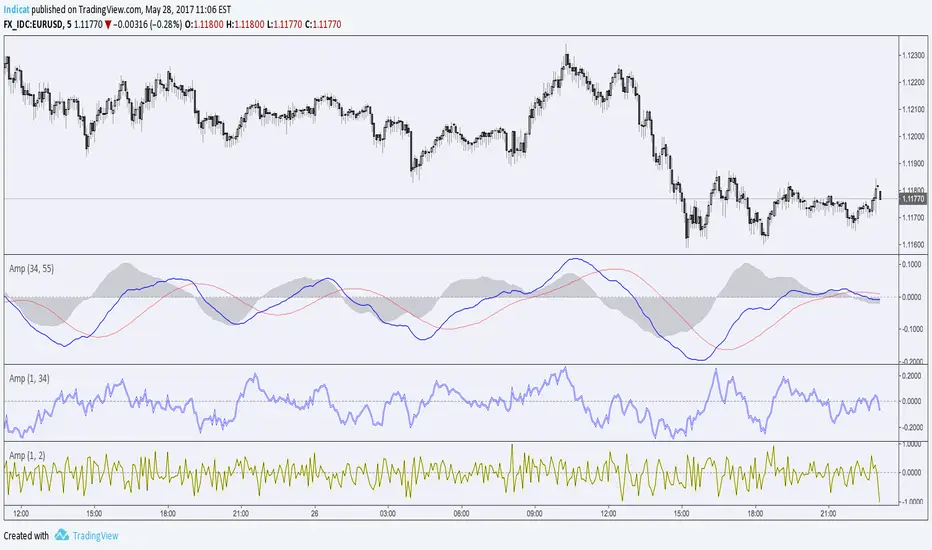
Amplitude IndicatorHello Traders,
Amplitude is the measurement of the difference between the variable's extreme values.
This indicator is based on the Balance of Power (close-open)/(high-low).
Instead of taking the value of a single candlestick, exponential moving averages are used in the formula.
On it's lowest settings (1,2) it's exactly the same as the Balance of power, by adjusting the smoothing you can seen the highs and lows in momentum of the chosen period. (highly adjustable RSI)
By adding a simple moving average (Signal Line) it turns into a cross-over type, like MACD with a histogram.
This indicator is doesn't have a default or 'best' setting, instead I use the Fibonacci numbers as input. (1,2,3,5,8,13,21,34,55,89,144).
Depending on its settings this indicator is well suited for binary options, trend and reversal trading.
Cheers, Indicat...
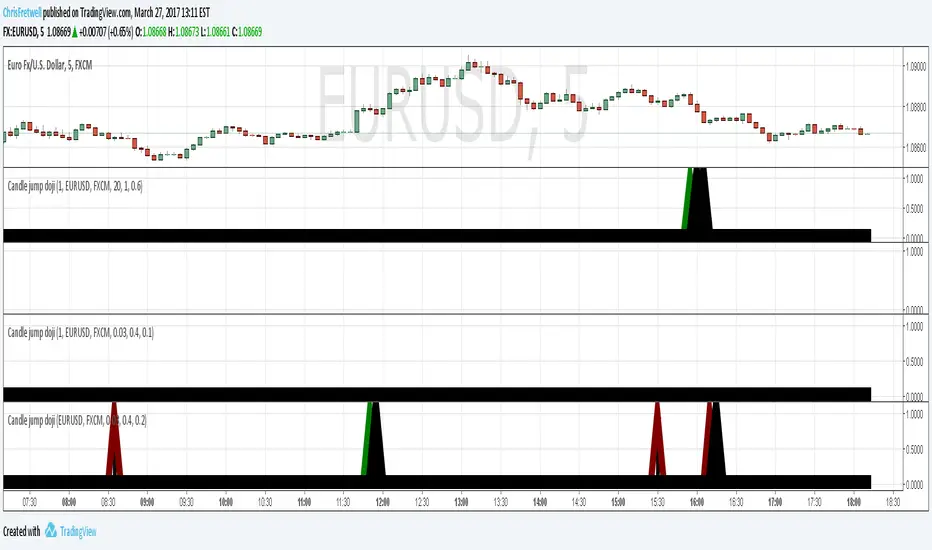
Candle pattern doji-harami just something I wipped together. Unused code still in script and left there for you to experiment with. simple classic doji candle pattern recognition code. Binary option use recommended. red arrow suggest down trade and green for up trade. if market direction fails then a black arrow pops up on next candle. this is to help quickly judge the accuracy while experimenting with input numbers.
Fast/Slow RSIYo Traders,
This indicator is inspired by the RSI-2 strategy in combination with a somewhat smoothed RSI-14.
It has a zero-line, allowing it to use columns or an area as a histogram.
A nice tool to find that perfect entry/exit point, also very useful for Binary Options.
Cheers, Indicat


Simple_Buy_Sell_Signal PipizerThis is a simple buy and sell pattern based on my customized candlestick pattern and trend following. This indicator can also be used for binary option trading except the selling signal candle is not touching the lower band and the buying candle is not touching the upper band.

Traders Dynamic Index Indicator Alert v0.1 by JustUncleLThis is a trend trading indicator+alert utilising the Traders Dynamic Index (TDI), Price Action Channel (PAC) and Heikin Ashi candles.
About 6months ago I came across the use of TDI in "E.A.S.Y. Method" that I found in forexfactory forums: www.forexfactory.com
and I was able to set up a chart based on the specifications by using Kurbelklaus scripts. However, I found that the alerts were being generated one or two bars too late, so at that time I was not successful using it with Binary Options. A few months later I found a variation of the method in the forecfactory forums which is able to generate the alerts a bit earlier, so this indicator is a modification of that early detection version.
The indicator can optionally use Heikin Ashi candles only for all it's calculation. I would recommend viewing the chart with Heikin Ashi candles, these smooth out the trends and makes trends very clear.
I found that this method it works good with most currency pairs or commodities and with 5min+ timeframe charts. I would suggest expiry of 2 to 6 candles.
ALERT GENERATION:
=================
The TDI (Traders Dynamic Index)
---------------------------------------------
Volatility Band VB(34), color: Blue, buffer: UpZone, DnZone
Relative Strength Index RSI(13)
RSI PRICE LINE (2), color: Green, buffer: mab
RSI TRADE SIGNAL LINE (7), color: Red, buffer: mbb
MARKET BASE LINE MID VB(34), color: Orange, buffer: mid
Indicator SignalLevels:
-------------------------------
RSI_OversoldLevel : 22 (normally: 32)
RSI_OverboughtLevel : 78 (normally: 68)
Alert Conditions:
-----------------------
Strong Buy : yellow
Medium Buy : aqua
Weak Buy : blue
Strong Sell : fuchsia
Medium Sell : purple
Weak Sell : black
Hints on How to use:
----------------------------
- When a Medium or Strong alert is generated and MACD histogram colour matches the direction
of the alert (optional auto filter), then place trade in direction of alert candle and MACD.
- I use the multi-Hull MA's for overall trend direction confirmation.
- Best positions normally occur near the MACD(5,15,1) Histogram crossing the zero line.
- The optional coloured Dots along the bottom of the indicator represent the first alert
of this type that was generated in this sequence.
- It is advisable to trade in the direction of the main trend as indicated the HULL MA red cloud:
if red cloud underneath PAC then BULLISH trend, if red cloud above PAC then BEARISH trend.
- Selecting the HeiKin Ashi candles does affect the MACD and MA caculations, so if you select
normal candles the result chart will change. You can still Optionally select to use Heikin Ashi
for calculations.
- When using the Heikin Ashi candles, a good buy entry is indicated by long top wick and no bottom wick
for bull (green) candles and good sell entry is indicated by long bottom wick and no top wick for
bear (red) candles.
- When the MACD histogram is flat and close to zero line,
this indicates a ranging market, do NOT trade when this occurs.
- When the PAC channel on the main chart is spread apart widely, this is an indication
of extreme volatility and choppy chart, do NOT try to trade during these periods.
A choppy chart is also indicated by Heikin Ashi candles with long wicks on both sides
of the candles.
- You can specify what strength level Alerts are generated (default 2):
Level (1) means only generate Strong Alerts only.
Level (2) means generate Strong and Medium Alerts.
Level (3) means generate Strong, Medium and Weak Alerts.


[RS]Linear Decay Oscilator V0EXPERIMENTAL: binary oscillator based on linear regression.
the master line has 1/4 of the decay.

Nadex Fx Volume Indicator Vv1By request
Nadex Fx Volume Indicator Vv1
Original source code & Credit goes to: Pip Foundry - Forex Market Volume from IDC
modified & replaced fx pairs to corrospond with Nadex spot/fx instruments // www.nadex.com

Vdub FX SniperVX v1Vdub FX SniperVX v1
Notes on chart
Please note the Trend directional Buy sell signals generated are configure to be super fast on candle opening. The down side to this is signals may switch direction mid stream.
ITM candlesticks signals generated went 6/300 Losses on a 1 min chart.
the blue line indicates reversal zones. Buy / sell targets are at the next projected line Change TF settings to suit
Sniper series


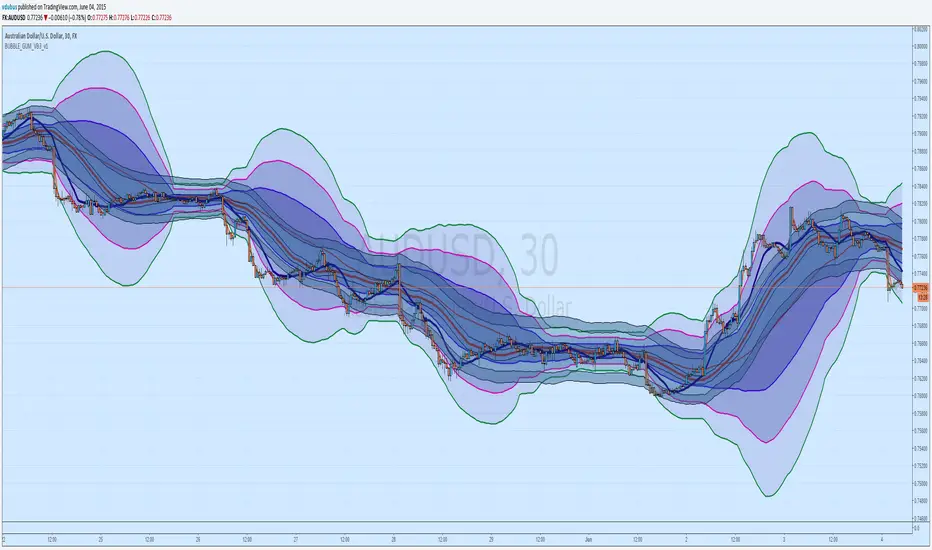
BUBBLE_GUM_VB3_v1BUBBLE_GUM_VB3_v1
Designed for short term trading / experimental
Combination of 3 x Bollinger bands
& Binary Pro 3.
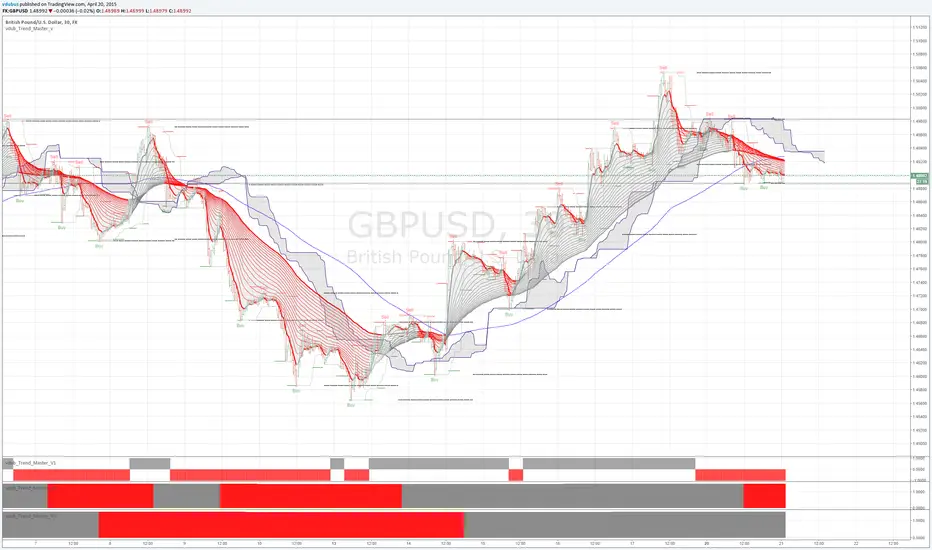
vdub_Trend_Master_v / v1 / v2 / v3NEW
*****Trend Master IV ***** UPDATE HERE
VDUB-TRENDMASTER-WALL UPDATE HERE
User configuration drive.google.com
****Original*****
Strategy / vdub_Trend_Master_v / v1 / v2 / v3.
Being foremost a Binary Options Trader, trying to make a move back into forex was/is challenging. I have no problem in finding entry points, but I lacked the ability to hold my positions for longer than the next retracement , as you can imagine this style of trading eats up trading accounts, so I've pulled together a collaboration of code from various indicators in an attempt to keep you (me) in the trend for longer.
the lower Trend power bars Ive designed for easy visual entry, also both short & long exits v1 being the fastest v2 then v3 the longest.. To be use in correlation with the Trend master v (upper) indicator. The strategy I think speaks for it's self, Buy Long & sell Short . :)
Original edited code from authors listed, with thanks
nb. these indicators are still in demo / testing mode & still needs a few tweaks To get all 4 indicators go to the share icon and select 'Make it mine'
test entry Long
Hold Trends for longer -Trend master v3 (Lower power bar ) / 6hr chart
vdubong updatedMost the credit for this update has to go to RicardoSantos and his awesome RSIChannel + some fixes to my own which I embedded to my my own script.. I've also embedded the additional Bollinger band 50/2. What can I say it's becoming a thing of beauty :).
RicardoSantos's RSIChannel indicator is also included separately (hidden) should you chose to 'Make it mine'
Made a couple of changes to the script pastebin.com
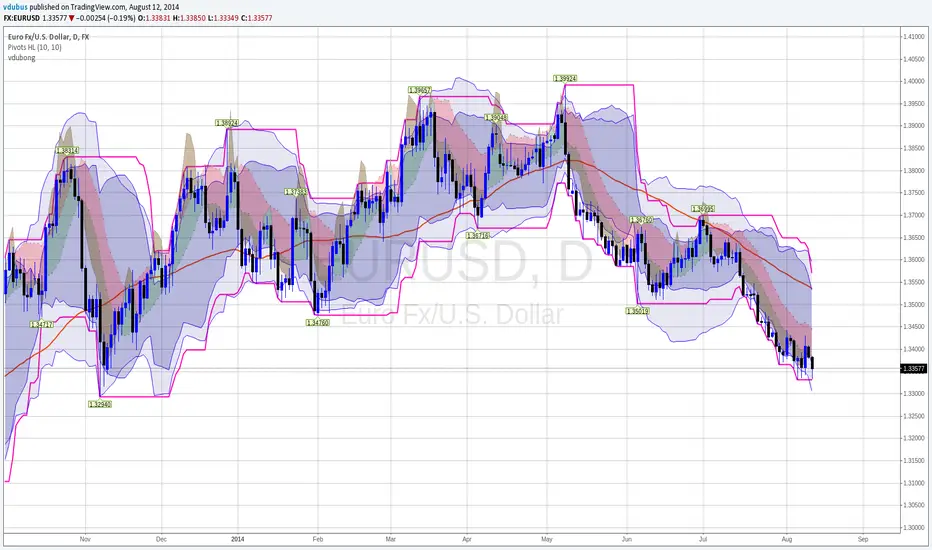
vdubongCustom script I fabricated which I use for Binary Trading on the 1m & 3m charts together with Price action & Time management but the principles are the same for all mediums. Use Price action buy/sell in the clear zones. Use the outer 'pink' horizontal lines (highs / lows / pivots points) to place SL's.
I personally run an additional BB 50/2 for clearer BB higher highs & lower low perspective, but it's not part of the script. Script variables are fully customisable.
I don't take ownership of any part of the script, I not a programmer /script writer just a dabbler. Enjoy :) - VDUBONG UPDATED
