BO ADX Binary Option strategy based on ADX/DI cross, Put or Call at the beginning of the next candle, expire 5m for 5m candle.
Cerca negli script per "binary"

Binary Strategy (with SMI logic)🧠 How to Use:
Chart Timeframe: 5-minute
Setup: Wait for an arrow to appear
Green arrow = BUY a 20-min binary in uptrend with positive momentum
Red arrow = SELL a 20-min binary in downtrend with negative momentum
SMI Logic: Entry only when SMI crosses its signal line in the trend direction and above/below zero
Works for Nadex 20-Minute $&P 500 Binary
If long at 75 get out at 50, or if short at 25 get out at 50. This allow you to be trading at a 1:1 ratio. (Approx.)

Binary Options Time/Price Entry HelperFor those who like to trade the Nadex 5 minute binary options.
✅ Features:
Marks the start of every 5-minute candle (HH:00, HH:05, HH:10, etc.)
Highlights price action signals:
Bullish Engulfing
Bearish Engulfing
Long rejection wicks (potential reversals)
Designed for 1-minute charts
Ideal for manual binary entries
Look for:
🔽 Gray markers: start of a 5-min cycle
🟩 CALL or 🟥 PUT: bullish or bearish engulfing
🟢 or 🟠 circles: strong rejection wicks
You can take off the 5 minute chart cycle markers and the rejection wick markers for a clean looking chart.
Jump in the trade when the call/put arrows appear. These can be fast moving trades. Be prepared to exit if need be. Nadex lets you exit at any time.
Example: if you enter a call around $75 you can get out at $50 if the trade goes against you. If you enter a put around $25 and the trade goes against you, exit at $50, or as close as possible. If you do this it will keep your rr close to 1:1 - this is VERY important for these trades.
I'm not responsible for how you do on these trades. I've only used it for EURUSD, but it works well. Test it on all the 5 minute binaries if you want and see what you think.
Don't wear yourself out on these. Nadex has 5 minute binaries continuously. Work at it for a couple hours and get good. You can collect the $25 premium several times a day. Just get out if it moves against you.

Binary Options Pro Helper By Himanshu AgnihotryThe Binary Options Pro Helper is a custom indicator designed specifically for one-minute binary options trading. This tool combines technical analysis methods like moving averages, RSI, Bollinger Bands, and pattern recognition to provide precise Buy and Sell signals. It also includes a time-based filter to ensure trades are executed only during optimal market conditions.
Features:
Moving Averages (EMA):
Uses short-term (7-period) and long-term (21-period) EMA crossovers for trend detection.
RSI-Based Signals:
Identifies overbought/oversold conditions for entry points.
Bollinger Bands:
Highlights market volatility and potential reversal zones.
Chart Pattern Recognition:
Detects double tops (sell signals) and double bottoms (buy signals).
Time-Based Filter:
Trades only within specified hours (e.g., 9:30 AM to 11:30 AM) to avoid unnecessary noise.
Visual Signals:
Plots buy and sell markers directly on the chart for ease of use.
How to Use:
Setup:
Add this script to your TradingView chart and select a 1-minute timeframe.
Signal Interpretation:
Buy Signal: Triggered when EMA crossover occurs, RSI is oversold (<30), and a double bottom pattern is detected.
Sell Signal: Triggered when EMA crossover occurs, RSI is overbought (>70), and a double top pattern is detected.
Timing:
Ensure trades are executed only during the specified time window for better accuracy.
Best Practices:
Use this indicator alongside fundamental analysis or market sentiment.
Test it thoroughly with historical data (backtesting) and in a demo account before live trading.
Adjust parameters (e.g., EMA periods, RSI thresholds) based on your trading style.

Binary Signals - MnetfGives binary options signals on NASDAQ.
Signals long or short positions on the current candle in the NAS100 index.
Is mostly perfect for long entry signals

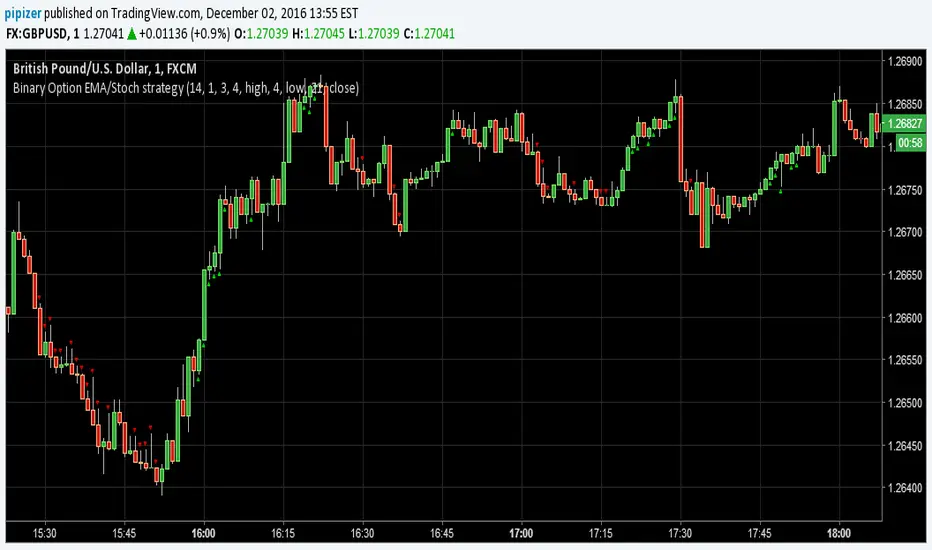
Binary Option EMA/Stoch strategyThis is new Binary Option strategy more signals are generated 60% to 65% win ratio
Binary option trading by two previous barsThis simple script uses the idea of inertia of the market. if 2 previous candles have the same color, current meant to have that too. Following this signal is equal to buying a binary option on the start of the bar (week here). Signals are shown as arrows on the series. The color of the bar shows the outcome of the current option: yellow is success, black is failure. The same outcomes are at the bottom of the chart. The blue line is the total revenue of all options so far. Can be used as template for strategy simulation.

VDUB_BINARY_PRO_3NEW UPDATED BINARY PRO 3_V2 HERE -
VDUB_BINARY_PRO_3_V1 UPGRADE from binary PRO 1 / testing/ / experimental / Trade the curves / Highs -Lows / Band cross over/ Testing using heikin ashi
//Linear Regression Curve
//Centre band
//CM_Gann Swing HighLow V2/Modified////// MA input NOT WORKING ! - I broke it :s
//Vdub_Tetris_V2/ Modified
*Update Tip /Optional
Set the centre band to '34 to run centre line

Smart Money Setup 08 [TradingFinder] Binary Options Gold Scalper🔵 Introduction
In the Smart Money methodology, the market is understood as a structure driven by liquidity flow. This structure forms through the movement of large orders, the accumulation of liquidity, and the reactions that occur around key price zones. The logic of Smart Money is based on the idea that price movement is not random and usually evolves with the intention of collecting liquidity and creating price inefficiencies known as imbalances.
Within this framework, several important stages including the liquidity sweep, the formation of a point of interest, the appearance of an imbalance and the transition of market structure play major roles and collectively define the broader direction of price.
In many bullish scenarios, the market begins by sweeping sell side liquidity and targeting important lows in order to collect the liquidity resting below them. This liquidity collection often becomes the starting point for creating a point of interest which usually marks the area where Smart Money begins to enter the market.
After price moves away from this point, it breaks a structural high and forms a change of character. This shift marks a transition in the balance of power between buyers and sellers and is considered the first clear signal that the market structure is changing.
After the change of character, new institutional order flow often creates a strong and rapid movement that leaves behind an imbalance. This imbalance is one of the most important elements in Smart Money analysis because price tends to return to this area in order to complete structure and restore balance.
The return into the imbalance becomes meaningful when it occurs together with the liquidity sweep, the presence of a validated point of interest and a confirmed structural transition. These conditions frequently mark the beginning of powerful movements within the Smart Money cycle.
Understanding the sequence of liquidity, point of interest, imbalance, change of character and market structure builds the foundation of Smart Money analysis and provides a clear view of the true direction of institutional strength.
Bullish Setup :
Bearish Setup :
🔵 How to Use
To use this framework effectively, the trader must analyze the market through the principles of Smart Money and observe how liquidity drives price. A trade becomes valid only when several essential components appear together in a clear and consistent order.
These components include the liquidity sweep, the formation of a point of interest, the confirmation of a change of character, the transition of market structure and the return of price into an imbalance. The method is built on the understanding that the market first collects liquidity, then shifts order flow and finally provides an entry opportunity inside an inefficient area or inside a point of interest.
For this reason, the trader must follow the path of liquidity from the moment the sweep occurs, through the point of interest and the change of character and finally into the return of price toward the imbalance. When applied correctly, this approach creates entries that are more precise, more structural and more aligned with the real behavior of the market rather than with superficial signals.
🟣 Long Position
A bullish setup in Smart Money structure begins with a liquidity sweep on the sell side. The market first targets the areas where sell side liquidity is located and collects the stops and resting liquidity under previous lows. This collection is the condition that Smart Money requires to begin creating a new order flow. After this liquidity has been taken, a point of interest forms which is usually the last bearish candle or the effective demand zone that initiated the upward movement.
Price then moves away from the point of interest and breaks a structural high which creates a change of character. This event confirms that the market structure has moved from a bearish state to a bullish one and that buying pressure has taken control of the order flow. Following this shift, a strong upward movement often occurs and creates an imbalance between candles. This imbalance reflects the entrance of strong Smart Money orders and is seen as an important confirmation of bullish strength.
When price returns to this imbalance after the displacement, the market enters a phase where Smart Money aims to complete the corrective movement and continue the upward direction. The reaction inside the imbalance when combined with the liquidity sweep, the confirmed point of interest and the change of character completes the bullish setup and forms a structure that often leads to a continuation of the bullish trend.
🟣 Short Position
A bearish setup follows the same Smart Money logic but in the opposite direction. The market begins by collecting buy side liquidity and targets the highs where buy side liquidity and resting stops are located. This liquidity sweep on the buy side becomes the starting phase for Smart Money to initiate a downward order flow. After the liquidity is collected, a bearish point of interest forms which is usually the last bullish candle or the supply zone that created the initial drop.
Price then moves away from this point and breaks the first structural low. This creates a change of character to the downside which confirms that the market structure has transitioned from bullish to bearish and that selling pressure has gained control. After this shift, a strong downward displacement appears and leaves behind a bearish imbalance that clearly shows the dominance of sellers.
As price returns to this imbalance and corrects the inefficient movement, the bearish setup becomes complete as long as the market structure remains bearish. The combination of the buy side liquidity sweep, the bearish point of interest, the change of character, the imbalance and the corrective return creates the ideal structure that Smart Money uses to continue the downward movement and develop a reliable selling opportunity.
🔵 Settings
🟣 Logic Settings
Pivot Period : Defines how many bars are analyzed to identify swing highs and lows. Higher values detect larger, slower structures, while lower values respond to faster patterns. The default value of 5 offers a balanced sensitivity.
🟣 Alert Settings
Alert : Enables alerts for SMS08.
Message Frequency : Determines the frequency of alerts. Options include 'All' (every function call), 'Once Per Bar' (first call within the bar), and 'Once Per Bar Close' (final script execution of the real-time bar). Default is 'Once per Bar'.
Show Alert Time by Time Zone : Configures the time zone for alert messages. Default is 'UTC'.
🔵 Conclusion
The Smart Money approach demonstrates that price movement is not random or based on surface level patterns. Instead, it develops through a clear cycle of liquidity collection, structural transition and corrective movement toward key price zones. By recognizing events such as the liquidity sweep, the formation of the point of interest, the change of character and the return into the imbalance, the trader gains the ability to understand order flow more accurately and identify the true direction of market structure.
Both bullish and bearish setups show that the alignment of these elements creates a transparent view of institutional behavior and reveals the source of strong movements in the market. When the trader correctly identifies this sequence, entry points become more reliable and more aligned with liquidity flow. The combination of liquidity, structure and imbalance provides a consistent framework that removes guesswork and guides decisions through the real logic of the market.

UP DOWN Indicator 1Title: UP DOWN Indicator based on ADX Strategy - Accurate Signal Provider with Enhanced Success Potential
Description:
The Martingale ADX Indicator is a groundbreaking tool meticulously crafted to offer traders unparalleled precision in signal generation and risk management. Leveraging the power of the Average Directional Index (ADX), this indicator provides 100% non-repaint signals on the current candle, guiding traders to opportune and prepare for trade entry with remarkable accuracy.
With a focus on empowering traders across various financial markets, including Forex and Binary Options, this ADX Strategy-1 Indicator introduces a unique approach to trading dynamics. By seamlessly integrating the renowned Martingale Step-1 risk management strategy, this indicator not only minimizes losses but also enhances the potential for success, even in volatile market conditions.
Key Features:
Non-Repaint Signals: The Martingale ADX Indicator stands as a testament to reliability, offering 100% non-repaint signals. Traders can trust in the consistency and not removing losing Signals which is very important to trust the previous generated signals also, eliminating uncertainties and facilitating confident decision-making.
ADX-Based Precision: Built upon the robust framework of the Average Directional Index (ADX), this indicator delivers precise signals tailored to prevailing market trends and volatility levels. Whether trading in longer timeframes or engaging in Binary Options, traders can rely on the Martingale Step-1 ADX Indicator for superior insights.
Next Candle Trading: Seamlessly integrated into trading strategies, signals from the Martingale ADX Indicator prompt action on the subsequent candle. This real-time approach ensures traders stay ahead of market movements, seizing opportunities as they emerge. Giving Signals Once Candle ahead makes traders to prepare early and decide whether they want to enter the trade on presented Signal or not as per their own experience too. If the trading candle is loss then the very next candle shall be used for taking Martingale Sep-1 to enhance the Accuracy.
Enhanced Success Potential: With Martingale Step-1 risk management, this ADX Indicator offers more than just signal accuracy – it presents the potential for heightened success rates. Through strategic position sizing and leveraging experience and Price Action insights, traders can elevate overall accuracy to levels ranging from 80% to 90%.
Conclusion:
The UP DOWN Strategy-1 Indicator represents a paradigm shift in trading technology, combining precision signal generation with advanced risk management strategies. Whether you're a seasoned trader or just starting your journey, this indicator empowers you to navigate financial markets with confidence and achieve consistent results.
Experience the difference with the Martingale ADX Indicator – where reliability meets profitability, and success becomes attainable with every trade.
Trade wisely, and may your ventures be marked by prosperity and fulfillment.
Pardon for any descriptive language grammatical error and comment about this indicator and to get my other strategy as well. Happy trading !!
Risk Disclaimer:
Trading in financial markets carries inherent risks and should be approached with caution. It is imperative to exercise sound judgment and trade only with funds that you can afford to lose. We strongly advise against using borrowed funds for trading purposes. First practice on demo for own learning then make decision wisely.

Two Bar Break Line Alerts R1.0 by JustUncleLThis indicator with default settings is designed for BINARY OPTIONS trading. The indicator can also be used for Forex trading with some setting changes. The script shows Two Bar Pullback Break lines and alerts when those Break lines are Touched (broken) creating a short term momentum entry condition.
For a Bullish Break (Green Up Arrow) to occur: first must have two (or three) consecutive bear (red) candles which is followed by a bull (green) candle creating a pivot point. The breakout occurs then the High of the current Bull (green) exceeds the highest point of the previous two (or three) pivotal bear candles. The green channel Line shows where the current Bullish BreakOut occurs.
For a Bearish Break (Red Down Arrow) to occur: first must have two (or three) consecutive bull (green) candles which is followed by a bear (red) candle creating a pivot point. The breakout occurs when the Low of the current Bear (red) drops below the lowest point of the previous two (or three) pivotal Bull candles. The red channel Line shows where the current Bearish BreakOut occurs.
The break Line Arrows can optionally be filtered by the Coloured MA (enabled by default), a longer term directional MA (disabled by default) and/or a MACD condition (enabled by default) as a momentum filter.
You can optionally select three Bar break lines instead of two. The three bar break lines are actually equivalent to Guppy's Three Bar Count Back Line method for trade entries (see Guppy's video reference below).
Included in this indicator is an ability to display some basic Binary Option statistics, when enabled (enabled by default) it shows Successful Bars in Yellow and failed Bars in Black and the last Nine numbers on the script title line represent the Binary option Statistics in order:
%ITM rate
Total orders
Successful Orders
Failed Orders
Total candles tested
Candles per Day
Trades per Day
Max Consecutive Wins
Max Consecutive Losses
You can start the Binary Option statistics from a specific Date, which is handy for checking more recent history.
HINTS:
BINARY OPTIONS trading: use 5min, 15m, 1hr or even Daily charts. Trade after the price touches one of the Breakout lines and the Arrow first appears. Wait for the price to come back from Break Line by 1 or 2 pips, the alert arrow must stay on and candle change to black, then take Binary trade expiry End of Candle. If price pull back and arrow turns off, don't trade this candle, move on you probably don't have momentum, there will be plenty of other trigger events. The backtesting results are good with ITM rates 65% to 72% on many currency pairs, commodities and indices. Realtime trading has confirmed the backtesting results and they could even be bettered, provided you are selective on which signals to trade (strong MACD support etc), that you are patient and disciplined to this trading method.
FOREX trading: the default settings should work with scalping. For longer term trades try with settings change to a more standard MACD filter or slower to catch the longer term momentum swings and the idea would be to trade the first Break Line alert that occurs after a decent Pullback in the direction of the trend. Setting the SL to just above/below the Pivot High/Low and set target to two or three times SL.
References:
"Fundamentals of Price Action Trading for Forex, Stocks, Options and Futures" video:
www.youtube.com
Other videos by "basecamptrading" on Naked Trading.
"Taking Profits in Today's Market by Daryl Guppy" video:
www.youtube.com

Bernoulli Process - Binary Entropy FunctionThis indicator is the Bernoulli Process or Wikipedia - Binary Entropy Function . Within Information Theory, Entropy is the measure of available information, here we use a binary variable 0 or 1 (P) and (1-P) (Bernoulli Function/Distribution), and combined with the Shannon Entropy measurement. As you can see below, it produces some wonderful charts and signals, using price, volume, or both summed together. The chart below shows you a couple of options and some critical details on the indicator. The best part about this is the simplicity, all of this information in a couple of lines of code.
Using the indicator:
The longer the Entropy measurement the more information you are capturing, so the analogy is, the shorter the signal, the less information you have available to utilize. You'll run into your Nyquist frequencies below a length of 5. I've found values between 9 and 22 work well to gather enough measurements. You also have an averaging summation that measures the weight or importance of the information over the summation period. This is also used for highlighting when you have an information signal above the 5% level (2 sigma) and then can be adjusted using the Percent Rank Variable. Finally, you can plot the individual signals (Price or Volume) to get another set of measurements to utilize. As can be seen in the chart below, the volume moves before price (but hopefully you already knew that)
At its core, this is taking the Binary Entropy measurement (using a Bernoulli distribution) for price and volume. I've subtracted the volume from the price so that you can use it like a MACD, also for shorter time frames (7, 9, 11) you can get divergences on the histogram. These divergences are primarily due to the weekly nature of the markets (5 days, 10 days is two weeks,...so 9 is measuring the last day of the past two weeks...so 11 is measuring the current day and the past two weeks).
Here are a couple of other examples, assuming you just love BTC, Stocks, or FOREX. I fashioned up a strategy to show the potential of the indicator.
BTC-Strategy
Stock-Strategy (#loveyouNFLX)
FOREX - (for everyone hopped up on 40X leverage)

Ivan Gomes StrategyIG Signals+ - Ivan Gomes Strategy
This script is designed for scalping and binary options trading, generating buy and sell signals at the beginning of each candle. Although it is mainly optimized for short-term operations, it can also be used for medium and long-term strategies with appropriate adjustments.
How It Works
• The indicator provides buy or sell signals at the start of the candle, based on a statistical probability of candle patterns, depending on the timeframe.
• It is essential to enter the trade immediately after the signal appears and exit at the end of the same candle.
• If the first operation results in a loss (Loss), the script will send another trade signal at the start of the next candle. However, if the first trade results in a win (Gain), no new signal will be generated.
• The signals follow cycles of 3 candles, regardless of the timeframe. However, if a Doji candle appears, the cycle is interrupted, and no signals will be generated until the next valid cycle starts.
• The strategy consists of up to two trades per cycle: if the first trade is not successful, the second trade serves as an additional attempt to recover.
Key Points to Consider
1. Avoid trading in sideways markets – If price levels do not fluctuate significantly, the accuracy of the signals may decrease.
2. Trade in the direction of the trend – Using Ichimoku clouds or other trend indicators can help confirm trend direction and improve signal reliability. If the market is in an uptrend (bullish trend) and the indicator generates a sell signal, the most prudent decision would be to wait for a buy signal that aligns with the main trend. The same applies to downtrends, where buy signals may be riskier.
These decisions should be based on chart reading and supported by other technical analysis tools, such as support and resistance levels, which indicate zones where price might face obstacles or reverse direction. Additionally, Fibonacci retracement levels can help identify possible pullback points within a trend. Moving averages are also useful for visualizing the general market direction and confirming whether an indicator signal aligns with the overall price structure. Combining these tools can increase trade accuracy and prevent unnecessary trades against the main trend, reducing risks.
3. Works based on probability statistics – The algorithm analyzes candle formations and their statistical probabilities depending on the timeframe to optimize trade entries.
4. Best suited for scalping and binary options – This strategy performs best in 1-minute and 5-minute timeframes, allowing for multiple trades throughout the day.
Technical Details
• The script detects the candle cycle and assigns an index to each candle to identify patterns and possible reversals.
• It recognizes reference candles, stores their colors, and compares them with subsequent candles to determine if a signal should be triggered.
• Doji candle rules are implemented to avoid false signals in indecisive market conditions. When a Doji appears, the script does not generate signals for that cycle.
• The indicator displays visual alerts and notifications, ensuring fast execution of trades.
Disclaimer
The IG Signals+ indicator was created to assist traders who struggle to analyze the market by providing objective trade signals. However, no strategy is foolproof, and this script does not guarantee profits.
Trading involves significant financial risk, and users should test it in a demo account before trading with real money. Proper risk management is crucial for long-term success.

vdubsoxI've been asking for this concept for a while, a simple MA that rides the top side of the trend instead of the bottom, and by accident came across the 'Hull ma' on a TV blog post. I've added another two simple Moving averages to act as strength indicator with close proximity to the price.
The strategy is simple MA cross over but with the early indication using Hull ma gives you a heads up on trend / price reversal.
I'm using this in conjunction with BB set at 34. on a 1/3/5 min charts & Heiken Ashi to smooth out the noise with awesome success trading Binary options.
BO - CCI Arrow with AlertBO - CCI Arrow with Alert base on CCI indicator to get signal for trade Binary Option.
Rules of BO - CCI Arrow with Alert below:
A. Setup Menu
1. cciLength:
* Default CCI lenght = 14
2. Linear Regression Length:
* Periods to calculate Linear Regression of CCI,
* Default value = 5
3. Extreme Level:
* Default top extreme level = 100
* Default bottom extreme level = -100
4. Filter Length:
* Periods to define highest or lowest Linear Regression
* Default value = 6
B. Rule Of Alert Bar
1. Put Alert Bar
* Current Linear Regression Line created temporrary peak
* Peak of Linear Regression Line greater than Top Extreme Level (100)
* Previous Linear Regression is highest of Filter Length (6)
* Previous Linear Regression is greater than previous peak of Linear Regression Line
* Current price greater than previous low
* CCI(14) less than Linear Regression Line
2. Call Alert Bar
* Current Linear Regression Line created temporrary bottom
* Bottom of Linear Regression Line less than Bottom Extreme Level (-100)
* Previous Linear Regression is lowest of Filter Length (6)
* Previous Linear Regression is less than previous bottom of Linear Regression Line
* Current price less than previous lhigh
* CCI(14) greater than Linear Regression Line
B. Rule Of Entry Bar and Epiry.
1. Put Entry with expiry 3 bars:
* After Put Alert Bar close with signal confirmed, put Arrow appear, and after 3 bars, result label will appear to show win trade, loss trade or draw trade
2. Call Entry with expiry 3 bars:
* After Call Alert Bar close with signal confirmed, call Arrow appear, and after 3 bars, result label will appear to show win trade, loss trade or draw trade.
3. While 1 trade is opening no more any signal
C. Popup Alert/Mobile Alert
1. Signal alert: Put Alert or Call Alert will send to mobile or show popup on chart
2. Put Alert: only Put Alert will send to mobile or show popup on chart
3. Call Alert: only Call Alert will send to mobile or show popup on chart

BO - Bar M15 2/3 SignalBO - Bar M15 2/3 Signal show the signal to trade Binary Option with rule below:
A. Indicator
* Bollinger Band (20,2): avoid waterfall
B. Rule of Signal
1. Rule1: Split Bar M15 to 3 part and load them on M5 chart (recommend use M5 IDC chart)
2. Rule 2: Delay 10' after bar M15 open => wait for price's pattern
3. Rule 3: Put Signal row 30-32
* Delay 10' after bar M15 open.
* Direction of 1/3 and 2/3 Bar M15 is upward
* close of 2/3 Bar M15 below upper band Bb(20,2) on M5 chart => avoid strong buy
4. Rule 4: Call Signal row 36-38
* Delay 10' after bar M15 open.
* Direction of 1/3 and 2/3 Bar M15 is downward
* close of 2/3 Bar M15 above lower band Bb(20,2) on M5 chart => avoid strong sell
C. Recommend Expiry time: Bar M15 close
* We try to catch the shadow of Bar M15 but dont trade when price run on the upper or lower band of BB(20,2,M5)

BO - Bar M15 Signal* This script show the signal base on volatility of previous bar M15 to trade Binary Option.
* Rule of Signal is below:
A. Rule 1: Wait for prices created temporary peak and bottom
Row 18: 10 minutes till close
B. Rule 2: Reversal previous bar's direction
1. Put Signal - Row 22 - 25:
- Delay 5' after bar M15 open
- previous bar's direction is upward
- price less than previous close
- temporary bottom greater than previous open
2. Call Signal - Row 29 - 32:
- Delay 5' after bar M15 open
- previous bar's direction is downward
- price greater than previous close
- temporary peak less than previous open
C. Rule 3: Follow previous bar's direction
1. Put Signal - Row 37 - 40:
- Delay 5' after bar M15 open
- previous bar's direction is downward
- price greater than previous open
- temporary peak less than previous peak
2. Call Signal - Row 43 - 46:
- Delay 5' after bar M15 open
- previous bar's direction is upward
- price less than previous open
- temporary bottom greater than previous bottom
QQE Cross Indicator Alert v2.0 by JustUncleLThis version of the indicator makes a distinction between the types of QQE cross alerts on the chart and now only recommends the Thresh Hold channel exit crosses for BUY/SELL alerts, the other two types of crosses are still there to provide pre-warning of pending BUY/SELL alerts. Also only the BUY/SELL alerts are filtered by Moving Average Filter and/or the new Directional filter (default). The default settings in this version have also been changed, particularly the Moving Averages, to indicate trend changes quicker.
Indicator Project Description:
*** This is a trend following indicator alert that uses fast QQE crosses with Moving Averages for trend direction filtering. QQE or Qualitative Quantitative Estimation is based on the relative strength index, but uses a smoothing technique as an additional transformation. Three crosses can be selected (all selected by default):
RSI signal crossing ZERO (XZERO)
RSI signal crossing Fast RSIatr line (XQQE)
RSI signal exiting the RSI Threshhold Channel (BUY/SELL)
The (BUY/SELL) alerts can be optionally filtered by the Moving Average Combo:
For BUY alert the Close must be above the fast MA and
fast MA (EMA8) > medium MA (EMA20) > slow MA (SMA50).
For SELL alert the Close must be below the fast MA and
fast MA (EMA8) < medium MA (EMA20) < slow MA (SMA50).
and/or Directional filter (default filter):
For BUY alert the Close must be above the slow MA (SMA50) and the directional MA (EMA20) must be green.
For SELL alert the Close must be below the slow MA (SMA50) and the directional MA (EMA20) must be red.
The XZERO and XQQE are not included in the filtering, they are used to indicate pending BUY/SELL alerts, particularly the XZERO.
Note: I have found the XQQE cross can also be quite good alert for BUY/SELL as well, particularly in direction of current trend. The XZERO I have found to be totally unreliable for BUY/SELL alerts.
This indicator should work on any currency pair, most chart timeframes and expiry in 3 to 6 candles for binary option trading. For hourly or longer charts expiry can be longer for binary options, or if available use standard forex trading techniques
Some Hints for using this indicator:
Avoid taking trades in non-trending market, this is normally indicated by a near Horizontal SMA50 line.
Avoid trading when all the moving averages are close together.
When trading 1min and 5min charts, expiry should set to 1-3 candles.
Avoid trading when market choppy, this is normally indicated by the fast EMA8 crossing the EMA20 back and forwards quickly.
High probability trades tend to occur when you get a XQQE followed by a XZERO and then BUY/SELL in the same direction of trend.
Don't trade near nor directly on any major market news (sometime better no trade day).
Please practise this system in DEMO first, before committing any real money. Be patient the more you practise the better and more confident you will be.
I hope you enjoy this indicator, it has proven very effective for me.

Big Snapper Alerts R2.0 by JustUncleLThis is a diversified Binary Option or Scalping Alert indicator originally designed for lower Time Frame Trend or Swing trading. Although you will find it a useful tool for higher time frames as well.
The Alerts are generated by the changing direction of the ColouredMA (HullMA by default), you then have the choice of selecting the Directional filtering on these signals or a Bollinger swing reversal filter.
The filters include:
Type 1 - The three MAs (EMAs 21,55,89 by default) in various combinations or by themselves. When only one directional MA selected then direction filter is given by ColouredMA above(up)/below(down) selected MA. If more than one MA selected the direction is given by MAs being in correct order for trend direction.
Type 2 - The SuperTrend direction is used to filter ColouredMA signals.
Type 3 - Bollinger Band Outside In is used to filter ColouredMA for swing reversals.
Type 4 - No directional filtering, all signals from the ColouredMA are shown.
Notes:
Each Type can be combined with another type to form more complex filtration.
Alerts can also be disabled completely if you just want one indicator with one colouredMA and/or 3xMAs and/or Bollinger Bands and/or SuperTrend painted on the chart.
Warning:
Be aware that combining Bollinger OutsideIn swing filter and a directional filter can be counter productive as they are opposites. So careful consideration is needed when combining Bollinger OutsideIn with any of the directional filters.
Hints:
For Binary Options try ColouredMA = HullMA(13) or HullMA(8) with Type 2 or 3 Filter.
When using Trend filters SuperTrend and/or 3xMA Trend, you will find if price reverses and breaks back through the Big Fat Signal line, then this can be a good reversal trade.
Some explanation about the what Hull Moving average and ideas of how the generated in Big Snapper can be used:
tradingsim.com
forextradingstrategies4u.com
Inspiration from @vdubus
Big Snapper's Bollinger OutsideIn Swing filter in Action:

Williams Fractals with Alerts by MrTuanDoanCustom William Fractals for alerts and educational purpose.
Added custom alerts for Williams Fractals.
Also added filter to show less fractals on chart.
The simple idea how I use fractals in Binary Option is to determine temporary resistance and support.
Simple strategy:
- Mark Resistance/Support on higher time frame (e.g. 5M)
- Set an alert for new fractal
- Whenever a new fractal that appears close to your marked Resistance/Support, go to lower time frame (e.g. 1M)
- Wait for rejection at the level that lower than new down fractal (or higher than new up fractal).
- Enter with the same expiry of lower time frame.
Good luck and happy trading. :-)

Noro's BinaryHacker v1.0The indicator isn't redrawn (the last candle can be redrawn because it still changes).
NOT indicator shows a bottom of the market or top of the market!!! The indicator shows what there will be a color of the following candle.
The index up under the current candle means that the following candle will be growing (there will be a green candle). And vice versa. The index down under the current candle means that the following candle will be falling (there will be a red candle). The indicator shows only on one following candle. It is not the trend indicator!
Well for Forex and binary options.

VDUB BB %B REVERSAL_v4.2 revised by JustUncleLThis is an revised Open Public version of Vdub Bollinger Band %B reversal indicator. This version includes optional Divergence Finder with selectable channel width, optional Market Session time highlighting and optional Binary Option expiry markers.

Candlestick Trend Indicator v0.5 by JustUncleLRequested Update to this Indicator alert project. In this update I have added the option to be able select which Price Action candles you want included in the display and the generated alarm Alert. Other changes also included in this update:
Also added a Price Action candle for "Last Fractal S/R Break", this also a good continuation indication.
Added option to select a different moving average types for directional MA line.
Modified some default settings, using HullMA instead of Zero Lag EMA and standard MACD settings(12,26,9).
Description:
This is a trend following indicator and alert for Binary Options based on Candlestick patterns and trend line -
NOTE: original system was a forex trading system.
This code combines a number of indicators to create an overall trading strategy.
The indicator recognises and displays some useful candle named defined patterns that are used to support trend continuation:
Bearish + Bullish PinBars
Dark Cloud Cover
Piecing Line
Bullish + Bearish Harami
Bullish + Bearish Engulfing Candle
Bullish + Bearish Last Fractal S/R break
Also recognises main Price Action candles from ChrisMoody (CM), the four(4) price action patterns are colored coded bars:
Yellow = Inside Bar - breakout/continuance
Orange = Outside Bar - breakout/continuance
Aqua/Fuschia = Up/Down Shaved Bars - Buying/Selling pressure
Red/Green = Possible reversal PinBars - Reverse Down / reverse Up
The highlighted candles (maroon and darker green) represent the defined PA patterns that have been confirmed following the current trend direction that is indicated by the Hull MA(20) line (can select a different type of MA, or even disable) and confirmed by MACD direction (can be disabled). The confirmed Alerts are indication by green (buy) and red (sell) dots at the bottom of the chart. An alert is generated from this selection for the alert condition of the alarming system.
The fractal upper/lower break lines are also draw, if the (optional) last fractal break line is broken by a highlighted bar then this indicates a stronger trend conformation.
The MACD indicator MACD DEUTER 2 colour(12,26,9) you can visually see the MACD histogram colours with MACD direction - needs "MACD DEUTER 2 colour" indicator.
This multi-indicator set up is suitable for 1hr, 4hr and daily charts with 1-4 candle expiry.
References and Inspiration from:
Fractal Levels by RicardoSantos
Almost Zero Lag EMA
Candlestick Patterns With EMA by rmwaddelljr
CM_Price-Action-Bars by ChrisMoody
www.forexstrategiesresources.com
"Scalp Jockey - MTF MA Cross Visual Strategizer by JayRogers"
