Manual Fib Levels (Paul Laurent Trading)📜 Script Description for TradingView
Manual Fibonacci Levels with Whole Number Lines
This script draws infinite horizontal lines for custom Fibonacci retracement and extension levels, based on manually entered high and low points. It also includes additional lines at full whole number levels (e.g., 1.0000, 2.0000, 3.0000), making it easier to visualize key psychological price zones within the Fibonacci range.
Features:
* Custom manual high/low inputs
* Infinite Fib lines (retracement + extension)
* Separate whole-number lines within the Fib range
* Adjustable line color and thickness for both sets
Useful for traders who prefer visual clarity with precise price alignment across major and whole-number levels.
Cerca negli script per "fib"

Blackflag FTS (1H Trailing) + MSB-OB FibThis indicator combines a 1-hour trailing stop system with multi-timeframe Fibonacci retracement levels and ZigZag structure detection to assist traders in identifying trend direction and potential reversal zones.
Features:
✅ 1-Hour Trailing Stop: Uses an ATR-based trailing stop mechanism to track trend direction and dynamic support/resistance.
✅ Multi-Timeframe Approach: The trailing stop is calculated on the 1-hour timeframe, while the ZigZag and Fibonacci retracement levels are based on the 15-minute chart.
✅ ZigZag Structure Detection: Helps filter market swings and trend reversals dynamically.
✅ Fibonacci Levels (0.5 & 0.786): Key retracement levels to watch for price reactions.
✅ Alerts for Key Levels: Get notified when the price crosses important levels (1H trailing stop, Fib 0.5, Fib 0.786).
How It Works:
The trailing stop adapts dynamically based on ATR values and determines trend direction.
ZigZag detection filters out minor price movements to highlight major swing points.
Fibonacci levels are calculated based on ZigZag swings, helping traders spot potential reversal zones.
This tool is useful for trend-following traders, breakout traders, and Fibonacci-based strategies.
Let me know if you'd like any modifications! 🚀

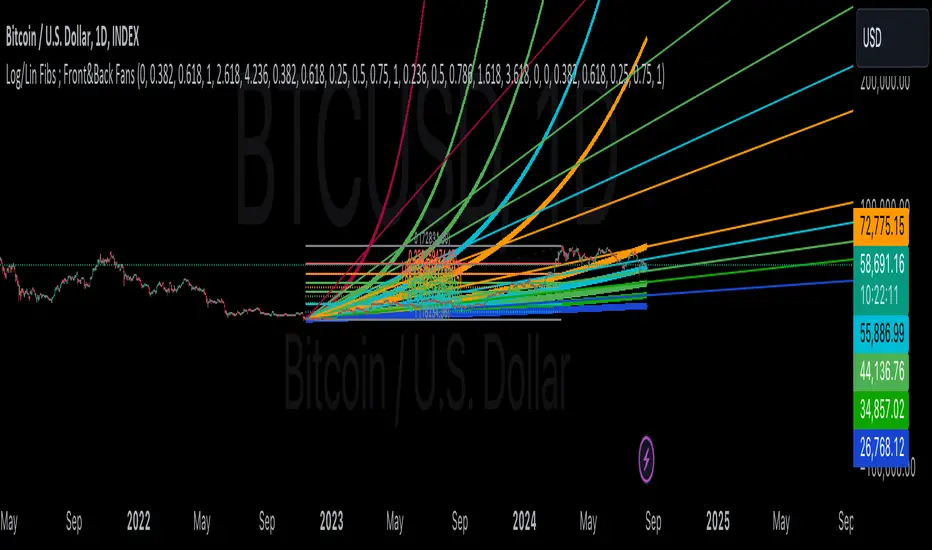
Linear and Logarithmic Fibonacci Levels and (Price&Time) FansIntroduction
The Fibonacci Retracement tool is a go-to for traders looking to spot potential support and resistance levels. By measuring the distance between swing highs and lows, you can apply Fibonacci ratios like 0.236, 0.382, and 0.618 to predict key market levels.
Traditionally, these levels are set by dividing this distance into equal parts—known as Linear Levels. A more refined approach, Logarithmic Price and Time Levels, divides the distance into proportionally equal segments. Plus, this indicator now includes Fibonacci fans, adding another layer of analysis by projecting potential price levels using trendlines based on Fibonacci ratios.
This tool makes it easier to identify both Linear and Logarithmic levels while also leveraging Fibonacci fans for a more complete market view.
Applications
Logarithmic Levels and Fibonacci fans are ideal for volatile markets. In crypto, they’re especially effective for BTCUSDT (check out the wick from January 23, 2024). They also help spot accumulation and distribution patterns in high-volume altcoins like FETUSDT . In traditional markets, they’re useful for tracking stocks like TSLA and NVDA with extreme price swings, as well as indices in inflation-affected markets like XU100 , or recession-hit currency pairs like JPYUSD .
How to Use
This indicator is intuitive and similar to TradingView’s Fibonacci Tool. Select your reference levels (Level 1 and Level 0), then tweak the settings to customize your analysis, including adding Fibonacci fans for extra insights.
Why It’s Different
Unlike TradingView’s tool, which forces you to switch to a logarithmic scale (messing with other indicators and trend lines), this indicator lets you view both Linear and Logarithmic levels—and Fibonacci fans on Price and Time Series—without changing your chart’s scale. The original Fibonacci Code was derived from zekicanozkanli, modified and upgraded to plot fib front and back fans as well. Due to TV Max Plot restrictions I need to publish just Front and Back and Front Fibs separately.
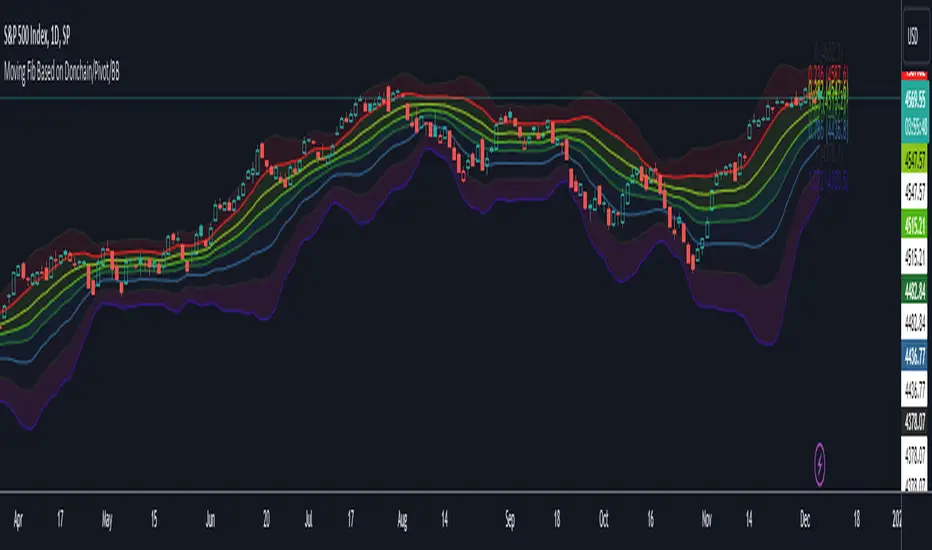
Moving Fib Based on Donchain/Pivot/BBThis script's purpose is to provide the user with an indicator that automatically plots Fibonacci levels. The user has three main options for determining the Fibonacci's high and low. This indicator offers an ample number of settings, making it a modular Fibonacci overlay.
The default setting is based on Donchian high and low.
Another option is to base the high and low on TradingView's Pivot indicator.
The last option is to determine Fibonacci levels based on Bollinger Bands.
Add up to 16 Fib levels with customizable settings, plot them on a log scale, and explore various other settings to personalize the Fib overlay.
This indicator can be utilized for trading momentum or mean reversion strategies
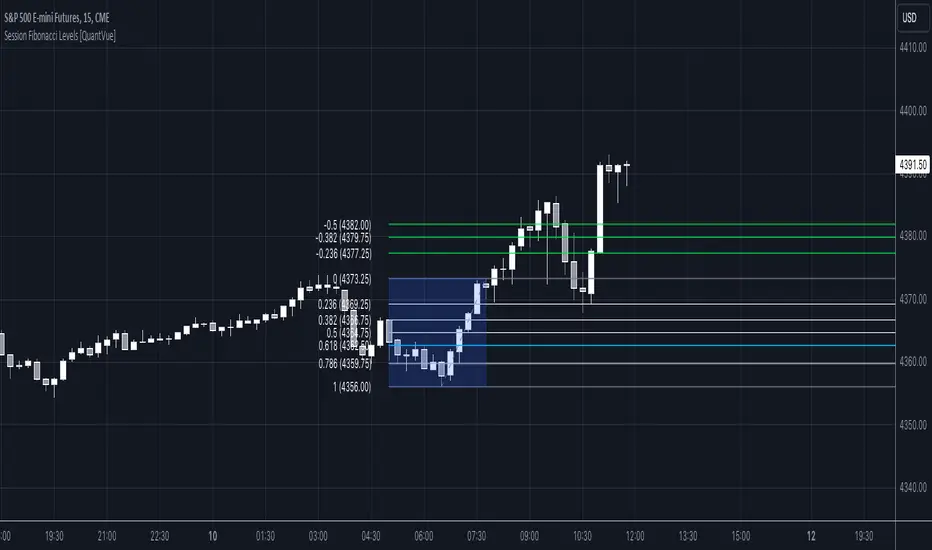
Session Fibonacci Levels [QuantVue]The "Session Fibonacci Levels" indicator is a powerful tool designed for traders who aim to use Fibonacci retracement and extension levels in their trading strategy.
The indicator combines Fibonacci levels with customized trading sessions, allowing traders to observe and utilize Fibonacci levels that are automatically calculated for each defined session.
This approach offers a dynamic and session-relevant perspective on potential support and resistance levels, which can be crucial for intraday trading strategies.
🔹The indicator calculates Fibonacci retracement and extension levels based on the high and low prices of a specified trading session, dynamically adjusting to the location of the high and low bar.
If the low of the session occurs before the high, the fib levels are measured from low to high.
If the low of the session occurs after the high, the fib levels are measured from high to low.
🔹Users can set their time zone and define trading sessions, allowing for flexibility and applicability across global markets. This is particularly beneficial for traders who focus on specific market hours like the London or New York sessions.
Important sessions:
New York (8:00am - 5:00pm EST)
London (3:00am - 12:00pm EST)
Asia (7:00pm - 4:00am EST)
Custom session (user defined session in indicator settings)
🔹The indicator dynamically updates Fibonacci levels as new highs and lows are made within the session, keeping the analysis current. Additionally, it provides alerts when prices hit key Fibonacci levels, aiding in timely decision-making.
How to Use:
Configure the time zone and session time
Once the session begins, the indicator will begin highlighting the session range
When the session ends, Fibonacci levels based on the high and low of the session will be drawn
Use these levels to identify potential support and resistance areas
PDHL levels with INTRADAY Auto FIBThe present script includes Previous day High/low levels and once the PDH or PDL breaks the present bar's background changes color according to the direction of price breakout.
It's helpful when working on lower timeframe charts with small screen space, so that the user can know that the PDHL has been taken out in one glance at the chart instead of scrolling all around to find out whether the PDH or PDL are broken or not.
The high and low of day before yesterday are also plotted for reference.
The intraday fib levels get drawn taking present day's high and low into account, useful to mark support/retest levels.
The color of the intraday AUTO FIB high and low lines also change from gray to respective assigned colors once the present day price crosses PDH or PDL this is helpful while viewing charts on mobile app.
Disclaimer: Only for studying price movement ideas, trading is not advised.

ALMA stdev band with fibsArnaud Legoux Moving Average with standard deviation band and standard deviation Fibonacci levels.
Standard deviation band is alma + stdev and alma - stdev.
Fibonacci levels are alma + stdev * fib ratio and alma - stdev * fib ratio (0.382 / 0.5 / 0.618 / 1.618 / 2.618).
Used like a moving average, but also shows probable price range based on past volatility, and helps to recognize support/resistance levels, trends and trend momentum based on the Fibonacci levels.

Donchian Channels ModDONCHIAN FIBONACCI MODD VERSION
This indicator is based on a Donchian Channel with Fibonacci zones based on high and lows of certain period . As one can see it clearly identifies the trend and it only turns aqua when its above a spefic fib level and turns red when below specfic fib level , this help traders by not talking long or short position while its in no trade zone when the candle turns gray .This works on ALL TIMEFRAME & ANY SEGMENT
Aqua candle= Super Bullish
Red candle= Super Bearish
Gray Candle= NO TRADE ZONE (can take long or short in retracement coz the stop loss will be minimum )
Long condition = When the candle turns lime one can place the SL at the Low of the band and keep trailing , at time the trend is still long and candle turns gray one can re entry long just at support and place the SL just below the band .
Short condition = When the candle turns red one can place the SL at the High of the band and keep trailing, at time the trend is still short and candle turns gray one can re entry short just at the resistance and place the SL just below the band .
Hope this be helpful for my trading view family !
God Bless !

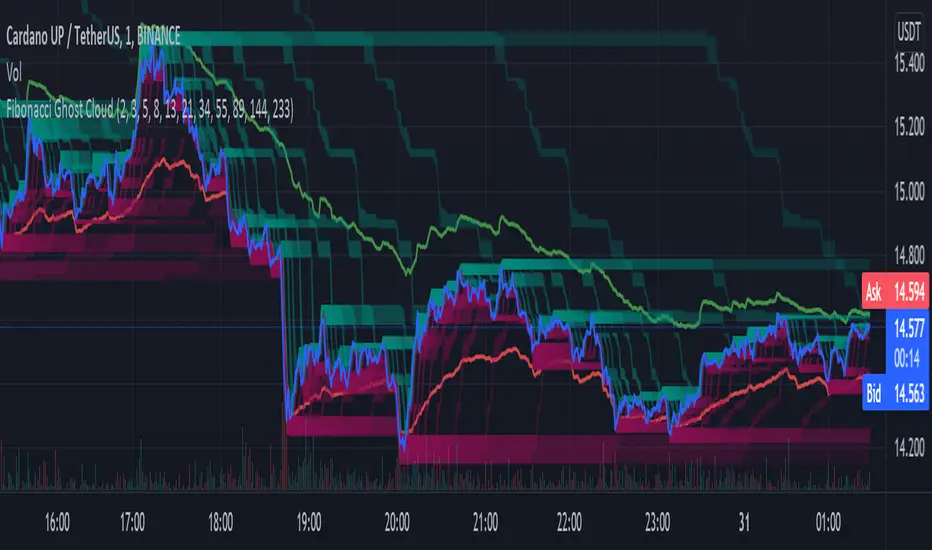
Fibonacci Ghost CloudHello my nocturnal minions.... This is your dark knight in the crypto light.... your alpha and omega, your crypto king reigning wisdom down from my gilded throne of code!
Enjoy the spooky Fibonacci Ghost Cloud. Shadows of previous Fibonacci look-back levels provide possible entries, stop losses, and take profit levels for intrepid crypto travelers.
DESCRIPTION
This indicator is front weighted by using the Fibonacci integer sequence..... 2,3,5,8,13. Each green and red "ghost" is a reflection of the highest highs and lowest lows of a given FIB lookback. The guide lines, red and green, are averages of the highs (green) and the lows (red).
USAGE
The "ghosts" can be used as possible support and resistance levels. They diminish in intensity (they become more transparent) as these ghosts move back further in time. When multiple greens overlap it is an indicator of a lot of recent price action at that level. The same is true of overlapping red.
In addition, the amount of ghosts above and/or below are indicative of recent price action taking place at a higher or a lower level
CURRENT PRICE IS LOWER THAN RECENT PA - There will be many green ghosts above, but few or no red ghosts below.
CURRENT PRICE IS HIGHER THAN RECENT PA- There will be many red ghosts below, but few or no green above
TAKE PROFIT - Possible take profit targets could be on the approach to a previous green level
STOP LOSS - Possible stop losses could be at lower red level
Like Bollinger bands, the green and red "average" lines can help to indicate that a security is oversold or underbought according to how close it is to a recent average. Nearing the red line can indicate that the security is oversold - and the converse is also true.
DERIVATIONS
Within the code is additional greyed-out lines which could be activated allowing you to target the open or close, instead of the High-Low - the current settings
SETTINGS:
You can change the FIB levels and substitute your own integer sequence to use as the lookback.
Feel free to offer feedback and/or suggest features you would like to have added.
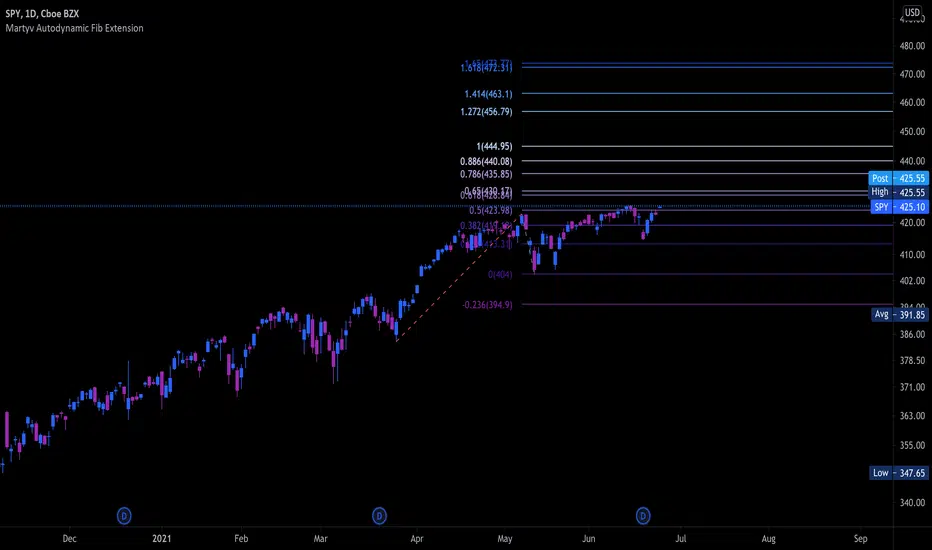
Martyv Auto Fib Extension with Logarithmic SupportSimilar to the Auto Fib Retracement tool - I took the out-of-the-box functionality and added Logarithmic support, as well as nicer colors and easier management of levels. I'm... 90% sure I got the Fib calculations correct. If you see something, say something! Would love any suggestions for improvement.
Auto Pitchfork, Fib Retracement and Zig Zag by DGTPitchfork is a technical indicator for a quick and easy way for traders to identify possible levels of support and resistance of an asset's price. It is presents and based on the idea that the market is geometric and cyclical in nature
Developed by Alan Andrews, so sometimes called Andrews’ Pitchfork
It is created by placing three points at the end of previous trends
Schiff and Modified Pitchfork is a technical analysis tool derived from Andrews' Pitchfork
In general, traders will purchase the asset when the price falls near the support of either the center trendline or the lowest trendline. Conversely, they'll sell the asset when it approaches the resistance of either the center line or the highest trendline.
█ Study OPTIONS
Auto Pitchfork , the main aim of the study
Pivots threshold can be customized by “Deviation” and “Depth” input options
Pitchfork Type selection, available options Andrews' Pitchfork (Original), Schiff and Modified Pitchfork
Ability to set ALERTs for the Pitchfork Levels
Ability to add customized levels (all level lines customizable)
Auto Fib Retracement – This is the build-in study of TradingView, slight changes applied to fit with Auto Pitchfork
Zig Zag – Derived from build-in Auto Fib Retracement with some customization options.
█ Usage Tips :
Andrews' Pitchfork (Original) best fit in a Strong Trending Market
Schiff and Modified Pitchfork better with Correcting or Sideways Market. Modified Pitchfork is almost identical to a Parallel Chanel
Disclaimer :
Trading success is all about following your trading strategy and the indicators should fit within your trading strategy, and not to be traded upon solely
The script is for informational and educational purposes only. Use of the script does not constitute professional and/or financial advice. You alone have the sole responsibility of evaluating the script output and risks associated with the use of the script. In exchange for using the script, you agree not to hold dgtrd TradingView user liable for any possible claim for damages arising from any decision you make based on use of the script

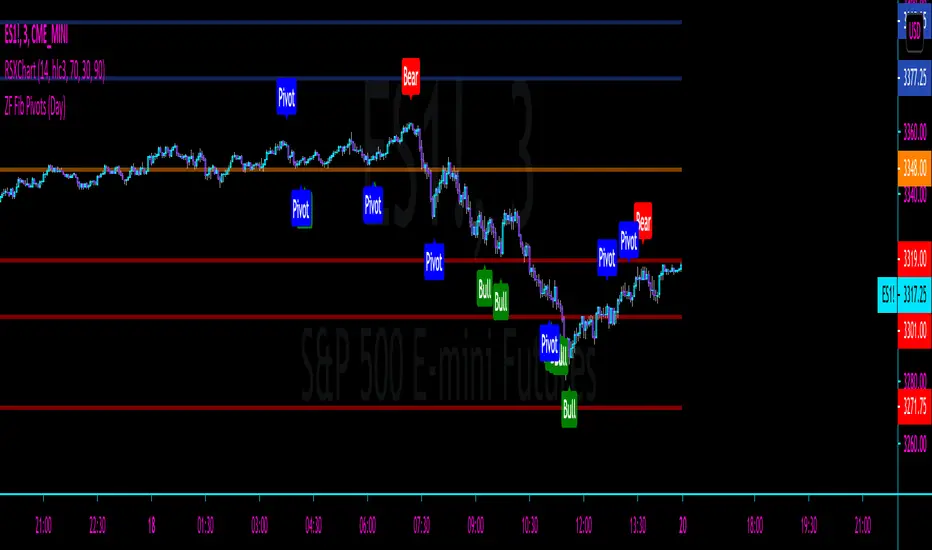
ZFelds Fib Pivots CrackTFPivots Calculated from Fib Lookbacks. This Particular version is for use with 1-3m timeframes and will not work higher. If you want to use this indicator with higher timeframes, see the standard "ZFelds Fib Pivots".
Auto Fib CustomThis is simply a slight modification of the built-in Auto Fib Retracement script. I extended the price levels to round at 5 digits rather than 2 and included 5 custom fib levels that can be turned on or off. The defaults are also updated a bit per my own personal preference but those of course can be changed. There are probably others with better versions out there but I'm getting started on Pine so have at it if you wish.

Auto Fib Retracement with logarithmic ScaleThis is the same Original Pine Built-in Script announced in tradingview blog on 19-05-2020 ( "Auto Fib Retracement — the New Pine Indicator" ), but with the option to use on Logarithmic Scale.
Donchian FibsSo this is donchian channel with its fibs level
the TF is set to 1440 min to show daily trend
the highs and lows of the channel is shown
so why this shit?
I like sometime to play on lower TF lets say 5 min chart or 15 min chart
So if I reduce the TF to 60 on 5 or 15 min chart I can get more realistic fib system then the regular that we normaly use
So you need to play with TF to get the best result for your chart :)

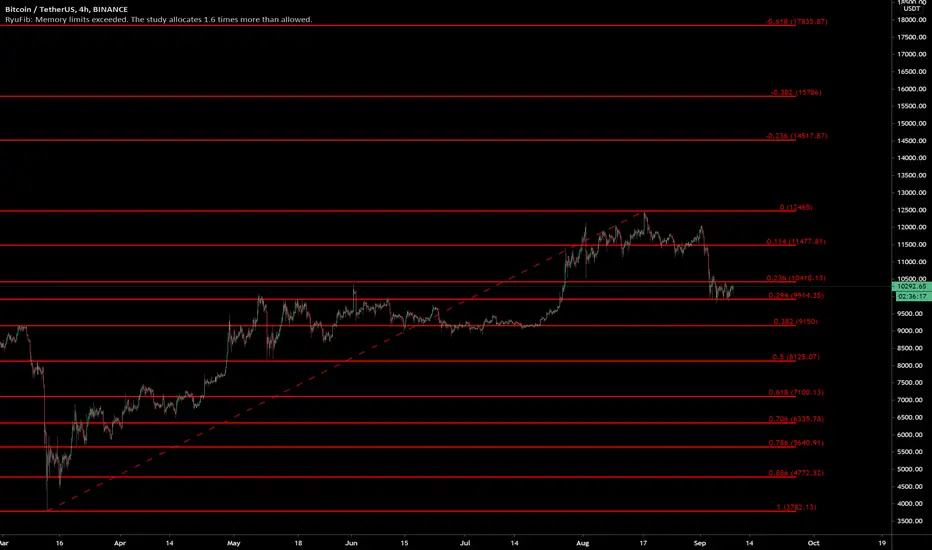
RyuFib🔰 Auto Fibonacci Retracement
New look, features, and improvements from the previous auto Fibonacci indicator. Now looks like the Fib Retracement Tool that you can draw and with all of it's settings options. This indicator will automatically draw all the Fibonacci levels onto the chart and update for each timeframe and adjust saving you time. By default the length is long so it will show the major levels, however, can be adjusted to any custom length or shorter length to select various retracements. An improvement to the indicator in the update is that now it will auto update and adjust to fit the history length. The previous custom timeframe option has been removed, since you can select any length for retracement anyways and is not needed. Lines that go further back in history that are not shown in the chart view are not loaded to prevent loading lines not in view, this done by TradingView. So if the length is long the lines do not appear unless you scroll back further in history to the start point in time of the retracement history. To prevent this, by default the lines are extended to the left so you don't have to scroll back for them to show, but you can still turn off the extend if you choose. Another update improvement is that it will now auto detect and adjust the Fibonacci retracement type, i.e, from high to low or low to high with the appropriate levels, with the option to reverse like the tool gives. Now also shows the trend line which shows the points used from the retracement from the high and low, which can also be turned on/off. Additionally, another improvement now the Fibonacci price levels are shown along with the levels.
This indicator shows all of the common default Fibonacci levels as well as my own added fib levels for the default levels, with the default extension levels, and added custom levels. By default there 9 of the common and my added Fibonacci levels displayed, plus the 2 for the high and low, so 11 levels, plus default 3 extension levels and 3 reverse extension levels, and 18 additional custom Fibonacci levels that are hidden and can be turned on and adjusted. So there are 35 total Fibonacci levels with the levels and price labels. All of the Fibonacci levels can be customized and adjusted in the settings with an input and can be turned on/off to be shown or hidden.
You don't need to do anything, simply load the indicator and it will auto adjust the appropriate length if needed, retracement type, and display the Fibonacci levels for each timeframe and update. However, you can still change the custom Fibonacci settings and style settings as you choose.
📌 Note: New update and redesign updated to new version pine script v4. This is published as a new indicator since it is now completely different redesigned with updates and improvements, and since the description was too long to fit in an update. This older Auto Fibonacci indicator is no longer used and updated by this one.
📌The following are the custom settings options of the user interface:
📌 For the plots display options:
Can show/hide all Fibonacci levels with a single master control switch
Can turn on/off the default Fibonacci extension levels
Can turn on/off the default Fibonacci reverse extension levels
Can show/hide all Fibonacci levels labels
Can show/hide all Fibonacci price labels
Can show/hide the Fibonacci trend line
📌 Fibonacci retracement settings:
Can adjust each Fibonacci level custom input
Reverse option to reverse the levels retracement type and levels
Can select the Fibonacci length max bars back, which will also auto adjust if needed if too long
Option to select the candle type for the retracement to use wick or candle close, default uses wick
📌 Fibonacci custom style settings:
The style settings updates for all 35 Fibonacci levels so you don't have to do individually
Can adjust all of the colors to your preference, default red since works for both black/white backgrounds
Adjusting the color will adjust all of the colors for the levels line, levels label, and price label
Can adjust the lines to solid, dashed, or dotted as preferred
Can extend lines to the left, right, or both, or turn off, default extended left
Can change the levels labels to display as levels or percents, i.e, 0.618 or 61.8%
Can adjust the width of the Fibonacci lines
Can adjust the size of the Fibonacci levels and price text labels
Can adjust the offset to shift the levels and price text labels
📌 Example on Bitcoin currently on the 1h showning Fibonacci levels being respected.
📌 Another example with BTC on the 15m showing price ping pong between Fibonacci levels; and with different settings with white color and levels shown as percents option.
📌 Here is Bitcoin again on the 1D timeframe with just default settings. Based on the history the indicator automatically selected the appropriate length and shows the high and low point and drew the levels. We can see the major Fibonacci levels being respected and with the extension levels can see the further future potential resistances.
ote 3d v0This was supposed to be an automatic ICT OTE (Optimal Trade Entry) Fib level placement on a 3-day scale, but this did not turn out anywhere near close to how I envisioned it working.
Probably with some more development and applied math for the fib levels, I can get this to work even with breached 3D levels, but currently it's an exercise in frustration.

BOSS| FIBONACCIBOSS PRO TRADING SYSTEM INDICATORS
Used to determine directional movement and potential Fibonacci support/resistance levels.
Pivot Points use the prior period's high, low and close to estimate future support and resistance levels.
Set alerts for each individual fib and pivot, or set one alert for any fib or pivot cross.
Use Daily for lower time frames
Use Weekly for higher timeframes
Use monthly for 12H and up
Indicator Is a part of our PRO trading system.
Purchase System Here: bosscripts.com

Auto FIB v1Auto FIB indicator defects automatically high and low for the coins and created Fib lines.
I would greatly appreciate if you could leave feedback on this indicator.
if you like this indicator, I would greatly appreciate if you can donate for the hard work.
BTC - 138yXLNU2CJBuTJ9tBYkKBcv1wC17VN2RV
ETH -0x435a32d7F1383626F271eE9f999d18b83453BF80
LTC - LcsfSCsRDqPWxH7vC5wMGJXh8x3bfKvvZj
ETC - 0x3f6cAfdc0544a34DdC0E0fd4908C68Ec6a803708
Lysergik's Stochastic SynergyThis indicator shows the average Stochastic RSI output of the 15m, 1h, 2h, 4h, and Daily Stochastic RSI. It will change in its behavior depending on the time-frame you're using, but for many markets it works best on the 30m time-frame and the daily time-frame.
It is best used along with Lysergik's Fib Cross, which will allow you to avoid false signals in the stochastic synergy indicator. If your MA cross (50, 200) indicates a direction change opposite of the stochastic RSI synergy indicator then that is a signal to wait for more price action to determine your entry/exit points.
Using the Lysergik's Fib Cross, the same applies, but remember that a golden cross (white cross symbol) followed directly by a golden ratio cross (gold cross symbol) is even further indication that the stochastic RSI needs more breathing room before reversing.
This indicator is fully adjustable for you to back-test against charts and refine the indicator to your market.
The inputs in respective order are as follows:
RSI Length, Stoch Length, Smooth K, Smooth D, Upper Limit, Lower Limit, Basis
Enjoy and remember only make trades on your own terms.
Happy trading/investing! :)

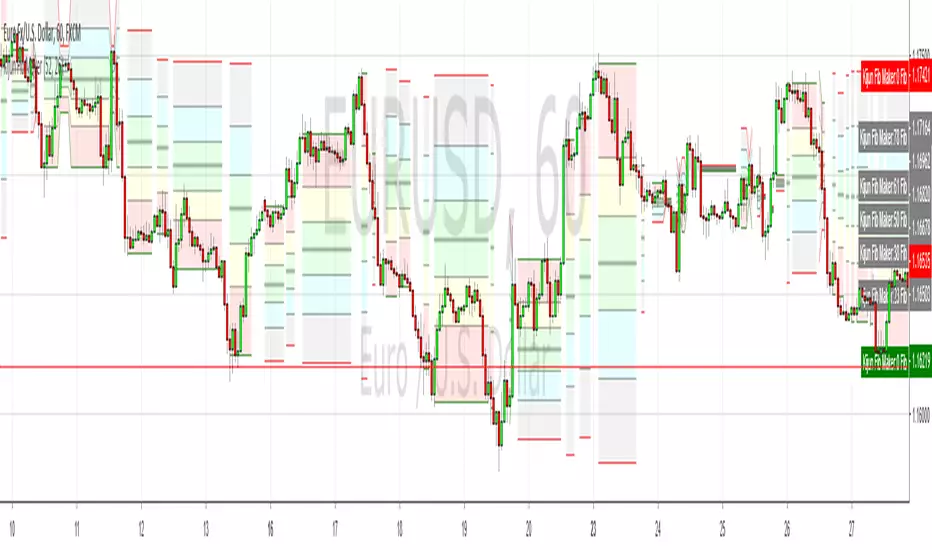
Kijun-based Fib Retracement MakerI noticed a while back that Ichimoku's Kijun line is generally the same as the 50% fib, particular when it's flat, so I coded this to draw fibs from that point. Obviously it draws too many (and maybe someone has a solution for this?) but I think it's a cool idea so here it is
Fibonacci Retracement (S)-GoldThe Automatic Fib Retracement-Gold script indicates the 38.2%, 50%, 61.8% and 65% pullback regions.
The lines of the upper and lower pivots , the support and resistance areas are also highlighted as well as the Golden Pocket.
Customisable Fib Length - Time period over which max and min pivots are chosen.
Offsetfib - Automatically offsets the pivots and sell zone as your entry position
will be some time after the upper and lower pivots are set.
Works well when used in combination with an oscillator which highlights Divergence.
A strategy based off buying the 50-618 with a defined stop loss the other side of the 65 can easily be formulated. This tool will automatically plot those points but a defined Risk Management strategy will always be needed.
The 382 region can also be plotted, allowing for lesser retracements coinciding with wave 4 pullbacks (Elliott Wave Traders).
Works best in Bearish trends but will work on all timeframes ( Bearish correction in an uptrend also possible).
Previous pivots shown but be careful to identify which of the several pivots you are using.
Start at a larger timeframe and move down. (Entries consistent on several timeframes are golden)
Pivots and retracements are dynamic. Be sure to note your entry and targets.

Fibonacci Retracement (L)-SilverThe Automatic Fib Retracement - Silver script indicates the 50-61.8% pullback region.
The lines of the upper and lower pivots, the support and resistance areas are also highlighted.
Customisable Fib Length - Time period over which max and min pivots are chosen.
Offsetfib - Automatically offsets the pivots and buy zone as your entry position
will be some time after the upper and lower pivots are set.
Works well when used in combination with an oscillator which highlights Divergence.
A strategy based off buying the 50-618 with a defined stop loss and target can be the basis of your strategy.
This tool will automatically plot those points but a defined Risk Management strategy will always be needed.
Works best in Bullish trends but will work on all timeframes (Bullish correction in downtrend also possible).
Previous pivots shown but be careful to identify which of the several pivots you are using.
Start at a larger timeframe and move down. (Entries consistent on several timeframes are golden)
Pivots and retracements are dynamic. Be sure to note your entry and targets.
