GapAura: Dynamic Gap [AstroHub]GapAura is a powerful indicator designed to analyze and visualize price gaps on your charts. It focuses on the key levels created by gaps between the open of the current day and the close of the previous day. The indicator connects these gap levels with trend-like lines, allowing traders to easily identify significant price movements and potential turning points in the market.
GapCloud automatically differentiates between upward and downward gaps, helping traders visualize important support and resistance levels that emerge following these gaps. The lines representing these gaps behave like trend lines, providing clear and actionable insights for market analysis. Unlike traditional gap indicators, GapCloud offers a dynamic approach to gap visualization, making it easier for traders to assess the impact of price gaps on future market movement.
How to Use:
Gap Up: When the open of the current day is higher than the close of the previous day, GapCloud draws a line connecting these two levels. This visualizes the gap upward and helps identify the trend direction, as well as potential support zones.
Gap Down: When the open of the current day is lower than the close of the previous day, the indicator draws a line that connects these levels, showing a downward gap. This can highlight potential resistance levels.
The lines for each gap are connected to form continuous trend-like levels, giving traders a clear picture of market structure. These lines can also be used to identify areas of strong support or resistance, and potential turning points where the price may reverse or continue in the same direction.
What Makes This Indicator Unique:
GapCloud stands out by transforming gaps into trend-like lines, offering more than just a simple visualization of the gap itself. By connecting the open and close levels of the current and previous day, it allows traders to see how these price differences can act as significant support or resistance levels. These lines help traders spot market trends and potential reversals more clearly, giving them an edge in making more informed trading decisions.
The ability to visualize gaps as trend lines gives traders a unique advantage in understanding market behavior. Gaps are not just seen as isolated events; they are integrated into the overall market structure and can provide critical insights into the potential price direction.
In addition to this, GapCloud offers a high degree of customization. Users can adjust the thickness, style, and color of the gap lines to fit their trading preferences and style. This makes the indicator adaptable to various types of trading strategies, from short-term to long-term analysis.
Key Features:
Identifies and visualizes gaps between the open of the current day and the close of the previous day.
Converts gap levels into trend-like lines, providing clarity and actionable insights for traders.
Helps identify potential support and resistance levels based on gap locations.
Fully customizable settings, including line thickness, style, and color, to suit individual trading preferences.
Provides a dynamic approach to gap analysis, helping traders forecast market direction and potential reversals with greater accuracy.
GapCloud is an essential tool for any trader looking to enhance their market analysis. By visualizing price gaps as connected trend lines, it simplifies the process of identifying key levels and market structure, giving traders an edge in understanding price movements and making more informed decisions.
Cerca negli script per "gaps"

ICT Comprehensive IndicatorThe ICT Comprehensive Indicator is a robust tool designed to assist traders in applying key concepts from the Inner Circle Trader (ICT) methodology directly to their TradingView charts. This indicator integrates multiple ICT principles to provide a holistic view of the market, aiming to enhance trading analysis and decision-making.
Key Features:
Market Structure Analysis:
Swing Highs and Lows:
Automatically identifies and marks significant swing highs and lows.
Plots dotted lines at these levels to help visualize market structure and trend direction.
Red Lines: Indicate swing highs (potential resistance levels).
Green Lines: Indicate swing lows (potential support levels).
Liquidity Pools:
Highlights potential liquidity zones where stop orders may accumulate.
Marks previous swing highs and lows with small circles to identify areas institutions might target for liquidity.
Order Blocks Identification:
Bullish Order Blocks:
Detects the last down candle before a significant up move.
Draws solid green lines extended to the right, representing potential support zones.
Bearish Order Blocks:
Detects the last up candle before a significant down move.
Draws solid red lines extended to the right, representing potential resistance zones.
Fair Value Gaps (Imbalance):
Identifies and highlights gaps in price action where the market moved rapidly, leaving imbalances.
Draws semi-transparent purple boxes to indicate areas where the price may retrace to fill unfilled orders.
Time and Price Theory:
Trading Sessions Highlighting:
Allows selection of major trading sessions: London, New York, or Asian.
Highlights the chosen session on the chart with a semi-transparent blue background.
Helps focus analysis during periods of higher liquidity and volatility.
Risk Management Display:
Calculates and displays the risk amount per trade based on user-defined account size and risk percentage.
Shows a label on the chart with the calculated risk amount to aid in proper position sizing.
Custom Alerts:
Provides alerts for key events:
Formation of new swing highs or lows.
Identification of bullish or bearish order blocks.
Detection of fair value gaps (both up and down).
How to Use:
Add the Indicator to Your Chart:
Search for "ICT Comprehensive Indicator" in the TradingView Indicators library.
Add it to your chart to begin analyzing the market using ICT concepts.
Configure Settings:
Trading Session Selection:
Choose your preferred trading session in the settings to highlight it on the chart.
Risk Management Inputs:
Input your account size and desired risk percentage per trade to calculate the risk amount.
Analyze the Market:
Market Structure:
Use the swing highs and lows to understand the current market trend.
Liquidity Pools and Order Blocks:
Identify potential entry and exit points by observing marked liquidity zones and order blocks.
Fair Value Gaps:
Look for possible retracement areas where the price may return to fill imbalances.
Set Up Alerts:
Configure alerts based on the indicator's conditions to stay informed of significant market events without constant monitoring.
Benefits:
Holistic Analysis Tool:
Combines multiple ICT principles into one indicator for comprehensive market analysis.
Enhanced Decision-Making:
Aids in identifying high-probability trade setups by highlighting key market areas.
Time-Efficient:
Automates the detection of complex trading concepts, saving time on manual analysis.
Customizable:
Adjustable settings allow tailoring the indicator to individual trading styles and preferences.
Disclaimer:
This indicator is intended for educational and informational purposes only.
Trading involves significant risk, and past performance is not indicative of future results.
Always conduct thorough analysis and consult with a financial advisor before making trading decisions.
Note:
This indicator is inspired by ICT concepts but is not affiliated with or endorsed by Inner Circle Trader.
Users are encouraged to have a foundational understanding of ICT methodologies to fully benefit from this tool.

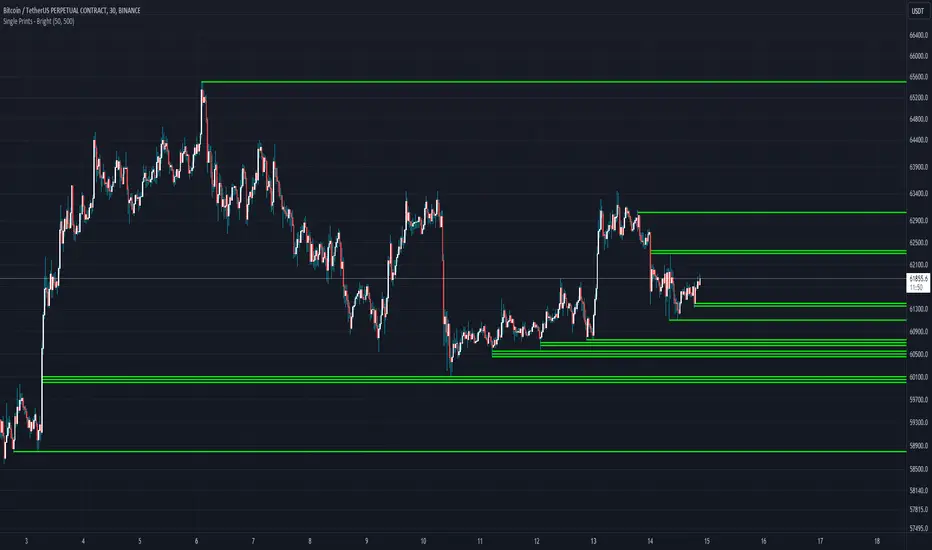
Single Prints - BrightSingle Prints - Bright is a Pine Script indicator designed to identify and visualize significant price levels based on the concept of "single prints." Single prints are price levels where trading activity occurred but with little or no follow-up trading. This indicator plots these levels as lines on the chart, allowing traders to easily identify areas of potential support and resistance.
Features:
Customizable Line Distance: Adjust the distance between single print lines to suit your trading style and time frame.
Maximum Array Size: Set the maximum number of single print lines to be displayed on the chart.
Remove Gaps: Option to remove lines if the price gaps over them.
Multiple Time Frames: Choose to display single prints for daily, weekly, monthly, or yearly sessions.
Color Gradient: Lines are color-coded from red (oldest) to green (newest), providing a visual indication of their relative age.
Thicker, Lime-Colored Lines: Improved visibility with thicker lines and a more lime-like color scheme for easier identification on the chart.
How to Use:
Adding the Indicator:
Open TradingView and navigate to the chart where you want to apply the indicator.
Click on "Indicators" in the top menu.
Select "Pine Editor" and paste the provided Pine Script code into the editor.
Click "Add to Chart" to apply the indicator to your chart.
Configuring the Indicator:
Distance Between Lines (i_line_distance): Set the distance between single print lines. Adjust this value based on the volatility and time frame of the asset you are trading.
Maximum Array Size (i_max_array): Define the maximum number of single print lines to be displayed on the chart. This helps in managing the clutter on the chart.
Remove Gaps (i_remove_gaps): Enable or disable the option to remove lines if the price gaps over them.
Show Daily Single Prints (ShowDailySP): Enable or disable the display of daily single print lines.
Show Daily Extended Single Prints (ShowDailyExtendSP): Enable or disable the display of extended daily single print lines.
Show Weekly Single Prints (ShowWeeklySP): Enable or disable the display of weekly single print lines.
Show Monthly Single Prints (ShowMonthlySP): Enable or disable the display of monthly single print lines.
Show Yearly Single Prints (ShowYearlySP): Enable or disable the display of yearly single print lines.
Interpreting the Lines:
Color Gradient: The lines are color-coded to indicate their relative age. Red lines are the oldest, transitioning through orange and yellow to green, which are the newest. This color gradient helps in identifying how long a particular level has been significant.
Support and Resistance: Use the lines as potential support and resistance levels. Multiple lines close together indicate stronger levels of support or resistance.
Volatility Analysis: The number of lines within a gap can provide insights into market volatility. More lines indicate higher volatility and multiple potential reversal points within that range.
Trading Strategies:
Entry Points: Consider using the single print lines as entry points. For example, if the price approaches a support level with multiple lines, it may be a good buying opportunity.
Stop Loss and Take Profit: Use the single print lines to set stop-loss and take-profit levels. Placing stop-loss orders below multiple support lines can provide additional protection.
Trend Analysis: Analyze the overall trend and momentum in conjunction with the single print lines to make informed trading decisions. If the price is in an uptrend and approaching resistance lines, watch for potential breakouts or reversals.
Advanced ICT Theory - A-ICT📊 Advanced ICT Theory (A-ICT): The Institutional Manipulation Detector
Are you tired of being the liquidity? Stop chasing shadows and start tracking the architects of price movement.
This is not another lagging indicator. This is a complete framework for viewing the market through the lens of institutional traders. Advanced ICT Theory (A-ICT) is an all-in-one, military-grade analysis engine designed to decode the complex language of "Smart Money." It automates the core tenets of Inner Circle Trader (ICT) methodology, moving beyond simple patterns to build a dynamic, real-time narrative of market manipulation, liquidity engineering, and institutional order flow.
AIT provides a living blueprint of the market, identifying high-probability zones, tracking structural shifts, and scoring the quality of setups with a sophisticated, multi-factor algorithm. This is your X-ray into the market's true intentions.
🔬 THE CORE ENGINE: DECODING THE THEORY & FORMULAS
A-ICT is built upon a sophisticated, multi-layered logic system that interprets price action as a story of cause and effect. It does not guess; it confirms. Here is the foundational theory that drives the engine:
1. Market Structure: The Blueprint of Trend
The script first establishes a deep understanding of the market's skeleton through multi-level pivot analysis. It uses ta.pivothigh and ta.pivotlow to identify significant swing points.
Internal Structure (iBOS): Minor swings that show the short-term order flow. A break of internal structure is the first whisper of a potential shift.
External Structure (eBOS): Major swing points that define the primary trend. A confirmed break of external structure is a powerful statement of trend continuation. AIT validates this with optional Volume Confirmation (volume > volumeSMA * 1.2) and Candle Confirmation to ensure the break is driven by institutional force, not just a random spike.
Change of Character (CHoCH): This is the earthquake. A CHoCH occurs when a confirmed eBOS happens against the prevailing trend (e.g., a bearish eBOS in a clear uptrend). A-ICT flags this immediately, as it is the strongest signal that the primary trend is under threat of reversal.
2. Liquidity Engineering: The Fuel of the Market
Institutions don't buy into strength; they buy into weakness. They need liquidity. A-ICT maps these liquidity pools with forensic precision:
Buyside & Sellside Liquidity (BSL/SSL): Using ta.highest and ta.lowest, AIT identifies recent highs and lows where clusters of stop-loss orders (liquidity) are resting. These are institutional targets.
Liquidity Sweeps: This is the "manipulation" part of the detector. AIT has a specific formula to detect a sweep: high > bsl and close < bsl . This signifies that institutions pushed price just high enough to trigger buy-stops before aggressively selling—a classic "stop hunt." This event dramatically increases the quality score of subsequent patterns.
3. The Element Lifecycle: From Potential to Power
This is the revolutionary heart of A-ICT. Zones are not static; they have a lifecycle. AIT tracks this with its dynamic classification engine.
Phase 1: PENDING (Yellow): The script identifies a potential zone of interest based on a specific candle formation (a "displacement"). It is marked as "Pending" because its true nature is unknown. It is a question.
Phase 2: CLASSIFICATION: After the zone is created, AIT watches what happens next. The zone's identity is defined by its actions:
ORDER BLOCK (Blue): The highest-grade element. A zone is classified as an Order Block if it directly causes a Break of Structure (BOS) . This is the footprint of institutions entering the market with enough force to validate the new trend direction.
TRAP ZONE (Orange): A zone is classified as a Trap Zone if it is directly involved in a Liquidity Sweep . This indicates the zone was used to engineer liquidity, setting a "trap" for retail traders before a reversal.
REVERSAL / S&R ZONE (Green): If a zone is not powerful enough to cause a BOS or a major sweep, but still serves as a pivot point, it's classified as a general support/resistance or reversal zone.
4. Market Inefficiencies: Gaps in the Matrix
Fair Value Gaps (FVG): AIT detects FVGs—a 3-bar pattern indicating an imbalance—with a strict formula: low > high (for a bullish FVG) and gapSize > atr14 * 0.5. This ensures only significant, volatile gaps are shown. An FVG co-located with an Order Block is a high-confluence setup.
5. Premium & Discount: The Law of Value
Institutions buy at wholesale (Discount) and sell at retail (Premium). AIT uses a pdLookback to define the current dealing range and divides it into three zones: Premium (sell zone), Discount (buy zone), and Equilibrium. An element's quality score is massively boosted if it aligns with this principle (e.g., a bullish Order Block in a Discount zone).
⚙️ THE CONTROL PANEL: A COMPLETE GUIDE TO THE INPUTS MENU
Every setting is a lever, allowing you to tune the AIT engine to your exact specifications. Master these to unlock the script's full potential.
🎯 A-ICT Detection Engine
Min Displacement Candles: Controls the sensitivity of element detection. How it works: It defines the number of subsequent candles that must be "inside" a large parent candle. Best practice: Use 2-3 for a balanced view on most timeframes. A higher number (4-5) will find only major, more significant zones, ideal for swing trading. A lower number (1) is highly sensitive, suitable for scalping.
Mitigation Method: Defines when a zone is considered "used up" or mitigated. How it works: Cross triggers as soon as price touches the zone's boundary. Close requires a candle to fully close beyond it. Best practice: Cross is more responsive for fast-moving markets. Close is more conservative and helps filter out fake-outs caused by wicks, making it safer for confirmations.
Min Element Size (ATR): A crucial noise filter. How it works: It requires a detected zone to be at least this multiple of the Average True Range (ATR). Best practice: Keep this around 0.5. If you see too many tiny, irrelevant zones, increase this value to 0.8 or 1.0. If you feel the script is missing smaller but valid zones, decrease it to 0.3.
Age Threshold & Pending Timeout: These manage visual clutter. How they work: Age Threshold removes old, mitigated elements after a set number of bars. Pending Timeout removes a "Pending" element if it isn't classified within a certain window. Best practice: The default settings are optimized. If your chart feels cluttered, reduce the Age Threshold. If pending zones disappear too quickly, increase the Pending Timeout.
Min Quality Threshold: Your primary visual filter. How it works: It hides all elements (boxes, lines, labels) that do not meet this minimum quality score (0-100). Best practice: Start with the default 30. To see only A- or B-grade setups, increase this to 60 or 70 for an exceptionally clean, high-probability view.
🏗️ Market Structure
Lookbacks (Internal, External, Major): These define the sensitivity of the trend analysis. How they work: They set the number of bars to the left and right for pivot detection. Best practice: Use smaller values for Internal (e.g., 3) to see minor structure and larger values for External (e.g., 10-15) to map the main trend. For a macro, long-term view, increase the Major Swing Lookback.
Require Volume/Candle Confirmation: Toggles for quality control on BOS/CHoCH signals. Best practice: It is highly recommended to keep these enabled. Disabling them will result in more structure signals, but many will be false alarms. They are your filter against market noise.
... (Continue this detailed breakdown for every single input group: Display Configuration, Zones Style, Levels Appearance, Colors, Dashboards, MTF, Liquidity, Premium/Discount, Sessions, and IPDA).
📊 THE INTELLIGENCE DASHBOARDS: YOUR COMMAND CENTER
The dashboards synthesize all the complex analysis into a simple, actionable intelligence briefing.
Main Dashboard (Bottom Right)
ICT Metrics & Breakdown: This is your statistical overview. Total Elements shows how much structure the script is tracking. High Quality instantly tells you if there are any A/B grade setups nearby. Unmitigated vs. Mitigated shows the balance of fresh opportunities versus resolved price action. The breakdown by Order Blocks, Trap Zones, etc., gives you a quick read on the market's recent character.
Structure & Market Context: This is your core bias. Order Flow tells you the current script-determined trend. Last BOS shows you the most recent structural event. CHoCH Active is a critical warning. HTF Bias shows if you are aligned with the higher timeframe—the checkmark (✓) for alignment is one of the most important confluence factors.
Smart Money Flow: A volume-based sentiment gauge. Net Flow shows the raw buying vs. selling pressure, while the Bias provides an interpretation (e.g., "STRONG BULLISH FLOW").
Key Guide (Large Dashboard only): A built-in legend so you never have to guess. It defines every pattern, structure type, and special level visually.
📖 Narrative Dashboard (Bottom Left)
This is the "story" of the market, updated in real-time. It's designed to build your trading thesis.
Recent Elements Table: A live list of the most recent, high-quality setups. It displays the Type , its Narrative Role (e.g., "Bullish OB caused BOS"), its raw Quality percentage, and its final Trade Score grade. This is your at-a-glance opportunity scanner.
Market Narrative Section: This is the soul of A-ICT. It combines all data points into a human-readable story:
📍 Current Phase: Tells you if you are in a high-volatility Killzone or a consolidation phase like the Asian Range.
🎯 Bias & Alignment: Your primary direction, with a clear indicator of HTF alignment or conflict.
🔗 Events: A causal sequence of recent events, like "💧 Sell-side liquidity swept →
📊 Bullish BOS → 🎯 Active Order Block".
🎯 Next Expectation: The script's logical conclusion. It provides a specific, forward-looking hypothesis, such as "📉 Pullback expected to bullish OB at 1.2345 before continuation up."
🎨 READING THE BATTLEFIELD: A VISUAL INTERPRETATION GUIDE
Every color and line is a piece of information. Learn to read them together to see the full picture.
The Core Zones (Boxes):
Blue Box (Order Block): Highest probability zone for trend continuation. Look for entries here.
Orange Box (Trap Zone): A manipulation footprint. Expect a potential reversal after price interacts with this zone.
Green Box (Reversal/S&R): A standard pivot area. A good reference point but requires more confluence.
Purple Box (FVG): A market imbalance. Acts as a magnet for price. An FVG inside an Order Block is an A+ confluence.
The Structural Lines:
Green/Red Line (eBOS): Confirms the trend direction. A break above the green line is bullish; a break below the red line is bearish.
Thick Orange Line (CHoCH): WARNING. The previous trend is now in question. The market character has changed.
Blue/Red Lines (BSL/SSL): Liquidity targets. Expect price to gravitate towards these lines. A dotted line with a checkmark (✓) means the liquidity has been "swept" or "purged."
How to Synthesize: The magic is in the confluence. A perfect setup might look like this: Price sweeps below a red SSL line , enters a green Discount Zone during the NY Killzone , and forms a blue Order Block which then causes a green eBOS . This sequence, visible at a glance, is the story of a high-probability long setup.
🔧 THE ARCHITECT'S VISION: THE DEVELOPMENT JOURNEY
A-ICT was forged from the frustration of using lagging indicators in a market that is forward-looking. Traditional tools are reactive; they tell you what happened. The vision for A-ICT was to create a proactive engine that could anticipate institutional behavior by understanding their objectives: liquidity and efficiency. The development process was centered on creating a "lifecycle" for price patterns—the idea that a zone's true meaning is only revealed by its consequence. This led to the post-breakout classification system and the narrative-building engine. It's designed not just to show you patterns, but to tell you their story.
⚠️ RISK DISCLAIMER & BEST PRACTICES
Advanced ICT Theory (A-ICT) is a professional-grade analytical tool and does not provide financial advice or direct buy/sell signals. Its analysis is based on historical price action and probabilities. All forms of trading involve substantial risk. Past performance is not indicative of future results. Always use this tool as part of a comprehensive trading plan that includes your own analysis and a robust risk management strategy. Do not trade based on this indicator alone.
観の目つよく、見の目よわく
"Kan no me tsuyoku, ken no me yowaku"
— Miyamoto Musashi, The Book of Five Rings
English: "Perceive that which cannot be seen with the eye."
— Dskyz, Trade with insight. Trade with anticipation.

GapCluster SR For Intraday by Chaitu50c**GapCluster SR For Intraday by Chaitu50c**
**Overview**
GapCluster SR plots dynamic intraday support and resistance lines based on candle-to-candle gaps. Whenever an Open/Close or High/Low gap is detected, the script draws a horizontal level and “clusters” nearby gaps into a single line to keep your chart clean. Lines automatically color-code relative to price—green when below, red when above.
---
**Key Features**
* **Gap Detection Modes**: Choose between Open/Close gaps (default) or High/Low gaps.
* **Clustering**: Merge levels within a user-defined vertical range to avoid clutter.
* **Dynamic Coloring**: Levels below price turn green; levels above price turn red.
* **Session Reset**: Automatically removes levels older than X days.
* **Fully Customizable**: Adjust buffer, cluster range, line width, lookback period, and both above/below colors.
---
**Inputs**
| Input | Default | Description |
| ---------------------------- | :--------: | ------------------------------------------- |
| Gap Type | Open/Close | Select gap detection method |
| Price Buffer (points) | 5.0 | Maximum distance for gap matching |
| Cluster Range (points) | 100.0 | Vertical distance within which levels merge |
| Line Width | 2 | Thickness of plotted lines |
| Days to Include | 14 | Number of days to retain past levels |
| Color for Levels Above Price | red | Line color when level > current price |
| Color for Levels Below Price | green | Line color when level < current price |
---
**How to Use**
1. **Add to Chart**: Apply on any intraday timeframe (1 min, 5 min, etc.).
2. **Select Mode**: Pick Open/Close or High/Low in settings.
3. **Tweak Inputs**: Raise/lower buffer for tighter/looser gap detection; adjust cluster range to group levels; change lookback (“Days to Include”) to control session reset.
4. **Interpret Levels**:
* **Green Lines** mark potential support zones.
* **Red Lines** mark potential resistance zones.
5. **Combine with Your Strategy**: Use alongside volume, momentum, or trend filters for confirmation.
---
**Tips & Tricks**
* **Intraday Entries**: Look for price reaction at green (support) lines for long setups, or red (resistance) lines for shorts.
* **Filter Noise**: Increase the “Cluster Range” to consolidate many close levels into stronger, singular lines.
---
**Disclaimer**
This indicator is provided “as-is” for educational purposes only. Always backtest any setup and practice proper risk management.

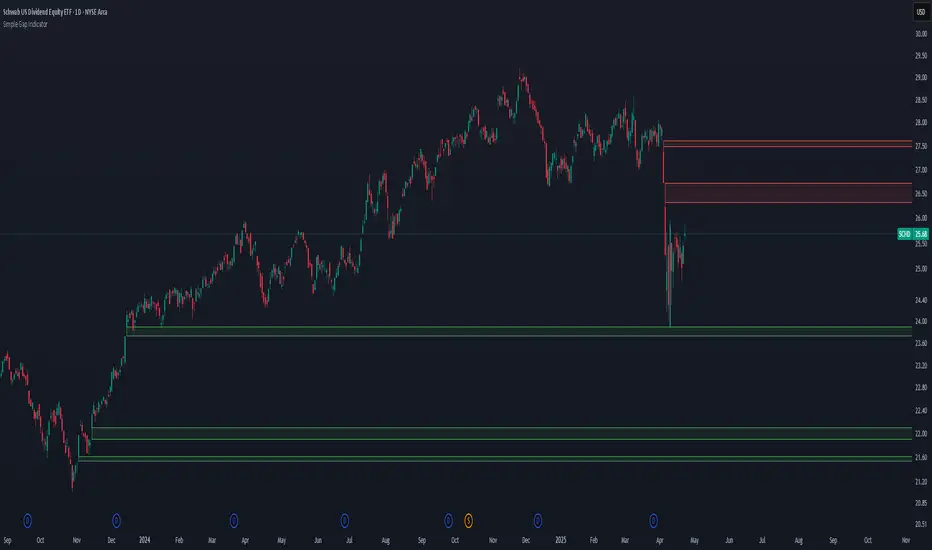
Simple Gap IndicatorThe Simple Gap Indicator is a powerful tool designed to detect and visualize price gaps in the market, helping traders identify key levels of support and resistance. Whether you're analyzing gap-up or gap-down scenarios, this indicator provides clear visual cues to enhance your trading decisions.
Key Features:
Gap Detection: Automatically identifies gap-up and gap-down events based on user-defined sensitivity.
Customizable Display Styles: Choose between lines or boxes to represent gaps visually, depending on your preference.
Extend Options: Control how far the lines or boxes extend on the chart (None, Right, Left, Both).
User-Friendly Inputs: Adjust the number of bars to examine and sensitivity to gap size for precise customization.
Dynamic Visualization:
Gap-Up Events: Highlighted in green for easy identification of bullish gaps.
Gap-Down Events: Highlighted in red for bearish gaps.
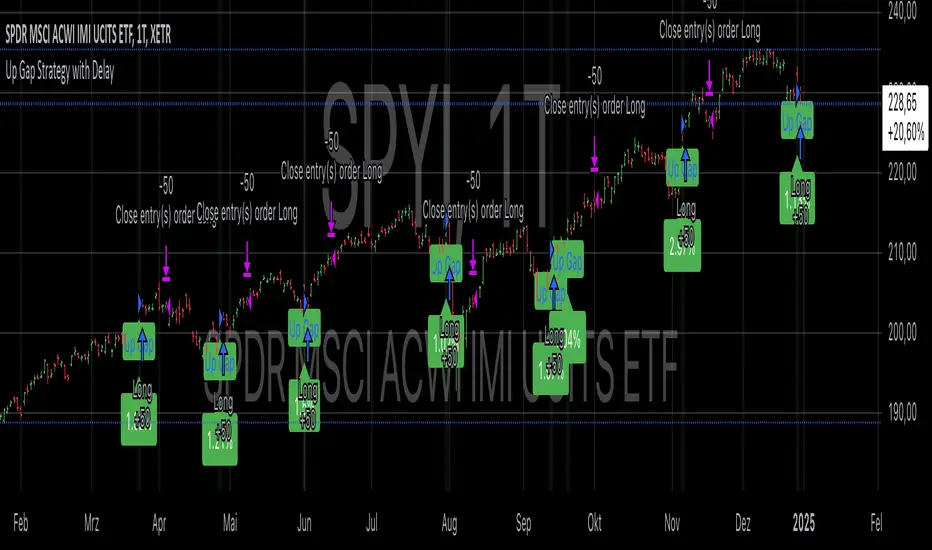
Up Gap Strategy with DelayThis strategy, titled “Up Gap Strategy with Delay,” is based on identifying up gaps in the price action of an asset. A gap is defined as the percentage difference between the current bar’s open price and the previous bar’s close price. The strategy triggers a long position if the gap exceeds a user-defined threshold and includes a delay period before entering the position. After entering, the position is held for a set number of periods before being closed.
Key Features:
1. Gap Threshold: The strategy defines an up gap when the gap size exceeds a specified threshold (in percentage terms). The gap threshold is an input parameter that allows customization based on the user’s preference.
2. Delay Period: After the gap occurs, the strategy waits for a delay period before initiating a long position. This delay can help mitigate any short-term volatility that might occur immediately after the gap.
3. Holding Period: Once the position is entered, it is held for a user-defined number of periods (holdingPeriods). This is to capture the potential post-gap trend continuation, as gaps often indicate strong directional momentum.
4. Gap Plotting: The strategy visually plots up gaps on the chart by placing a green label beneath the bar where the gap condition is met. Additionally, the background color turns green to highlight up-gap occurrences.
5. Exit Condition: The position is exited after the defined holding period. The strategy ensures that the position is closed after this time, regardless of whether the price is in profit or loss.
Scientific Background:
The gap theory has been widely studied in financial literature and is based on the premise that gaps in price often represent areas of significant support or resistance. According to research by Kaufman (2002), gaps in price action can be indicators of future price direction, particularly when they occur after a period of consolidation or a trend reversal. Moreover, Gaps and their Implications in Technical Analysis (Murphy, 1999) highlights that gaps can reflect imbalances between supply and demand, leading to high momentum and potential price continuation or reversal.
In trading strategies, utilizing gaps with specific conditions, such as delay and holding periods, can enhance the ability to capture significant price moves. The strategy’s delay period helps avoid potential market noise immediately after the gap, while the holding period seeks to capitalize on the price continuation that often follows gap formation.
This methodology aligns with momentum-based strategies, which rely on the persistence of trends in financial markets. Several studies, including Jegadeesh & Titman (1993), have documented the existence of momentum effects in stock prices, where past price movements can be predictive of future returns.
Conclusion:
This strategy incorporates gap detection and momentum principles, supported by empirical research in technical analysis, to attempt to capitalize on price movements following significant gaps. By waiting for a delay period and holding the position for a specified time, it aims to mitigate the risk associated with early volatility while maximizing the potential for sustained price moves.
SP500 Session Gap Fade StrategySummary in one paragraph
SPX Session Gap Fade is an intraday gap fade strategy for index futures, designed around regular cash sessions on five minute charts. It helps you participate only when there is a full overnight or pre session gap and a valid intraday session window, instead of trading every open. The original part is the gap distance engine which anchors both stop and optional target to the previous session reference close at a configurable flat time, so every trade’s risk scales with the actual gap size rather than a fixed tick stop.
Scope and intent
• Markets. Primarily index futures such as ES, NQ, YM, and liquid index CFDs that exhibit overnight gaps and regular cash hours.
• Timeframes. Intraday timeframes from one minute to fifteen minutes. Default usage is five minute bars.
• Default demo used in the publication. Symbol CME:ES1! on a five minute chart.
• Purpose. Provide a simple, transparent way to trade opening gaps with a session anchored risk model and forced flat exit so you are not holding into the last part of the session.
• Limits. This is a strategy. Orders are simulated on standard candles only.
Originality and usefulness
• Unique concept or fusion. The core novelty is the combination of a strict “full gap” entry condition with a session anchored reference close and a gap distance based TP and SL engine. The stop and optional target are symmetric multiples of the actual gap distance from the previous session’s flat close, rather than fixed ticks.
• Failure mode it addresses. Fixed sized stops do not scale when gaps are unusually small or unusually large, which can either under risk or over risk the account. The session flat logic also reduces the chance of holding residual positions into late session liquidity and news.
• Testability. All key pieces are explicit in the Inputs: session window, minutes before session end, whether to use gap exits, whether TP or SL are active, and whether to allow candle based closes and forced flat. You can toggle each component and see how it changes entries and exits.
• Portable yardstick. The main unit is the absolute price gap between the entry bar open and the previous session reference close. tp_mult and sl_mult are multiples of that gap, which makes the risk model portable across contracts and volatility regimes.
Method overview in plain language
The strategy first defines a trading session using exchange time, for example 08:30 to 15:30 for ES day hours. It also defines a “flat” time a fixed number of minutes before session end. At the flat bar, any open position is closed and the bar’s close price is stored as the reference close for the next session. Inside the session, the strategy looks for a full gap bar relative to the prior bar: a gap down where today’s high is below yesterday’s low, or a gap up where today’s low is above yesterday’s high. A full gap down generates a long entry; a full gap up generates a short entry. If the gap risk engine is enabled and a valid reference close exists, the strategy measures the distance between the entry bar open and that reference close. It then sets a stop and optional target as configurable multiples of that gap distance and manages them with strategy.exit. Additional exits can be triggered by a candle color flip or by the forced flat time.
Base measures
• Range basis. The main unit is the absolute difference between the current entry bar open and the stored reference close from the previous session flat bar. That value is used as a “gap unit” and scaled by tp_mult and sl_mult to build the target and stop.
Components
• Component one: Gap Direction. Detects full gap up or full gap down by comparing the current high and low to the previous bar’s high and low. Gap down signals a long fade, gap up signals a short fade. There is no smoothing; it is a strict structural condition.
• Component two: Session Window. Only allows entries when the current time is within the configured session window. It also defines a flat time before the session end where positions are forced flat and the reference close is updated.
• Component three: Gap Distance Risk Engine. Computes the absolute distance between the entry open and the stored reference close. The stop and optional target are placed as entry ± gap_distance × multiplier so that risk scales with gap size.
• Optional component: Candle Exit. If enabled, a bullish bar closes short positions and a bearish bar closes long positions, which can shorten holding time when price reverses quickly inside the session.
• Session windows. Session logic uses the exchange time of the chart symbol. When changing symbols or venues, verify that the session time string still matches the new instrument’s cash hours.
Fusion rule
All gates are hard conditions rather than weighted scores. A trade can only open if the session window is active and the full gap condition is true. The gap distance engine only activates if a valid reference close exists and use_gap_risk is on. TP and SL are controlled by separate booleans so you can use SL only, TP only, or both. Long and short are symmetric by construction: long trades fade full gap downs, short trades fade full gap ups with mirrored TP and SL logic.
Signal rule
• Long entry. Inside the active session, when the current bar shows a full gap down relative to the previous bar (current high below prior low), the strategy opens a long position. If the gap risk engine is active, it places a gap based stop below the entry and an optional target above it.
• Short entry. Inside the active session, when the current bar shows a full gap up relative to the previous bar (current low above prior high), the strategy opens a short position. If the gap risk engine is active, it places a gap based stop above the entry and an optional target below it.
• Forced flat. At the configured flat time before session end, any open position is closed and the close price of that bar becomes the new reference close for the following session.
• Candle based exit. If enabled, a bearish bar closes longs, and a bullish bar closes shorts, regardless of where TP or SL sit, as long as a position is open.
What you will see on the chart
• Markers on entry bars. Standard strategy entry markers labeled “long” and “short” on the gap bars where trades open.
• Exit markers. Standard exit markers on bars where either the gap stop or target are hit, or where a candle exit or forced flat close occurs. Exit IDs “long_gap” and “short_gap” label gap based exits.
• Reference levels. Horizontal lines for the current long TP, long SL, short TP, and short SL while a position is open and the gap engine is enabled. They update when a new trade opens and disappear when flat.
• Session background. This version does not add background shading for the session; session logic runs internally based on time.
• No on chart table. All decisions are visible through orders and exit levels. Use the Strategy Tester for performance metrics.
Inputs with guidance
Session Settings
• Trading session (sess). Session window in exchange time. Typical value uses the regular cash session for each contract, for example “0830-1530” for ES. Adjust if your broker or symbol uses different hours.
• Minutes before session end to force exit (flat_before_min). Minutes before the session end where positions are forced flat and the reference close is stored. Typical range is 15 to 120. Raising it closes trades earlier in the day; lowering it allows trades later in the session.
Gap Risk
• Enable gap based TP/SL (use_gap_risk). Master switch for the gap distance exit engine. Turning it off keeps entries and forced flat logic but removes automatic TP and SL placement.
• Use TP limit from gap (use_gap_tp). Enables gap based profit targets. Typical values are true for structured exits or false if you want to manage exits manually and only keep a stop.
• Use SL stop from gap (use_gap_sl). Enables gap based stop losses. This should normally remain true so that each trade has a defined initial risk in ticks.
• TP multiplier of gap distance (tp_mult). Multiplier applied to the gap distance for the target. Typical range is 0.5 to 2.0. Raising it places the target further away and reduces hit frequency.
• SL multiplier of gap distance (sl_mult). Multiplier applied to the gap distance for the stop. Typical range is 0.5 to 2.0. Raising it widens the stop and increases risk per trade; lowering it tightens the stop and may increase the number of small losses.
Exit Controls
• Exit with candle logic (use_candle_exit). If true, closes shorts on bullish candles and longs on bearish candles. Useful when you want to react to intraday reversal bars even if TP or SL have not been reached.
• Force flat before session end (use_forced_flat). If true, guarantees you are flat by the configured flat time and updates the reference close. Turn this off only if you understand the impact on overnight risk.
Filters
There is no separate trend or volatility filter in this version. All trades depend on the presence of a full gap bar inside the session. If you need extra filtering such as ATR, volume, or higher timeframe bias, they should be added explicitly and documented in your own fork.
Usage recipes
Intraday conservative gap fade
• Timeframe. Five minute chart on ES regular session.
• Gap risk. use_gap_risk = true, use_gap_tp = true, use_gap_sl = true.
• Multipliers. tp_mult around 0.7 to 1.0 and sl_mult around 1.0.
• Exits. use_candle_exit = false, use_forced_flat = true. Focus on the structured TP and SL around the gap.
Intraday aggressive gap fade
• Timeframe. Five minute chart.
• Gap risk. use_gap_risk = true, use_gap_tp = false, use_gap_sl = true.
• Multipliers. sl_mult around 0.7 to 1.0.
• Exits. use_candle_exit = true, use_forced_flat = true. Entries fade full gaps, stops are tight, and candle color flips flatten trades early.
Higher timeframe gap tests
• Timeframe. Fifteen minute or sixty minute charts on instruments with regular gaps.
• Gap risk. Keep use_gap_risk = true. Consider slightly higher sl_mult if gaps are structurally wider on the higher timeframe.
• Note. Expect fewer trades and be careful with sample size; multi year data is recommended.
Properties visible in this publication
• On average our risk for each position over the last 200 trades is 0.4% with a max intraday loss of 1.5% of the total equity in this case of 100k $ with 1 contract ES. For other assets, recalculations and customizations has to be applied.
• Initial capital. 100 000.
• Base currency. USD.
• Default order size method. Fixed with size 1 contract.
• Pyramiding. 0.
• Commission. Flat 2 USD per order in the Strategy Tester Properties. (2$ buying + 2$selling)
• Slippage. One tick in the Strategy Tester Properties.
• Process orders on close. ON.
Realism and responsible publication
• No performance claims are made. Past results do not guarantee future outcomes.
• Costs use a realistic flat commission and one tick of slippage per trade for ES class futures.
• Default sizing with one contract on a 100 000 reference account targets modest per trade risk. In practice, extreme slippage or gap through events can exceed this, so treat the one and a half percent risk target as a design goal, not a guarantee.
• All orders are simulated on standard candles. Shapes can move while a bar is forming and settle on bar close.
Honest limitations and failure modes
• Economic releases, thin liquidity, and limit conditions can break the assumptions behind the simple gap model and lead to slippage or skipped fills.
• Symbols with very frequent or very large gaps may require adjusted multipliers or alternative risk handling, especially in high volatility regimes.
• Very quiet periods without clean gaps will produce few or no trades. This is expected behavior, not a bug.
• Session windows follow the exchange time of the chart. Always confirm that the configured session matches the symbol.
• When both the stop and target lie inside the same bar’s range, the TradingView engine decides which is hit first based on its internal intrabar assumptions. Without bar magnifier, tie handling is approximate.
Legal
Education and research only. This strategy is not investment advice. You remain responsible for all trading decisions. Always test on historical data and in simulation with realistic costs before considering any live use.

High Time Frame FVG [TakingProphets]HTF FVG
The HTF FVG indicator is built for traders who want a clean, multi-timeframe view of Fair Value Gaps (FVGs) without manually flipping charts. It automatically detects unmitigated FVGs across up to five higher timeframes and overlays them directly on your active chart, keeping your execution bias aligned with higher-timeframe liquidity.
✨ What it does
📌 Multi-timeframe mapping – Detects and plots bullish/bearish FVGs across up to 5 custom HTFs + your current chart.
🧩 Auto-labeling – Each gap is tagged with its originating timeframe (e.g., M5, H1, D1).
🔄 Live updates – FVGs extend forward in time and are automatically removed once mitigated based on your plan.
🟢 Inverse FVGs (optional) – Highlight “inverse gaps” for traders who utilize them in reversal models.
🎯 Consequent Encroachment lines – Enable mid-gap CE levels for precision-based trade management.
⚡ Optimized performance – Built with array management, capped lookback periods, and per-timeframe limits for smooth charting.
🛠️ How it works
Fair Value Gaps are detected using a 3-candle structure:
Bullish FVG → the high of two candles ago is below the low of the prior candle.
Bearish FVG → the low of two candles ago is above the high of the prior candle.
For each selected timeframe:
When an FVG forms, a box is drawn from the gap boundaries and extended forward by a configurable number of bars.
If price closes into the gap on its originating timeframe, the box is automatically removed.
If Consequent Encroachment is enabled, a mid-gap line is plotted for refined targeting.
When multiple gaps exist per side, only the closest unmitigated one remains highlighted for clarity.
⚙️ Inputs & customization
Detection Sensitivity → High / Medium / Low
Lookback Period → 1 Day / 1 Week / 1 Month / Max
Extend Gaps → Add extra forward bars beyond the originating candle.
Show Consequent Encroachment → Toggle CE midlines on/off.
Show Inverse FVGs → Mark inverted gaps for advanced models.
Custom HTFs → Choose up to 5 timeframes to map onto your execution chart.
Appearance Settings → Configure colors, transparency, label size, and gap boundary styles.
📈 Practical tips
Use smaller execution timeframes (e.g., 1m–5m) and overlay multiple HTFs (e.g., M15, H1, H4, D1).
Watch for stacked HTF FVGs in the same price zone — these often create higher-probability draw areas.
Pair CE midlines with session timing, PD arrays, and liquidity concepts to refine entries.
Limit your lookback period and max stored FVGs for better performance during volatile sessions.
📌 Notes
This tool does not generate buy/sell signals. It’s a context mapping utility to help align your trading plan with higher-timeframe structure.
Weekend gaps are automatically filtered out to reduce false positives.
🏷️ Credits & disclaimer
Concepts: ICT / Smart Money methodologies around imbalances and liquidity gaps.
Disclaimer: This script is for educational purposes only and should not be considered financial advice. Always test on demo and trade your own plan.

FVG Detector by SZEMEK>>> DESCRIPTION IN ENGLISH
An advanced indicator for the TradingView platform designed to detect and visualize Fair Value Gaps (FVG) and Inversion Fair Value Gaps (iFVG) on charts.
Main Features:
1. FVG Detection:
- The script identifies both bullish and bearish Fair Value Gaps.
- Users can choose which types of FVG to display (Bullish, Bearish, both, or none).
2. FVG Visualization:
- Gaps are represented as rectangular boxes on the chart.
- The color and transparency of the boxes are configurable separately for bullish and bearish FVG.
- The option to add a frame to FVG boxes with separate color settings.
- FVG labels are available with configurable colors and sizes.
3. Dynamic Tracking of FVG Fill:
- The script monitors the extent to which each gap has been filled by subsequent price movements.
- The fill level is visualized using gray overlay on the original FVG box.
- The percentage fill is updated on the label.
4. Automatic Removal of FVG:
- The ability to set a percentage threshold (100%, 75%, 50%, or no removal) after which FVG is removed from the chart.
5. iFVG Detection:
- The script also identifies Inversion Fair Value Gaps (iFVG), which can be displayed as separate boxes.
- iFVG are available in bullish and bearish versions.
- Users can choose which types of iFVG to display (Bullish, Bearish, both, or none).
- iFVG can also have labels and frames.
6. Limitation of Checked Candles:
- Users can specify the maximum number of candles back that the script will analyze for FVG and iFVG.
- Alerts: The indicator allows setting alerts for detected iFVG, both bullish and bearish.
Advanced Features:
- Accurate calculation of FVG fill percentage, considering both wicks and candle bodies.
- Dynamic updating of FVG boxes and their labels in real-time.
- Flexible memory management through the removal of outdated or filled FVG.
- The ability to customize the appearance of iFVG, including colors, labels, and frames.
This script serves as an advanced tool for technical analysis, enabling traders to identify potential support and resistance areas based on the concept of Fair Value Gaps and their inverted versions.
>>> DESCRIPTION IN ENGLISH
Zaawansowany wskaźnik dla platformy TradingView, który służy do wykrywania i wizualizacji luk wartości godziwej (Fair Value Gaps, FVG) oraz odwróconych luk wartości godziwej (Inversion Fair Value Gaps, iFVG) na wykresie.
Główne cechy
1. Wykrywanie FVG:
- Skrypt identyfikuje zarówno bycze (Bullish), jak i niedźwiedzie (Bearish) luki wartości godziwej.
- Użytkownik może wybrać, które typy FVG mają być wyświetlane (Bullish, Bearish, oba lub żadne).
2. Wizualizacja FVG:
- Luki są przedstawiane jako prostokątne boxy na wykresie.
- Kolor i przezroczystość boxów są konfigurowalne osobno dla FVG byczych i niedźwiedzich.
- Możliwość dodania ramki do boxów FVG z osobnymi ustawieniami kolorów.
- Etykiety FVG są dostępne z konfigurowalnymi kolorami i rozmiarami.
3. Dynamiczne śledzenie wypełnienia FVG:
- Skrypt monitoruje, w jakim stopniu każda luka została wypełniona przez późniejsze ruchy ceny.
- Stopień wypełnienia jest wizualizowany za pomocą szarego koloru nakładanego na oryginalny box FVG.
- Procent wypełnienia jest aktualizowany na etykiecie.
4. Automatyczne usuwanie FVG:
- Możliwość ustawienia progu procentowego (100%, 75%, 50% lub brak usuwania), po którego przekroczeniu FVG jest usuwany z wykresu.
5. Wykrywanie iFVG:
- Skrypt dodatkowo identyfikuje odwrócone luki wartości godziwej (iFVG), które mogą być wyświetlane jako osobne boxy.
- iFVG są dostępne w wersji byczej i niedźwiedziej.
- Użytkownik może wybrać, które typy iFVG mają być wyświetlane (Bullish, Bearish, oba lub żadne).
- iFVG również mogą mieć etykiety i ramki.
6. Ograniczenie sprawdzanych świec:
- Użytkownik może określić maksymalną liczbę świec wstecz, które skrypt będzie analizował w poszukiwaniu FVG i iFVG.
- Alerty: Wskaźnik umożliwia ustawienie alertów dla wykrytych luk iFVG, zarówno bullish, jak i bearish.
Zaawansowane funkcje
- Dokładne obliczanie procentu wypełnienia FVG, uwzględniające zarówno knoty, jak i ciała świec.
- Dynamiczne aktualizowanie boxów FVG i ich etykiet w czasie rzeczywistym.
- Elastyczne zarządzanie pamięcią poprzez usuwanie nieaktualnych lub wypełnionych FVG.
- Możliwość dostosowania wyglądu iFVG, w tym kolorów, etykiet i ramki.
Skrypt ten stanowi zaawansowane narzędzie do analizy technicznej, umożliwiające traderom identyfikację potencjalnych obszarów wsparcia i oporu bazujących na koncepcji luk wartości godziwej i ich odwróconych wersjach.

Macros ICT KillZones [TradingFinder] Times & Price Trading Setup🔵 Introduction
ICT Macros, developed by Michael Huddleston, also known as ICT (Inner Circle Trader), is a powerful trading tool designed to help traders identify the best trading opportunities during key time intervals like the London and New York trading sessions.
For traders aiming to capitalize on market volatility, liquidity shifts, and Fair Value Gaps (FVG), understanding and using these critical time zones can significantly improve trading outcomes.
In today’s highly competitive financial markets, identifying the moments when the market is seeking buy-side or sell-side liquidity, or filling price imbalances, is essential for maximizing profitability.
The ICT Macros indicator is built on the renowned ICT time and price theory, which enables traders to track and leverage key market dynamics such as breaks of highs and lows, imbalances, and liquidity hunts.
This indicator automatically detects crucial market times and optimizes strategies for traders by highlighting the specific moments when price movements are most likely to occur. A standout feature of ICT Macros is its automatic adjustment for Daylight Saving Time (DST), ensuring that traders remain synced with the correct session times.
This means you can rely on accurate market timing without the need for manual updates, allowing you to focus on capturing profitable trades during critical timeframes.
🔵 How to Use
The ICT Macros indicator helps you capitalize on trading opportunities during key market moments, particularly when the market is breaking highs or lows, filling Fair Value Gaps (FVG), or addressing imbalances. This indicator is particularly beneficial for traders who seek to identify liquidity, market volatility, and price imbalances.
🟣 Sessions
London Sessions
London Macro 1 :
UTC Time : 06:33 to 07:00
New York Time : 02:33 to 03:00
London Macro 2 :
UTC Time : 08:03 to 08:30
New York Time : 04:03 to 04:30
New York Sessions
New York Macro AM 1 :
UTC Time : 12:50 to 13:10
New York Time : 08:50 to 09:10
New York Macro AM 2 :
UTC Time : 13:50 to 14:10
New York Time : 09:50 to 10:10
New York Macro AM 3 :
UTC Time : 14:50 to 15:10
New York Time : 10:50 to 11:10
New York Lunch Macro :
UTC Time : 15:50 to 16:10
New York Time : 11:50 to 12:10
New York PM Macro :
UTC Time : 17:10 to 17:40
New York Time : 13:10 to 13:40
New York Last Hour Macro :
UTC Time : 19:15 to 19:45
New York Time : 15:15 to 15:45
These time intervals adjust automatically based on Daylight Saving Time (DST), helping traders to enter or exit trades during key market moments when price volatility is high.
Below are the main applications of this tool and how to incorporate it into your trading strategies :
🟣 Combining ICT Macros with Trading Strategies
The ICT Macros indicator can easily be used in conjunction with various trading strategies. Two well-known strategies that can be combined with this indicator include:
ICT 2022 Trading Model : This model is designed based on identifying market liquidity, structural price changes, and Fair Value Gaps (FVG). By using ICT Macros, you can identify the key time intervals when the market is seeking liquidity, filling imbalances, or breaking through important highs and lows, allowing you to enter or exit trades at the right moment.
Silver Bullet Strategy : This strategy, which is built around liquidity hunting and rapid price movements, can work more accurately with the help of ICT Macros. The indicator pinpoints precise liquidity times, helping traders take advantage of market shifts caused by filling Fair Value Gaps or correcting imbalances.
🟣 Capitalizing on Price Volatility During Key Times
Large market algorithms often seek liquidity or fill Fair Value Gaps (FVG) during the intervals marked by ICT Macros. These periods are when price volatility increases, and traders can use these moments to enter or exit trades.
For example, if sell-side liquidity is drained and the market fills an imbalance, the price might move toward buy-side liquidity. By identifying these moments, which may also involve breaking a previous high or low, you can leverage rapid market fluctuations to your advantage.
🟣 Identifying Liquidity and Price Imbalances
One of the important uses of ICT Macros is identifying points where the market is seeking liquidity and correcting imbalances. You can determine high or low liquidity levels in the market before each ICT Macro, as well as Fair Value Gaps (FVG) and price imbalances that need to be filled, using them to adjust your trading strategy. This capability allows you to manage trades based on liquidity shifts or imbalance corrections without needing a bias toward a specific direction.
🔵 Settings
The ICT Macros indicator offers various customization options, allowing users to tailor it to their specific needs. Below are the main settings:
Time Zone Mode : You can select one of the following options to define how time is displayed:
UTC : For traders who need to work with Universal Time.
Session Local Time : The local time corresponding to the London or New York markets.
Your Time Zone : You can specify your own time zone (e.g., "UTC-4:00").
Your Time Zone : If you choose "Your Time Zone," you can set your specific time zone. By default, this is set to UTC-4:00.
Show Range Time : This option allows you to display the time range of each session on the chart. If enabled, the exact start and end times of each interval are shown.
Show or Hide Time Ranges : Toggle on/off for visual clarity depending on user preference.
Custom Colors : Set distinct colors for each session, allowing users to personalize their chart based on their trading style.These settings allow you to adjust the key time intervals of each trading session to your preference and customize the time format according to your own needs.
🔵 Conclusion
The ICT Macros indicator is a powerful tool for traders, helping them to identify key time intervals where the market seeks liquidity or fills Fair Value Gaps (FVG), corrects imbalances, and breaks highs or lows. This tool is especially valuable for traders using liquidity-based strategies such as ICT 2022 or Silver Bullet.
One of the key features of this indicator is its support for Daylight Saving Time (DST), ensuring you are always in sync with the correct trading session timings without manual adjustments. This is particularly beneficial for traders operating across different time zones.
With ICT Macros, you can capitalize on crucial market opportunities during sensitive times, take advantage of imbalances, and enhance your trading strategies based on market volatility, liquidity shifts, and Fair Value Gaps.

Fair Value Gap (FVG) Oscillator [UAlgo]The "Fair Value Gap (FVG) Oscillator " is designed to identify and visualize Fair Value Gaps (FVG) within a given lookback period on a trading chart. This indicator helps traders by highlighting areas where price gaps may signify potential trading opportunities, specifically bullish and bearish patterns. By leveraging volume and Average True Range (ATR) data, the FVG Oscillator aims to enhance the accuracy of pattern recognition and provide more reliable signals for trading decisions.
🔶 Identification of Fair Value Gap (FVG)
Fair Value Gaps (FVG) are specific price areas where gaps occur, and they are often considered significant in technical analysis. These gaps can indicate potential future price movements as the market may return to fill these gaps. This indicator identifies two types of FVGs:
Bullish FVG: Occurs when the current low price is higher than the high price two periods ago. This condition suggests a potential upward price movement.
Obtains with:
low > high
Bearish FVG: Occurs when the current high price is lower than the low price two periods ago. This condition suggests a potential downward price movement.
Obtains with:
high < low
The FVG Oscillator not only identifies these gaps but also verifies them using volume and ATR conditions to ensure more reliable trading signals.
🔶 Key Features
Lookback Period: Users can set the lookback period to determine how far back the indicator should search for FVG patterns.
ATR Multiplier: The ATR Multiplier is used to adjust the sensitivity of the ATR-based conditions for verifying FVG patterns.
Volume SMA Period: This setting determines the period for the Simple Moving Average (SMA) of the volume, which helps in identifying high volume conditions.
Why ATR and Volume are Used?
ATR (Average True Range) and volume are integrated into the Fair Value Gap (FVG) Oscillator to enhance the accuracy and reliability of the identified patterns. ATR measures market volatility, helping to filter out insignificant price gaps and focus on impactful ones, ensuring that the signals are relevant and strong. Volume, on the other hand, confirms the strength of price movements. High volume often indicates the sustainability of these movements, reducing the likelihood of false signals. Together, ATR and volume ensure that the detected FVGs are both significant and supported by market activity, providing more trustworthy trading signals.
Normalized Values: The FVG counts are normalized to enhance the visual representation and interpretation of the patterns on the chart.
Visual Customization and Plotting: Users can customize the colors for positive (bullish) and negative (bearish) areas, and choose whether to display these areas on the chart, also plots the bullish and bearish FVG counts, a zero line, and the net value of FVG counts. Additionally, it uses histograms to display the width of verified bullish and bearish patterns.
🔶 Disclaimer:
Use with Caution: This indicator is provided for educational and informational purposes only and should not be considered as financial advice. Users should exercise caution and perform their own analysis before making trading decisions based on the indicator's signals.
Not Financial Advice: The information provided by this indicator does not constitute financial advice, and the creator (UAlgo) shall not be held responsible for any trading losses incurred as a result of using this indicator.
Backtesting Recommended: Traders are encouraged to backtest the indicator thoroughly on historical data before using it in live trading to assess its performance and suitability for their trading strategies.
Risk Management: Trading involves inherent risks, and users should implement proper risk management strategies, including but not limited to stop-loss orders and position sizing, to mitigate potential losses.
No Guarantees: The accuracy and reliability of the indicator's signals cannot be guaranteed, as they are based on historical price data and past performance may not be indicative of future results.

FVG pointsFVGs ( fair value gaps) are imbalances that indicate displacement and are useful for reversal strategies that require displacement after a liquidity sweep
This indicator shows the size of the gap in points/dollars which can help determine momentum and strength in reversals, as does a failure or inversion (iFVG) of these gap if they fail to act as support or resistance to price. As stops are often placed on the other side of a fair value gap from entry, the indicator helps give traders an idea of stop loss size for calculating position size.
Fvg gaps below a certain points size can be considered to be weaker, larger gaps show stronger momentum. The indicator allows a minimum point size to be set so that FVGs below this minimum value will be shown without a points value.
Points value is also shown for inverted FVGs (iFVGs) by a change in colour and length of box.
By default, multiple gaps are combined together and the point value of the gap is shown, this can be toggled off in the settings to show the values of the individual gaps.
Settings:
Lookback - how many candles to look for FVGs and iFVGs
Change length of the FVG box
Change settings to decide the minimum size of gap to label
colours of boxes and labels
Option to show individual gaps or combined gaps

Smart Money Concepts [Riz]Smart Money Concepts is a comprehensive technical analysis tool for identifying institutional trading patterns and market structure. This indicator combines Smart Money Concepts (SMC), ICT methodology, and Wyckoff principles into one professional tool.
✨ KEY FEATURES
📊 VOLUMETRIC ORDER BLOCKS
• Visual representation of supply/demand zones with volume distribution
• Horizontal volume bars showing buy/sell composition inside each Order Block
• Automatic mitigation tracking
• Breaker Block detection (invalidated OBs acting as reversal zones)
• Strength rating system: ★ Weak, ★★ Medium, ★★★ Strong
• ATR-based size filtering to show only significant zones
📈 MARKET STRUCTURE DETECTION
• Break of Structure (BOS) and Change of Character (CHoCH) identification
• Higher Highs (HH), Higher Lows (HL), Lower Highs (LH), Lower Lows (LL) labels
• Internal structure pivots (iH/iL) for intraday analysis
• Auto-adjusting swing length based on timeframe
• Configurable confirmation methods (Close vs Wick-based)
💎 FAIR VALUE GAPS (FVG)
• Automatic detection of bullish and bearish imbalances
• Configurable mitigation percentage (default 50%)
• Visual tracking until gaps are filled
• Separate color schemes for clarity
💧 LIQUIDITY ANALYSIS
• Buy Side Liquidity (BSL) identification at swing highs
• Sell Side Liquidity (SSL) identification at swing lows
• Automatic sweep detection with visual confirmation
• Real-time alerts when liquidity is taken
⚖️ PREMIUM & DISCOUNT ZONES
• Dynamic range calculation based on configurable lookback period
• Equilibrium (EQ) level identification
• Previous Day High (PDH) and Previous Day Low (PDL) levels
• Helps identify favorable entry zones
📊 REAL-TIME DASHBOARD
• Live statistics on all detected patterns
• Active Order Blocks and FVGs count
• BOS/CHoCH occurrence tracking
• Liquidity sweep counters
• Recent market activity indicators
• Current trend bias display
• Fully customizable position and size
⚙️ CUSTOMIZATION OPTIONS
All aspects are fully customizable:
• Swing Length (1-50 bars) with auto-adjust for timeframe
• Max Active Order Blocks (10-100)
• Volume bar position (Left/Right) with mirror option
• Volume bar width percentage (10-50%)
• ATR size filter for Order Blocks
• Strength rating method (Touches/Age/Distance/Volume/Combined)
• All colors and transparency levels
• Dashboard position (9 locations available)
• Comprehensive alert system for all events
🎓 HOW IT WORKS
ORDER BLOCKS: Identified at the last candle before a Break of Structure. These represent institutional supply and demand zones. Volume is estimated based on candle characteristics and displayed as horizontal bars.
MARKET STRUCTURE: Tracks pivot highs and lows to determine if price is making Higher Highs/Higher Lows (bullish structure) or Lower Highs/Lower Lows (bearish structure). BOS indicates trend continuation, while CHoCH signals potential trend reversal.
LIQUIDITY: Swing highs represent Buy Side Liquidity where short positions have their stop losses. Swing lows represent Sell Side Liquidity where long positions have stop losses. The indicator tracks when these levels are "swept" by price.
FAIR VALUE GAPS: Three-candle patterns where the current candle's range doesn't overlap with the candle two bars ago, creating price imbalances that often get filled later.
📚 BEST PRACTICES
• Use on all timeframes - Auto-adjust feature optimizes settings automatically
• Look for confluence - Best setups occur when multiple concepts align (e.g., Order Block + liquidity sweep + discount zone)
• Consider risk/reward - Use Premium/Discount zones to identify favorable entry areas
• Respect market context - Order Blocks in the direction of overall trend tend to be more reliable
• Volume matters - Higher volume percentages in the expected direction may indicate stronger zones
⚠️ IMPORTANT NOTES
EDUCATIONAL TOOL: This indicator is designed for analysis and education, not as trading signals or investment advice.
VOLUME ESTIMATION: Buy/sell volume distribution is estimated based on candle characteristics since true buy/sell volume data is not available in Pine Script.
NO GUARANTEES: Past performance is not indicative of future results. All trading involves substantial risk.
RISK MANAGEMENT: Always use proper risk management and seek additional confirmation before making trading decisions.
OBJECT LIMITS: On very fast timeframes (1m, 5m) in highly volatile markets, the indicator may approach Pine Script's 500-object limit. Reduce max OBs/FVGs in settings if needed.
🔧 TECHNICAL SPECIFICATIONS
• Pine Script Version: v6
• Indicator Type: Overlay (displays on price chart)
• Maximum Objects: Optimized to stay within Pine Script limits
• Performance: Efficient rendering with configurable history management
• Updates: Real-time on every bar close
📖 METHODOLOGY
This indicator combines concepts from:
• Inner Circle Trader (ICT) methodology
• Smart Money Concepts (SMC) framework
• Wyckoff market analysis principles
• Order flow and volume spread analysis
⚖️ DISCLAIMER
This indicator is for educational and informational purposes only. It is not financial advice. Trading financial instruments carries substantial risk and may not be suitable for all investors. Past performance is not indicative of future results. Always conduct your own research and consult with a licensed financial advisor before making any investment decisions. The author assumes no responsibility for any losses incurred from using this indicator.

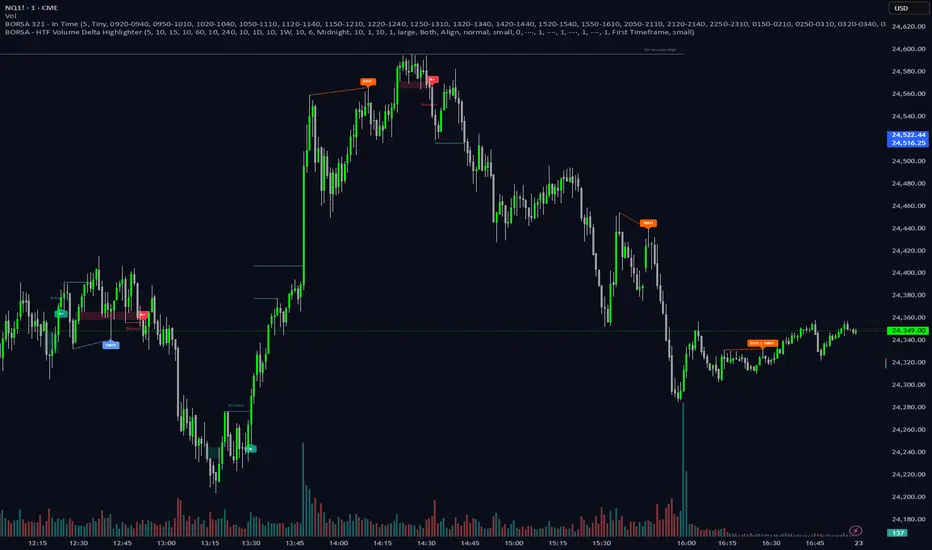
BORSA 321 - HTF Volume Delta Highlighter Overview
HTF Volume Delta Highlighter is a multi-timeframe tool that builds a compact higher-timeframe (HTF) candle panel on the right side of your chart and injects volume delta, fair value gaps (FVG) and volume imbalance (VI) directly into those candles.
Instead of constantly switching charts, you see:
Where buy vs sell volume is dominating on HTF
Which HTF candles left inefficiencies (FVG / VI)
Key open / high / low / close levels projected back onto your current timeframe
How much time is left for each HTF candle to close
All of this lives visually on your current chart, making it perfect for scalpers and intraday traders who rely on higher-timeframe context.
What It Shows
For up to six higher timeframes (default: 5m, 15m, 1H, 4H, 1D, 1W), the indicator plots:
1. HTF Candle Panel on the Right
Each HTF is drawn as a mini candle strip to the right of price.
You can control:
How many candles per HTF to display
Space between candles
Space between timeframes
Overall offset from current price
This creates a clean HTF “dashboard” without touching your main candles.
2. Volume Delta Inside Each HTF Candle
When delta mode is enabled:
Each HTF candle body is split into:
Buy volume segment (green)
Sell volume segment (red)
The split is proportional to cumulative buy vs sell volume across the entire HTF period.
Optionally, the delta value itself (buy volume − sell volume) is printed:
Positive delta inside the buy segment
Negative delta inside the sell segment
This gives a visual and numeric read of who is in control on that higher timeframe.
3. HTF Fair Value Gaps (FVG)
Within each HTF strip, the script detects and highlights fair value gaps:
Bullish FVG: shaded with a green tone, optionally labeled FVG+
Bearish FVG: shaded with a red tone, optionally labeled FVG-
A line is also drawn through the midpoint of the FVG zone.
These zones quickly show where price left inefficiencies on the higher timeframe that may act as magnets or reaction levels.
4. Volume Imbalance (VI) Zones
Between consecutive HTF candles, the script also marks volume imbalance zones:
Bullish VI zones shaded green (VI+)
Bearish VI zones shaded red (VI-)
These highlight thin or aggressively traded areas that often attract future interaction.
5. Trace Lines Back to Your Main Chart
From the most recent HTF candles, the indicator can project horizontal trace lines:
From Open, High, Low, Close of the monitored HTF candle
With separate styling for each (color, line style, width)
Optional price labels at the right edge for each level
You can choose whether these traces are anchored to the first selected timeframe or the last timeframe, giving you flexibility in what levels matter most.
6. Timeframe & Timer Labels
For each HTF strip, the indicator can show:
Timeframe label (e.g., 5m, 15m, 1H, 4H, 1D, 1W)
Countdown timer for the current HTF candle (time remaining until close)
Labels can appear at the top, bottom, or both ends of the HTF panel.
You can choose whether labels align across all HTFs or follow each strip’s own high/low.
7. Custom Daily Session Handling
For the daily timeframe, you can override the default daily open to match your session preference:
Midnight (standard calendar day)
08:30 New York time
09:30 New York time
The script then treats that custom time as the start of your “daily” candle — useful for traders who sync with cash session opens.
8. Day of Week Labels (For Daily)
On daily HTF candles, you can optionally print a day-of-week letter above the candle:
M, T, W, T, F, S, S
This gives a quick sense of where in the week the current candle sits.
Key Inputs & Customization
HTF 1–6 Enable & Timeframe
Turn each HTF strip on/off
Set timeframe (5m, 15m, 1H, 4H, 1D, 1W, etc.)
Choose how many candles per HTF to display
Max Sets
Limit how many HTFs are shown at once (e.g., only next 3 HTFs).
Styling
Body, border, and wick colors for bullish and bearish candles
Candle width, spacing, and panel offset
Label colors and sizes
Delta Settings
Toggle delta mode on/off
Toggle delta values text inside candles
Imbalance Settings
Toggle FVG on/off, with bullish/bearish colors, labels
Toggle Volume Imbalance on/off, with bullish/bearish colors, labels
Control label text size
Trace Settings
Turn trace lines on/off
Customize style, color, and thickness for O/H/L/C
Choose whether to anchor traces to the first or last timeframe
Label & Timer Settings
Enable/disable HTF labels and timers
Choose label position: Top / Bottom / Both
Alignment mode: Align all strips or Follow Candles
If the chosen HTF isn’t valid for the current chart (not a proper multiple or too low), the script will show a clear on-chart message telling you to increase your chart timeframe to match the selected HTF requirements.
How It Helps Traders
Scalpers & intraday traders can stay on their low timeframe (e.g., 1m / 3m / 5m) while still seeing:
Where HTF buy/sell volume is dominant
Which HTF candles left inefficiencies that may later act as magnets or rejection zones
The exact HTF O/H/L/C levels currently active
How much time remains before the HTF bar closes (key for timing entries around closes).
Swing traders can use it to track daily and weekly HTF structure and delta while drilling down to lower timeframes for precise execution.
Atif's Liquidity Toolkit💎 GENERAL OVERVIEW:
Atif’s Liquidity Toolkit is a price-action-based indicator used to identify Buyside & Sellside Liquidity Levels, Liquidity Sweeps, FVG Sweeps, and Buy/Sell signals, following specific rules from Atif Hussain.
This indicator was developed by Flux Charts in collaboration with Atif Hussain.
🔹Purpose of this indicator:
The purpose of Atif’s Liquidity Toolkit is to help traders understand where liquidity is forming, when it’s being taken, and how momentum shifts immediately afterward. It automates the entire process of identifying buyside & sellside liquidity, detecting liquidity sweeps, and confirming whether displacement followed through a Fair Value Gap. The goal is to give traders a consistent, rule-based framework to interpret market structure.
🎯ATIF’S LIQUIDITY TOOLKIT FEATURES:
Atif’s Liquidity Toolkit indicator includes 6 main features:
Fair Value Gaps
Multi-Timeframe Liquidity Levels
Liquidity Sweeps
Fair Value Gap Sweeps
Buy & Sell Signals with Take-Profit & Stop-Loss Levels
Alerts
1️⃣Fair Value Gaps
🔹What is a Fair Value Gap?:
A Fair Value Gap (FVG) is an area where the market’s perception of fair value suddenly changes. On your chart, it appears as a three-candle pattern: a large candle in the middle, with smaller candles on each side that don’t fully overlap it. A bullish FVG forms when a bullish candle is between two smaller bullish/bearish candles, where the first and third candles’ wicks don’t overlap each other at all. A bearish FVG forms when a bearish candle is between two smaller bullish/bearish candles, where the first and third candles’ wicks don’t overlap each other at all.
Bullish & Bearish FVGs:
In the settings, you can toggle on/off FVGs, choose the invalidation method, adjust the sensitivity, and toggle on FVG Midline & Labels.
🔹Invalidation Method:
The Invalidation Method setting allows traders to choose how an FVG is invalidated. You can choose between Close and Wick.
Close: A candle must close below a bullish FVG or above a bearish FVG to invalidate it.
Wick: A candle’s wick must go below a bullish FVG or above a bearish FVG to invalidate it.
🔹Sensitivity:
The sensitivity setting determines the minimum gap size required for an FVG detection. A higher sensitivity will filter out smaller gaps, while a lower sensitivity will detect more frequent, smaller gaps. Setting the sensitivity to 0 will display all gaps, regardless of their size.
On the left, the sensitivity is 5. On the right, the sensitivity is 0.
🔹Midline:
When enabled, a dashed line is drawn at the center of the FVG.
🔹Labels:
When enabled, a text label will be plotted with the gap, clearly identifying the zone as a FVG.
2️⃣ Multi-Timeframe Liquidity Levels
The indicator automatically detects and plots Buyside Liquidity (BSL) & Sellside Liquidity (SSL) Levels across up to three timeframes simultaneously.
🔹What is Buyside Liquidity?
Buyside Liquidity (BSL) represents price levels where many buy stop orders are sitting, usually from traders holding short positions. When price moves into these areas, those stop-loss orders get triggered and short sellers are forced to buy back their positions. These zones often form above key highs such as the previous day, week, or month. Understanding BSL is important because when price reaches these levels, the sudden wave of buy orders can create sharp reactions or reversals as liquidity is taken from the market.
🔹What is Sellside Liquidity?
Sellside Liquidity (SSL) represents price levels where many sell stop orders are waiting, usually from traders holding long positions. When price drops into these areas, those stop-loss orders are triggered and long traders are forced to sell their positions. These zones often form below key lows such as the previous day, week, or month. Understanding SSL is important because when price reaches these levels, the surge of sell orders can cause sharp reactions or reversals as liquidity is taken from the market.
Atif’s Liquidity Toolkit indicator automatically plots Buyside & Sellside Liquidity levels using the following levels:
Previous Day High (PDH) & Previous Day Low (PDL)
Previous Week High (PWH) & Previous Week Low (PWL)
Previous Month High (PMH) & Previous Month Low (PML)
Asia Session Highs/Lows
London Session Highs/Lows
New York Session Highs/Lows
The session start and end times are not customizable. The following times in EST are used for each session:
Asia Session: 20:00-00:00
London Session: 02:00-05:00
New York Sessions:
NY AM: 09:30-11:00
NY Lunch: 12:00-13:00
NY PM: 14:00-16:00
Users can also plot swing highs/lows using a lookback period and choosing the higher timeframe. Users can choose two custom higher timeframes and also enable swing highs/lows from the current chart’s timeframe.
There are three settings to customize for the current chart’s timeframe and higher timeframes:
Current TF - when toggled on, swing highs/lows will be plotted from the chart’s timeframe using the pivot length input
HTF 1 - when toggled on, swing highs/lows will be plotted from the user-inputted timeframe using the pivot length input
HTF 2 - when toggled on, swing highs/lows will be plotted from the user-inputted timeframe using the pivot length input
The Pivot Length controls how far back the indicator checks to confirm whether a candle’s high or low is a true swing point (also called a “pivot”). When detecting a swing high, the indicator checks if that candle’s high is higher than the highs of the previous X candles and the next X candles. For a swing low, it checks if the candle’s low is lower than the lows of the previous X candles and the next X candles. The number X comes from your Pivot Length setting.
A lower Pivot Length input (for example, 3 or 4) means the indicator only looks at a few candles on each side, so it will detect more swing points, including smaller, less significant ones. A higher Pivot Length input (for example, 20 or 25) makes the indicator look at more candles on each side, so it only marks major turning points that stand out clearly on the chart.
In short:
Low Pivot Length = more frequent, smaller levels (short-term focus)
High Pivot Length = fewer, stronger levels (major swing focus)
The Pivot Length input for each setting (Current TF, HTF 1, and HTF 2) are displayed below in the red boxes:
Each liquidity level is plotted with a text label, making it easy to identify where a level came from. You can turn off the ‘Show Levels’ setting if you don’t want to see the levels on your chart.
Please note: Liquidity Levels play a key role in finding liquidity sweeps, FVG Sweeps, and Buy/Sell signals. Keeping the levels turned off will not stop the indicator from using the levels that are enabled from being used for the other features mentioned.
3️⃣Liquidity Sweeps:
The indicator automatically detects bullish and bearish liquidity sweeps using the liquidity levels you have enabled.
🔹What is a Liquidity Sweep?
A liquidity sweep is a market phenomenon where significant players, such as institutional traders, deliberately drive prices through key levels to trigger clusters of pending buy or sell orders. It’s how the market gathers the liquidity needed for larger participants to enter positions.
Traders often place stop-loss orders around obvious highs and lows, such as the previous day’s, week’s, or month’s levels. When price pushes through one of these areas, it triggers the stops placed there and generates a burst of volume. This often creates a short-term fake-out before the market reverses in the opposite direction.
By detecting these sweeps in real time, traders can identify potential reversal areas or “trap” areas where liquidity has been taken.
🔹Bullish Liquidity Sweep
These occur when price dips below a Sellside Liquidity (SSL) level, taking out the stop-loss orders placed by long traders below that low. The indicator marks a zone around the candle that swept the SSL to highlight where liquidity was removed from the market.
When this happens, it shows that the market just cleared out sell-side liquidity, meaning traders who were long had their stops hit. This is often followed by a reversal or strong reaction upward, because the market no longer has pending liquidity to fill below that level.
🔹Bearish Liquidity Sweep
These occur when price dips above a Buyside Liquidity (BSL) level, taking out the stop-loss orders placed by short seller traders above that high. The indicator marks a zone around the candle that swept the BSL to highlight where liquidity was removed from the market.
When this happens, it shows that the market just cleared out buyside liquidity, meaning short traders had their stops hit. This is often followed by a reversal or strong reaction downward, because the market no longer has pending liquidity to fill above that level.
Under the ‘Liquidity Sweeps’ section in the settings, you can toggle on/off Bullish Regular Sweeps and Bearish Regular Sweeps. You can also customize the line style and color of liquidity levels that have been swept.
🔹How to Use Liquidity Sweeps
Liquidity sweeps are not direct trade signals. They are best used as context when forming a directional bias. A sweep shows that the market has removed liquidity from one side, which can hint at where the next move may develop.
For example:
When Buyside Liquidity (BSL) is swept, it often signals that buy stops have been triggered and the market may be preparing to move lower. Traders may then begin looking for short opportunities.
When Sellside Liquidity (SSL) is swept, it often signals that sell stops have been triggered and the market may be preparing to move higher. Traders may then begin looking for long opportunities.
It’s common practice to use liquidity sweeps as the first step in building a trade idea. Many traders will wait for additional confirmation, such as a fair value gap forming after the sweep, before opening a position.
Under the ‘Liquidity Sweeps’ section in the settings, you can toggle on/off:
Bullish Regular Sweeps - when disabled, Bullish Regular Sweeps won’t appear on your chart.
Bearish Regular Sweeps - when disabled, Bearish Regular Sweeps won’t appear on your chart.
4️⃣Fair Value Gap Sweeps:
The indicator automatically detects bullish and bearish Fair Value Gap sweeps (FVG Sweep) using the liquidity levels you have enabled.
🔹What is a FVG Sweep?
A FVG Sweep is a specific type of liquidity sweep that not only clears liquidity above or below a key level, but also forms a Fair Value Gap (FVG) immediately afterward.
The liquidity sweep shows where stop orders were triggered, areas where the market aggressively took out one side’s liquidity. The formation of a Fair Value Gap right after the sweep confirms that displacement followed. This means that the sweep was not just a stop hunt, but a deliberate move backed by momentum.
In simple terms, a regular liquidity sweep only tells you that liquidity was taken. A FVG Sweep tells you that liquidity was taken and a strong directional move started immediately after, leaving an imbalance in price. That imbalance represents where aggressive buyers or sellers entered the market without enough opposite-side orders to keep price balanced. This combination adds a confirmation and intent behind regular liquidity sweeps.
🔹Bullish FVG Sweep
The indicator automatically detects bullish FVG Sweeps when price takes out a Sellside Liquidity (SSL) level and then forms a bullish FVG within the next few candles. This sequence shows that sellers were stopped out and buyers immediately entered the market with momentum.
🔹Bearish FVG Sweep
The indicator automatically detects bearish FVG Sweeps when price takes out a Buyside Liquidity (BSL) level and then forms a bearish FVG shortly after. This shows that short sellers’ stops were triggered, and new selling pressure entered the market right away.
🔹How to Use FVG Sweeps
Unlike regular liquidity sweeps, FVG Sweeps can be used as trade entries because they confirm both liquidity being cleared and immediate momentum. A regular sweep only shows that stop-losses were triggered, but an FVG Sweep proves that price not only cleared liquidity but also moved away with momentum, leaving behind an imbalance (Fair Value Gap). This shift often marks the start of a new short-term trend.
We’ll cover this in more detail in the Buy and Sell Signal section below, but in short, a bullish FVG Sweep can act as confirmation for a potential long entry after price takes out a low, while a bearish FVG Sweep can confirm a short entry after price takes out a high.
The strongest FVG Sweeps come from extremely sharp reversals. On the chart, they look like a “V” shape for bullish setups or an inverted “V” shape for bearish setups. This shape shows how quickly momentum shifted after liquidity was cleared. When price instantly reverses and leaves a Fair Value Gap behind, it’s a clear sign that buyers or sellers stepped in aggressively and absorbed all available liquidity on the opposite side.
In practice, traders often use FVG Sweeps as a trigger to align their bias. For example, after a bullish FVG Sweep, the focus shifts toward looking for long setups within the new imbalance or during a small retracement into the Fair Value Gap. After a bearish FVG Sweep, traders focus on short setups as price retraces back into the gap before continuing lower. The key takeaway is that FVG Sweeps show conviction.
Under the ‘Liquidity Sweeps’ section in the settings, you can toggle on/off:
Bullish FVG Sweeps - when disabled, Bullish FVG Sweeps won’t appear on your chart.
Bearish FVG Sweeps - when disabled, Bearish FVG Sweeps won’t appear on your chart.
Please Note: the settings you choose to use for Fair Value Gaps, under the ‘Fair Value Gaps’ section, will be used for FVG Sweeps. This is important because if you increase the sensitivity value for FVGs, not all FVG Sweeps will appear if the FVG’s size doesn’t meet the sensitivity threshold.
5️⃣Buy & Sell Signals:
This indicator also plots Buy & Sell signals. These signals follow logic based on Atif Hussain’s FVG trading model. The entry requirements for a Long & Short signal are outlined below.
🔹Buy Signal:
In order for a Buy Signal to generate, the following conditions must occur in order:
Bullish FVG Sweep
Price Retraces to the Bullish FVG
🔹Sell Signal:
In order for a Buy Signal to generate, the following conditions must occur in order:
Bearish FVG Sweep
Price Retraces to the FVG
🔹Require Retracement:
Under the ‘Signals’ section in the settings, you can toggle on/off the ‘Require Retracement’ setting. When disabled, a long/short signal will appear immediately after a Bullish or Bearish FVG Sweep, instead of waiting for price to retrace back to the gap.
Please Note: the liquidity levels you enable under the ‘Liquidity Levels’ section will be the levels used for signals. Thus, if you only have the Previous Day Highs/Lows enabled, then only those levels will be used to generate buy/sell signals. Also, long Signals will only appear if Bullish FVG Sweeps are enabled, and Short Signals will only appear if Bearish FVG Sweeps are enabled.
When a Buy Signal or Sell Signal is plotted, three suggested take-profit levels and one suggested stop-loss level are plotted. There are two different Take-Profit methods you can choose from within the indicator settings: Manual or Auto.
🔹Manual Take-Profit:
If you’re using manual take-profit levels, you can customize the Risk-to-Reward (RR) for Take-Profit 1, 2, and 3 by adjusting the “RR 1”, “RR 2”, and “RR 3” settings. Setting RR 1 to 1 means take-profit 1 is a 1:1 risk-to-reward ratio. The stop-loss will always be placed at the recent low for Buy Signals, and at the recent high for Sell Signals.
🔹Auto Take-Profit:
If you select to use Auto Take-Profit instead of Manual, then Take-Profit 1, 2, and 3 will be automatically determined based on nearby liquidity levels. The stop-loss will be placed at the recent low for Buy Signals, and at the recent high for Sell Signals. Take-Profit Levels 1, 2, and 3 will be placed at the three closest opposite liquidity levels. If the take-profit 2 and take-profit 3 levels are too far away, only one take-profit level will be displayed.
🔹Signal Settings:
Long Signals:
When enabled, long signals are shown. When disabled, long signals will not appear.
Short Signals:
When enabled, short signals are shown. When disabled, short signals will not appear.
Require Retracement:
When enabled, price must retrace to a FVG after a FVG Sweep in order for a signal to be generated.
Take-Profit Levels:
When enabled, take-profit levels (TP 1, TP 2, and TP 3) are shown with long/short signals. When disabled, take-profit levels and their price labels are not displayed.
Take-Profit Labels:
When enabled, take-profit labels are displayed when price reaches one of the three take-profit levels. When disabled, labels won’t appear when price reaches take-profit levels.
Stop-Loss Levels:
When enabled, stop-loss levels are shown for long/short signals. When disabled, the stop-loss level and its price label are not displayed.
Stop-Loss Labels:
When enabled, stop-loss levels are shown for long/short signals. When disabled, a label won’t appear when price reaches the stop-loss level.
6️⃣Alerts:
The indicator supports alerts, so you never miss a key market move. You can choose to receive alerts for each of the following conditions:
Bearish Liquidity Sweep
Bullish Liquidity Sweep
Bearish FVG Sweep
Bullish FVG Sweep
Long Signal
Short Signal
TP 1
TP 2
TP 3
Stop-Loss
‼️Important Notes:
TradingView has limitations when running features on multiple timeframes, such as the liquidity levels, which can result in the following error:
🔹Computation Error:
The computation of using MTF features are very intensive on TradingView. This can sometimes cause calculation timeouts. When this occurs, simply force the recalculation by modifying one indicator’s settings or by removing the indicator and adding it to your chart again.
🚩 UNIQUENESS:
This indicator is unique because it identifies a specific type of liquidity event referred to as FVG Sweeps, where price takes liquidity and then immediately forms a Fair Value Gap in the opposite direction. These FVG Sweeps serve as the foundation of the model, and the script uses them as the required condition for generating Buy and Sell signals. Once an FVG Sweep is confirmed, the indicator automatically produces a fully defined trade idea with a stop-loss and up to three take-profit targets, following a consistent rule-based execution approach.

FVG Strategy with One Trade Per Hour and Tick-based TP/SLThis strategy hunts for Fair Value Gaps (FVGs)—three-bar displacement gaps that mark imbalances where price moved so fast it left a “void.” It detects bullish (green) and bearish (red) FVGs on the chart timeframe or a higher timeframe you choose via the Timeframe input. Each detected zone is stored and optionally drawn as a box (static or “dynamic” that tightens with price). A simple threshold lets you filter out tiny gaps: either set a fixed percent (Threshold %) or let the script estimate it automatically. As price trades later, the engine watches for interaction with any stored zone.
Entries are taken on a touch/retest of the zone: buy when price intersects a green (bullish) FVG; short when it intersects a red (bearish) FVG. Risk management is manual and straightforward—your stop loss and take profit are set in ticks, placed off the signal bar’s close. To avoid over-trading, there’s a cap of one trade per hour (it resets when the clock hour changes). In short, it’s an intraday “gap fill / bounce” system: identify an imbalance, wait for price to revisit it, and take a directional trade with fixed tick targets and stops.

Quantura - Quantified Price Action StrategyIntroduction
“Quantura – Quantified Price Action Strategy” is an invite-only Pine Script strategy designed to combine multiple price action concepts into a single trading framework. It integrates supply and demand zones, liquidity sweeps and runs, fair value gaps (FVGs), RSI filters, and EMA trend confirmation. The strategy also provides a visual overlay with dynamic trend-colored candles for easier chart interpretation. It is intended for multi-market use across cryptocurrencies, Forex, equities, and indices.
Originality & Value
The strategy is original in how it unifies several institutional-style price action elements and validates trades only when they align. This reduces noise compared to using single indicators in isolation. Its unique value lies in the combination of:
Supply & Demand detection: Dynamic boxes identified through pivots, ATR, and volume sensitivity.
Liquidity sweeps and runs: Detects when swing highs/lows are broken and retested, distinguishing between liquidity grabs (sweeps) and directional runs.
RSI filter: Can be set to normal or aggressive, confirming momentum before trades.
Fair Value Gaps (FVGs): Optional detection and filtering of price inefficiencies.
EMA filter: Aligns trades with the broader market trend.
Trend candle visualization: Candles dynamically colored bullish, bearish, or neutral, based on strategy positions.
This layered confluence approach ensures that entries are not taken on a single condition but require agreement across several dimensions of market structure, momentum, and order flow.
Functionality & Indicators
Supply & Demand Zones: Zones are created when pivots, ATR sensitivity, and volume thresholds overlap.
Liquidity: Swing highs and lows are tracked, with options for sweep (fakeout/reversal) or run (continuation) detection.
RSI: Confirms long signals when oversold and shorts when overbought, with configurable aggressiveness.
FVG filter: Adds validation by requiring price interaction with inefficiency zones.
EMA filter: Ensures longs are above EMA and shorts below EMA.
Signals & Visualization: Trade entries are marked on the chart, while candles change color to reflect trade direction and status.
Parameters & Customization
Supply & Demand: Sensitivity (swing range, volume multiplier, ATR multiplier) and display options.
Liquidity filter: Mode (Run or Sweep), display, and swing length.
RSI: Enable/disable, length, and style (normal or aggressive).
Fair Value Gaps: Sensitivity via ATR factor, optional volume filter, and display toggles.
EMA: Length, enable/disable, and visualization.
Risk management: Up to three configurable take-profit levels, stop-loss, break-even logic, and capital-based position sizing.
Visualization: Custom candle coloring and optional overlay for better clarity.
Default Properties (Strategy Settings)
Initial Capital: 10,000 USD
Position Size: 100% of equity per trade (backtest default)
Commission: 0.1%
Slippage: 1
Pyramiding: 0 (only one position at a time)
Note: The default of 100% equity per trade is used for testing purposes only and would not be sustainable in real trading. A typical allocation in practice would be between 1–5% of account equity per trade, sometimes up to 10%.
Backtesting & Performance
Backtests on XPTUSD over 2.5 years with the default settings produced:
164 trades
67.68% win rate
Profit factor: 1.7
Maximum drawdown: 27.81%
These results show how the confluence of supply/demand, liquidity, and RSI filters can produce robust setups. However, past performance does not guarantee future results. While the trade count (164) is sufficient for statistical analysis, results may vary across markets and timeframes.
Risk Management
Three configurable take-profit levels with percentage allocation.
Initial stop-loss based on user-defined percentage.
Dynamic stop-loss that adjusts with market movement.
Break-even logic that shifts stops to entry after predefined gains.
Position sizing based on risk percentage of equity.
This framework allows both conservative and aggressive configurations, depending on user preference.
Limitations & Market Conditions
Works best in volatile and liquid markets such as crypto, metals, indices, and FX.
May produce false signals in low-volume or sideways environments.
Unexpected news or macro events can override technical conditions.
Default position sizing of 100% equity is highly aggressive and should be reduced before any practical use.
Usage Guide
Add “Quantura – Quantified Price Action Strategy” to your chart.
Select Supply & Demand, Liquidity, RSI, EMA, and FVG settings according to your market and timeframe.
Configure risk management: take-profits, stop-loss, and risk-per-trade percentage.
Use the Strategy Tester to analyze statistics, equity curve, and performance under different conditions.
Optimize parameters before applying the strategy to different markets.
Author & Access
Developed 100% by Quantura. Published as an Invite-Only script.
Important
This description complies with TradingView’s publishing rules. It clarifies originality, explains the underlying logic, discloses default properties, and presents backtest results with realistic disclaimers.

Synapse Dynamics - Market Structure📊 SYNAPSE DYNAMICS - MARKET STRUCTURE INDICATOR
An educational tool for learning and practicing Smart Money Concepts (SMC) methodology through visual representation of institutional price action patterns.
═══════════════════════════════════════════════════
🎯 WHAT THIS INDICATOR DISPLAYS
This indicator visualizes Smart Money Concepts patterns on your chart:
- Order Blocks (OB) - Supply and demand zones based on institutional order flow theory. The indicator identifies these areas using price action criteria including the final opposing candle before a strong directional move.
- Breaker Blocks - Failed order blocks that may act as support/resistance. These occur when an order block is invalidated but price returns to the zone, potentially reversing its role.
- Fair Value Gaps (FVG) - Three-candle imbalance patterns where price gaps create inefficiencies. The indicator marks these zones for reference in analysis.
- Market Structure - Break of Structure (BOS) and Change of Character (CHoCH) patterns based on swing high/low breaks. These help identify potential trend continuation or reversal points.
- Reference Entry Signals - The indicator calculates potential entry zones with accompanying stop loss and take profit reference levels based on order block and FVG locations. These are for educational reference only.
- Higher Timeframe Context - Optional filter that displays the higher timeframe trend direction to provide additional market context.
- Information Panel - On-screen dashboard showing active reference signals, their status, and relevant price levels.
- Swing Point Mapping - Labels recent higher highs (HH), higher lows (HL), lower highs (LH), and lower lows (LL) based on configurable swing detection parameters.
═══════════════════════════════════════════════════
⚙️ HOW IT WORKS
The indicator uses the following methodology:
**Order Block Detection:** Identifies the last opposing candle before a strong directional move that breaks structure. Filters blocks by size to reduce noise.
**Market Structure Analysis:** Tracks swing points and identifies when price breaks previous highs/lows to determine BOS or CHoCH patterns.
**Fair Value Gap Identification:** Detects three-candle patterns where candle 1's high/low doesn't overlap with candle 3's low/high, creating an imbalance zone.
**Reference Signal Generation:** Combines order block proximity, FVG presence, and market structure breaks to suggest potential study areas. Optional HTF trend filter can be enabled.
**Timeframe Adaptation:** Automatically adjusts swing detection sensitivity based on the chart timeframe (using multipliers for intraday vs. higher timeframes).
═══════════════════════════════════════════════════
📚 EDUCATIONAL PURPOSE & IMPORTANT LIMITATIONS
**This indicator is designed as an educational tool for:**
- Learning Smart Money Concepts methodology
- Practicing pattern recognition
- Understanding institutional price action theories
- Analyzing market structure visually
**Critical Understanding:**
- All signals and levels are REFERENCE POINTS for study - not trading recommendations
- The indicator displays patterns based on historical price action - it cannot predict future movements
- Smart Money Concepts is a theoretical framework - market behavior varies
- Backtested or historical results shown do not guarantee future performance
- No indicator can account for all market variables, news events, or changing conditions
**Proper Use:**
This tool is meant to assist in learning technical analysis concepts. Users must develop their own analysis skills, risk management strategies, and trading plans. The displayed patterns require interpretation within broader market context.
═══════════════════════════════════════════════════
⚙️ CUSTOMIZATION OPTIONS
**Adjustable Parameters:**
- Order Block: Minimum size threshold, maximum count displayed
- Fair Value Gaps: Toggle visibility, maximum count
- Market Structure: Swing detection length, BOS/CHoCH display
- Signals: Entry/SL/TP calculation method, HTF filter toggle
- Visual Settings: Colors, line styles, label sizes, panel position
**Timeframe Compatibility:**
Works on all timeframes from 1-minute to monthly charts. The swing detection automatically scales based on timeframe.
═══════════════════════════════════════════════════
⚠️ DISCLAIMER
This indicator is for educational and informational purposes only. It does not constitute financial advice or trading recommendations. Trading involves substantial risk of loss. Past patterns and historical analysis do not indicate future results. Users are responsible for their own trading decisions and risk management. The author assumes no liability for trading losses.
═══════════════════════════════════════════════════
🔧 ALERT FUNCTIONALITY
Built-in alert conditions notify you when:
- New order blocks are detected
- Market structure changes occur (BOS/CHoCH)
- Reference entry signals appear
Configure alerts through TradingView's alert system.

ICT Institutional Order Flow (Riz)This indicator implements Inner Circle Trader (ICT) institutional order flow concepts to identify high-probability entry points where smart money is actively participating in the market. It combines volume analysis, market structure, and price action patterns to detect institutional accumulation and distribution zones.
Core Concepts & Methodology
1. Institutional Order Blocks Detection
Order blocks represent the last opposing candle before a strong directional move, indicating institutional accumulation (bullish) or distribution (bearish) zones.
How it works:
⦁ Identifies the final bearish candle before bullish expansion (accumulation)
⦁ Identifies the final bullish candle before bearish expansion (distribution)
⦁ Validates with volume spike (2x average) to confirm institutional participation
⦁ Requires minimum 0.5% price displacement to filter weak moves
⦁ Tracks these zones as future support/resistance levels
2. Fair Value Gap (FVG) Analysis
FVGs are price inefficiencies created by aggressive institutional orders that leave gaps in price action.
Detection method:
⦁ Bullish FVG: When current low > high from 2 bars ago
⦁ Bearish FVG: When current high < low from 2 bars ago
⦁ Minimum gap size filter (0.1% default) eliminates noise
⦁ Monitors gap fills with volume for entry signals
⦁ Gaps act as magnets drawing price back for "rebalancing"
3. Liquidity Hunt Detection
Institutions often trigger retail stop losses before reversing direction, creating liquidity for their positions.
Algorithm:
⦁ Calculates rolling 20-period highs/lows as liquidity pools
⦁ Detects wicks beyond these levels (0.1% sensitivity)
⦁ Identifies rejection back inside range (liquidity grab)
⦁ Volume spike confirmation ensures institutional involvement
⦁ These reversals often mark significant turning points
4. Volume Profile Integration
Analyzes volume distribution across price levels to identify institutional interest zones.
Components:
⦁ Point of Control (POC): Price level with highest volume (institutional consensus)
⦁ Value Area: 70% of volume range (institutional comfort zone)
⦁ Uses 50-bar lookback to build volume histogram
⦁ 20 price levels for granular distribution analysis
5. Market Structure Analysis
Determines overall trend bias using pivot points and swing analysis.
Process:
⦁ Identifies swing highs/lows using 3-bar pivots
⦁ Bullish structure: Price above last swing high
⦁ Bearish structure: Price below last swing high
⦁ Filters signals to trade with institutional direction
Signal Generation Logic
BUY signals trigger when ANY condition is met:
1. Order Block Formation: Bearish-to-bullish transition + volume spike + strong move
2. Liquidity Grab Reversal: Sweep below lows + recovery + volume spike
3. FVG Fill: Price fills bullish gap with institutional volume (within 3 bars)
4. Order Block Respect: Price bounces from previous bullish OB + volume
SELL signals trigger when ANY condition is met:
1. Order Block Formation: Bullish-to-bearish transition + volume spike + strong move
2. Liquidity Grab Reversal: Sweep above highs + rejection + volume spike
3. FVG Fill: Price fills bearish gap with institutional volume (within 3 bars)
4. Order Block Respect: Price rejects from previous bearish OB + volume
Additional filters:
⦁ Signals align with market structure (no counter-trend trades)
⦁ No new signals while position is active
⦁ All signals require volume confirmation (institutional fingerprint)
Trading Style Auto-Configuration
The indicator features intelligent preset configurations for different trading styles:
Scalping Mode (1-5 min charts):
⦁ Volume multiplier: 1.5x (more signals)
⦁ Tighter parameters for quick trades
⦁ Risk:Reward 1.5:1, ATR multiplier 1.0
Day Trading Mode (15-30 min charts):
⦁ Volume multiplier: 1.7x (balanced)
⦁ Medium sensitivity settings
⦁ Risk:Reward 2:1, ATR multiplier 1.5
Swing Trading Mode (1H-4H charts):
⦁ Volume multiplier: 2.0x (quality focus)
⦁ Conservative parameters
⦁ Risk:Reward 3:1, ATR multiplier 2.0
Custom Mode:
⦁ Full manual control of all parameters
Visual Components
⦁ Order Blocks: Colored rectangles (green=bullish, red=bearish)
⦁ Fair Value Gaps: Orange boxes showing imbalances
⦁ Liquidity Levels: Dashed blue lines at key highs/lows
⦁ Volume Spikes: Yellow background highlighting
⦁ POC Line: Orange line showing highest volume price
⦁ Value Area: Blue shaded zone of 70% volume
⦁ Buy/Sell Signals: Triangle markers with text labels
⦁ Stop Loss/Take Profit: Dotted lines (red/green)
Information Panel
Real-time dashboard displaying:
⦁ Current trading mode
⦁ Volume ratio (current vs average)
⦁ Market structure (bullish/bearish)
⦁ Active order blocks count
⦁ Position status
⦁ Configuration details
How to Use
Step 1: Select Trading Style
Choose your style in settings - all parameters auto-adjust
Step 2: Timeframe Selection
⦁ Scalping: 1-5 minute charts
⦁ Day Trading: 15-30 minute charts
⦁ Swing: 1H-4H charts
Step 3: Signal Interpretation
⦁ Wait for BUY/SELL markers
⦁ Check volume ratio >2 for strong signals
⦁ Verify market structure alignment
⦁ Note automatic SL/TP levels
Step 4: Risk Management
⦁ Default 2:1 risk:reward (adjustable)
⦁ Stop loss: 1.5x ATR from entry
⦁ Position sizing based on stop distance
Best Practices
1. Higher probability setups occur when multiple conditions align
2. Volume confirmation is crucial - avoid signals without volume spikes
3. Trade with structure - longs in bullish, shorts in bearish structure
4. Monitor POC - acts as dynamic support/resistance
5. Confluence zones where OBs, FVGs, and liquidity levels overlap are strongest
Important Notes
⦁ Not a standalone system - combine with your analysis
⦁ Works best in trending markets with clear structure
⦁ Adjust settings based on instrument volatility
⦁ Backtest thoroughly on your specific markets
⦁ Past performance doesn't guarantee future results
Alerts Available
⦁ ICT Buy Signal
⦁ ICT Sell Signal
⦁ Volume Spike Detection
⦁ Liquidity Grab Detection
This indicator provides a systematic approach to ICT concepts, helping traders identify where institutions are entering positions through volume analysis and key price action patterns. The auto-configuration feature ensures optimal settings for your trading style without manual adjustment.
Disclaimer
This tool is for educational and research purposes only. It is not financial advice, nor does it guarantee profitability. All trading involves risk, and users should test thoroughly before applying live.

Market Imbalance Tracker (Inefficient Candle + FVG)# 📊 Overview
This indicator combines two imbalance concepts:
• **Squared Up Points (SUP)** – midpoints of large, "inefficient" candles that often attract price back.
• **Fair Value Gaps (FVG)** – 3-candle gaps created by strong impulse moves that often get "filled."
Use them separately or together. Confluence between a SUP line and an FVG boundary/midpoint is high-value.
---
# ⚡ Quick Start (2 minutes)
1. **Add to chart** → keep defaults (Percentile method, 80th percentile, 100-bar lookback).
2. **Watch** for dashed SUP lines to print after large candles.
3. **Toggle Show FVG** → see green/red boxes where gaps exist.
4. **Turn on alerts** → New SUP created, SUP touched, New FVG.
5. **Trade the reaction** → look for confluence (SUP + FVG + S/R), then manage risk.
---
# 🛠 Features
## 🔹 Squared Up Points (SUP)
• **Purpose:** Midpoint of a large candle → potential support/resistance magnet.
• **Detection:** Choose *Percentile* (adaptive) or *ATR Multiple* (absolute).
• **Validation:** Only plots if the preceding candle does not touch the midpoint (with tolerance).
• **Lifecycle:** Line auto-extends into the future; it's removed when touched or aged out.
• **Visual:** Horizontal dashed line (color/width configurable; style fixed to dashed if not exposed).
## 🔹 Fair Value Gaps (FVG)
• **Purpose:** 3-candle gaps from an impulse; price often revisits to "fill."
• **Detection:** Requires a strong directional candle (Marubozu threshold) creating a gap.
• **Types:**
- **Bullish FVG (Green):** Gap below; expectation is downward fill.
- **Bearish FVG (Red):** Gap above; expectation is upward fill.
• **Close Rules (if implemented):**
- *Full Fill:* Gap closes when the opposite boundary is tagged.
- *Midpoint Fill:* Gap closes when its midpoint is tagged.
• **Visual:** Colored boxes; optional split-coloring to emphasize the midpoint.
> **Note:** If a listed FVG option isn't visible in Inputs, you're on a lighter build; use the available switches.
---
# ⚙️ Settings
## SUP Settings
• **Candle Size Method:** Percentile (top X% of recent ranges) or ATR Multiple.
• **Candle Size Percentile:** e.g., 80 → top 20% largest candles.
• **ATR Multiple & Period:** e.g., 1.5 × ATR(14).
• **Percentile Lookback:** Bars used to compute percentile.
• **Lookback Period:** How long SUP lines remain eligible before auto-cleanup.
• **Touch Tolerance (%):** Buffer based on the inefficient candle's range (0% = exact touch).
## Line Appearance
• **Line Color / Width:** Customizable.
• **Style:** Dashed (fixed unless you expose a style input).
## FVG Settings (if present in your build)
• **Show FVG:** On/Off.
• **Close Method:** Full Fill or Midpoint.
• **Marubozu Wick Tolerance:** Max wick % of the impulse bar.
• **Use Split Coloring:** Two-tone box halves around midpoint.
• **Colors:** Bullish/Bearish, and upper/lower halves (if split).
• **Max FVG Age:** Auto-remove older gaps.
---
# 📈 How to Use
## Trading Applications
• **SUP Lines:** Expect reaction on first touch; use as S/R or profit-taking magnets.
• **FVG Fills:** Price frequently tags the midpoint/boundary before continuing.
• **Confluence:** SUP at an FVG midpoint/boundary + higher-timeframe S/R = higher quality.
• **Bias:** Clusters of unfilled FVGs can hint at path of least resistance.
## Best Practices
• **Timeframe:** HTFs for swing levels, LTFs for execution.
• **Volume:** High volume at level = stronger signal.
• **Context:** Trade with broader trend or at least avoid counter-trend without confirmation.
• **Risk:** Always pre-define invalidation; structures fail in chop.
---
# 🔔 Alerts
• **New SUP Created** – When a qualifying inefficient candle prints a SUP midpoint.
• **SUP Touched/Invalidated** – When price touches within tolerance.
• **New FVG Detected** – When a valid gap forms per your rules.
> **Tip:** Set alerts *Once Per Bar Close* on HTFs; *Once* on LTFs to avoid noise.
---
# 🧑💻 Technical Notes
• **Percentile vs ATR:** Percentile adapts to volatility; ATR gives consistency for backtesting.
• **FVG Direction Logic:** Gap above price = bearish (expect up-fill); below = bullish (expect down-fill).
• **Performance:** Limits on lines/boxes and auto-aging keep things snappy.
---
# ⚠️ Limitations
• Imbalances are **context tools**, not signals by themselves.
• Works best with trend or clear impulses; expect noise in narrow ranges.
• Lower-timeframe gaps can be plentiful and lower quality.
---
# 📌 Version & Requirements
• **Pine Script v6**
• Heavy drawings may require **TradingView Pro** or higher (object limits).
---
*For best results, combine with your existing trading strategy and proper risk management.*

RTH Levels: VWAP + PDH/PDL + ONH/ONL + IBAlgo Index — Levels Pro (ONH/ONL • PDH/PDL • VWAP±Bands • IB • Gaps)
Purpose. A session-aware, non-repainting levels tool for intraday decision-making. Designed for futures and indices, with clean visuals, alerts, and a one-click Minimal Mode for screenshot-ready charts.
What it plots
• PDH/PDL (RTH-only) – Prior Regular Trading Hours high/low, computed intraday and frozen at the RTH close (no 24h mix-ups, no repainting).
• ONH/ONL – Prior Overnight high/low, held throughout RTH.
• RTH VWAP with ±σ bands – Volume-weighted variance, reset each RTH.
• Initial Balance (IB) – First N minutes of RTH, plus 1.5× / 2.0× extensions after IB completes.
• Today’s RTH Open & Prior RTH Close – With gap detection and “gap filled” alert.
• Killzone shading – NY Open (09:30–10:30 ET) and Lunch (11:15–13:30 ET).
• Values panel (top-right) – Each level with live distance in points & ticks.
• Right-edge level tags – With anti-overlap (stagger + vertical jitter).
• Price-scale tags – Native trackprice markers that always “stick” to the axis.
⸻
New in v6.4
• Minimal Mode: one click for a clean look (thinner lines, VWAP bands/IB extensions hidden, on-chart right-edge labels off; price-scale tags remain).
• Theme presets: Dark Hi-Contrast / Light Minimal / Futures Classic / Muted Dark.
• Anti-overlap controls: horizontal staggering, vertical jitter, and baseline offset to keep tags readable even when levels cluster.
⸻
Quick start (2 minutes)
1. Add to chart → keep defaults.
2. Sessions (ET):
• RTH Session default: 09:30–16:00 (US equities cash hours).
• Overnight Session default: 18:00–09:29.
Adjust for your market if you use different “day” hours (e.g., many use 08:20–13:30 ET for COMEX Gold).
3. Theme & Minimal Mode: pick a Theme Preset; enable Minimal Mode for screenshots.
4. Visibility: toggle PD/ON/VWAP/IB/References/Panel to taste.
5. Right-edge labels: turn Show Right-Edge Labels on. If they crowd, tune:
• Anti-overlap: min separation (ticks)
• Horizontal offset per tag (bars)
• Vertical jitter per step (ticks)
• Right-edge baseline offset (bars)
6. Alerts: open Add alert → Condition: and pick the events you want.
⸻
How levels are computed (no repainting)
• PDH/PDL: Intraday H/L are accumulated only while in RTH and saved at RTH close for “yesterday’s” values.
• ONH/ONL: Accumulated across the defined Overnight window and then held during RTH.
• RTH VWAP & ±σ: Volume-weighted mean and standard deviation, reset at the RTH open.
• IB: First N minutes of RTH (default 60). Extensions (1.5×/2.0×) appear after IB completes.
• Gaps: Today’s RTH open vs prior RTH close; “Gap Filled” triggers when price trades back to prior close.
⸻
Practical playbooks (how to trade around the levels)
1) PDH/PDL interactions
• Rejection: Price taps PDH/PDL then closes back inside → mean-reversion toward VWAP/IB.
• Acceptance: Close/hold beyond PDH/PDL with momentum → continuation to next HTF/IB target.
• Alert: PD Touch/Break.
2) ONH/ONL “taken”
• Often one ON extreme is taken during RTH. ONH Taken / ONL Taken → check if it’s a clean break or sweep & reclaim.
• Sweep + reclaim near VWAP can fuel rotations through the ON range.
3) VWAP ±σ framework
• Balanced: First tag of ±1σ often reverts toward VWAP.
• Trend: Persistent trade beyond ±1σ + IB break → target ±2σ/±3σ.
• Alerts: VWAP Cross and VWAP Reject (cross then immediate fail back).
4) IB breaks
• After IB completes, a clean IB break commonly targets 1.5× and sometimes 2.0×.
• Quick return inside IB = possible fade back to the opposite IB edge/VWAP.
• Alerts: IB Break Up / Down.
5) Gaps
• Gap-and-go: Opening drive away from prior close + VWAP support → trend until IB completion.
• Gap-fill: Weak open and VWAP overhead/underfoot → trade toward prior close; manage on Gap Filled alert.
Pro tip: Stack confluences (e.g., ONL sweep + VWAP reclaim + IB hold) and respect your execution rules (e.g., require a 5-minute close in direction, or your order-flow confirmation).
⸻
Inputs you’ll actually touch
• Sessions (ET): Session Timezone, RTH Session, Overnight Session.
• Visibility: toggles for PD/ON/VWAP/IB/Ref/Panel.
• VWAP bands: set σ multipliers (±1/±2/±3).
• IB: duration (minutes) and extension multipliers (1.5× / 2.0×).
• Style & Theme: Theme Preset, Main Line Width, Trackprice, Minimal Mode, and anti-overlap controls.
⸻
Alerts included
• PD Touch/Break — High ≥ PDH or Low ≤ PDL
• ONH Taken / ONL Taken — First in-RTH take of ONH/ONL
• VWAP Cross — Close crosses VWAP
• VWAP Reject — Cross then immediate fail back
• IB Break Up / Down — Break of IB High/Low after IB completes
• Gap Filled — Price trades back to prior RTH close
Setup: Add alert → Condition: Algo Index — Levels Pro → choose event → message → Notify on app/email.
⸻
Panel guide
The top-right panel shows each level plus live distance from last price:
LevelValue (Δpoints | Δticks)
Coloring: green if level is below current price, red if above.
⸻
Styling & screenshot tips
• Use Theme Preset that matches your chart.
• For dark charts, “Dark Hi-Contrast” with Main Line Width = 3 works well.
• Enable Trackprice for crisp axis tags that always stick to the right edge.
• Turn on Minimal Mode for cleaner screenshots (no VWAP bands or IB extensions, on-chart tags off; price-scale tags remain).
• If tags crowd, increase min separation (ticks) to 30–60 and horizontal offset to 3–5; add vertical jitter (4–12 ticks) and/or push tags farther right with baseline offset (bars).
⸻
Behavior & limitations
• Levels are computed incrementally; tables refresh on the last bar for efficiency.
• Right-edge labels are placed at bar_index + offset and do not track extra right-margin scrolling (TradingView limitation). The price-scale tags (from trackprice) do track the axis.
• “RTH” is what you define in inputs. If your market uses different day hours, change the session strings so PDH/PDL reflect your definition of “yesterday’s session.”
⸻
FAQ
Q: My PDH/PDL don’t match the daily chart.
A: By design this uses RTH-only highs/lows, not 24h daily bars. Adjust sessions if you want a different definition.
Q: Right-edge tags overlap or don’t sit at the far right.
A: Increase min separation / horizontal offset / vertical jitter and/or push tags farther with baseline offset. If you want markers that always hug the axis, rely on Trackprice.
Q: Can I change killzones?
A: Yes—edit the session strings in settings or request a version with user inputs for custom windows.
⸻
Disclaimer
Educational use only. This is not financial advice. Always apply your own risk management and confirmation rules.
⸻
Enjoy it? Please ⭐ the script and share screenshots using Minimal Mode + a Theme Preset that fits your style.

Breaker Blocks & Unicorns (with Deviations) by RiseBreaker Block and Unicorns (with Deviations) - The Highest Probability ICT Pattern
This advanced indicator identifies and tracks ICT Breaker Blocks, while incorporating powerful supplementary features including Unicorn patterns and customizable deviation levels.
These patterns develop through a precise market structure sequence culminating in structural breaks. Following Breaker Block confirmation, users can optionally enable highly customizable deviation levels. Additionally, the indicator can scan active Breaker Blocks for overlapping Fair Value Gaps (FVGs) and Inverted Fair Value Gaps (IFVGs)-(also known as "Unicorns") that represent high-probability trading opportunities, highly regarded in the ICT community.
This comprehensive tool provides unmatched functionality for traders and analysts seeking to track, backtest, and execute Breaker Block strategies. With its extensive feature set and granular customization options, it delivers capabilities that surpass existing alternatives in the market.
What is an ICT Breaker Block?
To explain this, we must understand the ABC sequence that form this pattern. It consists of:
Initial range (from A -> B)
First break point, commonly called "Manipulation" (C)
Second break, which is when the pattern is formed.
Each of these "points" consist of pivot levels, with an adjustable strength.
Breaker Blocks are invalidated and made inactive if price breaks the "C point", or manipulation.
Unicorns
Unicorns are Fair Value Gaps or Inverted Fair Value Gaps that overlap a Breaker Block. Breakers have their associated Unicorn, which is updated until price retraces into said gap.
Standard Deviations
This indicator has options to display deviations based on Breaker Blocks:
Breaker Deviations -> using the initial range (A -> B).
Manipulation Deviations -> using the manipulation (B -> C).
Input Settings:
This tool offers a lot of customizable options, which could be overwhelming to some users. Below you will find an in-depth definition of every input's purpose, to complement the tooltips that can be found directly in the indicator's settings.
Mode ⚙️
Default -> Displays every Breaker Block pattern found.
Bullish -> Displays every Bullish Breaker Block found.
Bearish -> Displays every Bearish Breaker Block found.
Reversals -> Displays alternate Breaker Blocks (Bearish -> Bullish -> Bearish and so on).
This is paired with a Historical input, to select the amount of previous Breakers to display.
Extend 📏
Last -> This option will extend the most recent Breaker's drawings.
Specified -> Extend Breakers a preset amount of bars.
All -> Extend all active Breakers to the current bar.
None -> Never extend Breaker Blocks.
Each object has it's specific " offset " parameter, which defines the amount of bars to extend drawings past the current bar.
Parameters
This section defines the main parameters used to define the Breaker Block pattern.
Time Filter -> Optional session to filter Breakers based on time of day.
Pivot Strength -> Determines how many consecutive bars to the left of a pivot must be lower (for highs) or higher (for lows) to confirm it as a point.
Range Lookback -> Amount of ranges that the indicator will keep track for each direction.
Breaker Type -> Defines how a Breaker Block is displayed:
Range -> Entire initial range.
Consecutive -> Last consecutive onside candles (upclose for bullish, downclose for bearish).
Last -> Last onside candle.
Breaker Offset -> Amount of bars to extend Breaker Blocks past the current bar.
Use Candle Bodies? -> Use bar open to close rather than high to low.
Require Candle Close? -> Use bar close to form Breaker Blocks.
Remove After Invalidation? -> Remove drawings for invalidated Breakers.
Style
Breaker Block boxes styling based on directions.
Optional Middle Line and styling.
Optional Signals for Breaker Block formation:
Triangle label with adjustable sizing on the formation bar.
Line with custom styling at breakout point to the formation bar.
Unicorn Fair Value Gaps
Checkbox to display Unicorns with adjustable "FVGs", "IFVGs", or "Both" types.
Overlap Threshold -> Distance away from Breaker to still consider an "overlap".
Unicorn Offset -> Amount of bars to extend unicorn gaps past the current bar.
Lines styling.
Optional Middle Line and styling.
Include Volume Imbalances? -> Include adjacent VIs as part of Fair Value Gaps.
Extend until Reached? -> Extend Unicorn drawings until price reaches them.
Deviations
Checkbox to display Standard Deviations with adjustable types and levels.
Lines styling.
Text size and positioning.
Extend until Reached? -> Extend deviation lines until price reaches them.
Text
Label contents:
Default -> "+/- Breaker".
Abbreviation -> "+/- BB".
None -> No text.
Size .
Font (Default or Monospace) and Format (None, Italic or Bold).
Align -> vertical and horizontal positioning.
This indicator is for educational and informational purposes only. Past performance and historical patterns do not guarantee future results. Trading involves substantial risk of loss and is not suitable for all investors. Always conduct your own analysis and consider your financial situation before making any trading decisions. The identification of patterns does not constitute trading advice.
For any additional questions and/or feedback related to this indicator, users can comment below!
