BBr1 Candle Range Volitility Gap IndicatorModified Candle Range Volatility Gap Indicator
1. Useful to analyze bars body and wicks and volatility of security.
2. Added a Percentage Option - easier to analyze across different securities.
2. Added a Standard Deviation ("1 std dev= 68.2%, 2 std dev=95.4%, 3 std dev=99.7%, etc") based upon user defined lookback period.
3. Added the ability to include Gaps in Analysis. (Gaps are when the prior closing cost does not equal opening price)
4. Possible Uses setting up stop losses, trailing entries/exits (inside range or outside range).
5. Use it with other indicators in determining if to make an entry or close entry.
Reposted Original Description by © ka66 Kamal Advani
Visually shows the Body Range (open to close) and Candle Range (high to low).
Semi-transparent overlapping area is the full Candle Range, and fully-opaque smaller area is the Body Range. For aesthetics and visual consistency, Candle Range follows the direction of the Body Range, even though technically it's always positive (high - low).
The different plots for each range type also means the UI will allow deselecting one or the other as needed. For example, some strategies may care only about the Body Range, rather than the entire Candle Range, so the latter can be hidden to reduce noise.
Threshold horizontal lines are plotted, so the trader can modify these high and low levels as needed through the user interface. These need to be configured to match the instrument's price range levels for the timeframe. The defaults are pretty arbitrary for +/- 0.0080 (80 pips in a 4-decimal place forex pair). Where a range reaches or exceeds a threshold, it's visually marked as well with a shape at the Body or Candle peak, to assist with quicker visual potential setup scanning, for example, to anticipate a following reversal or continuation.
Cerca negli script per "gaps"

Panic Drop Stock Market Bull/Bear Market Panic Drop Bull/Bear
What It Does:
This indicator identifies bull and bear markets for the S&P 500 (or any stock/index) using the 50-period and 150-period Simple Moving Averages (SMAs). A green background signals a confirmed bull market when the 50 SMA is above the 150 SMA and the 150 SMA slope is flat or upward. A red background signals a confirmed bear market when the 50 SMA is below the 150 SMA and the 150 SMA slope is downward. The background color persists until a new confirmed state is detected, ensuring no gaps—perfect for spotting long-term market trends whether you’re a beginner, trend trader, or long-term investor.
Key Features:
Plots 50 SMA (default: blue line) and 150 SMA (default: orange line).
Background highlights: green for bull markets, red for bear markets.
Persistent background color—no gaps during unconfirmed periods.
Alerts for confirmed bull and bear market transitions.
Fully adjustable: MA periods, slope lookback, and more.
How to Use It:
Add to your S&P 500 chart (e.g., SPX or SPY) on a daily or weekly timeframe (daily default recommended for long-term trends).
Watch for background color changes:
Green background: Confirmed bull market—consider long positions or holding.
Red background: Confirmed bear market—consider shorting or exiting longs.
Customize via settings:
Adjust MA periods (default: 50 and 150).
Set slope lookback (default: 5 bars) to control slope sensitivity.
Change MA colors if desired.
Set alerts: Right-click on the chart > "Add Alert" > Select "Bull Market Confirmed" or "Bear Market Confirmed."
Trade smart: Use the background to confirm market regimes—e.g., go long during green (bull) phases above key support levels, or protect capital during red (bear) phases.
Why It’s Great:
Beginners: Simple background colors make market trends easy to spot.
Trend Traders: 50/150 SMA crossover with slope confirmation catches major market shifts.
Long-Term Investors: Persistent background ensures you stay in the trend without noise.
Created by Timothy Assi (Panic Drop), eToro’s elite investor. Test it, tweak it, and trade with confidence!

Destroyer LifeDestroyer Life Strategy - High-Frequency Long & Short Trading
Overview:
The Destroyer Life strategy is an advanced cryptocurrency trading algorithm designed for high-frequency execution on the 15-second timeframe. It combines CRT (Candle Range Trend) and Turtle Soup trading logic with multi-timeframe analysis to optimize entries and exits for both long and short trades. This strategy is specifically optimized for high-volatility crypto pairs, such as SOL/USD on MEXC, ensuring precise execution with minimal drawdown.
Key Features:
15-Second Timeframe Execution: Optimized for ultra-short-term trading.
Long & Short Strategy: Simultaneously identifies profitable buy and sell opportunities.
CRT & Turtle Soup Logic: Leverages price action patterns for enhanced trade accuracy.
Higher Timeframe Analysis (HTF): Incorporates liquidity zones, fair value gaps (FVG), and breaker blocks for context-aware trading.
Dynamic Position Sizing: Uses an adjustable leverage multiplier for risk-controlled trade sizing.
Commission Optimization: Ensures profitability even with trading fees.
Strict Risk Management: Implements exit conditions based on liquidity structure and trend reversals.
Strategy Performance (Backtested on SOL/USD - MEXC):
Overall Profitability: ~80% win rate in backtesting.
Net Profit: $3,151.12 (6.30% ROI).
Gross Profit: $3,795.68 (7.59%).
Gross Loss: $644.56 (1.29%).
Long Trades Profit: $1,459.05 (2.92%).
Short Trades Profit: $1,692.07 (3.38%).
Commission Paid: $924.82.
Minimum Trade Holding Period: 1-minute cooldown between trades.
Trading Logic:
Entry Conditions:
Long Trades: Triggered when the price enters a liquidity void and aligns with higher timeframe bullish bias.
Short Trades: Triggered when price approaches a resistance level with bearish higher timeframe confluence.
CRT & Turtle Soup Patterns: Identifies reversals by analyzing breakout and fake-out structures.
Exit Conditions:
Long Positions Close: Upon price exceeding a 3.88% profit threshold or reversing below an HTF structure.
Short Positions Close: Upon reaching a similar 3.88% threshold or showing strong bullish signals.
Dynamic Position Sizing:
Uses a leverage-based calculation that adapts trade size based on volatility.
Liquidity Awareness:
Tracks Mitigation Blocks (MB), Fair Value Gaps (FVG), Buy/Sell-Side Liquidity (BSL/SSL) to determine optimal execution.
Best Use Cases:
Scalpers & High-Frequency Traders: Those looking for rapid trade execution with short holding periods.
Crypto Traders Focused on Low Timeframes: Optimized for 15-second price action.
Traders Utilizing Liquidity Concepts: Built to exploit liquidity traps and inefficiencies.
Risks & Considerations:
High-Frequency Execution Requires Low Latency: Ensure your broker or exchange supports fast order execution.
Backtested Results May Vary: Real-time performance depends on market conditions.
Commission & Fees Impact Profits: Consider exchanges with low fees to maximize strategy efficiency.
Final Thoughts:
The Destroyer Life Strategy is designed for serious traders looking to take advantage of high-volatility markets with a structured, liquidity-based approach. By combining price action, liquidity concepts, and adaptive risk management, it provides a solid framework for executing high-probability trades on crypto markets.
🚀 Ready to take your trading to the next level? Try Destroyer Life today and dominate the markets!

Bollinger Bands by Abu ElyasBollinger Bands with Adjustable Stop Loss (Long-Only)
This strategy uses a Bollinger Band breakout approach to enter long positions and incorporates an adjustable stop loss for risk management.
Below is an overview of the logic, parameters, and usage instructions.
1. Bollinger Bands Logic
Basis (Middle Band): A moving average (type selectable by the user) of the chosen source, typically the closing price.
Upper Band: The basis plus a specified number of standard deviations (user-defined multiplier).
Lower Band: The basis minus the same number of standard deviations.
2. Entry Triggers
The strategy enters a long position when the close price rises above the upper Bollinger Band , suggesting a potential bullish breakout.
This logic is only applied within a user-specified date range (adjustable in the strategy’s inputs).
3. Exit Triggers
1. Bollinger Band Exit:
If the close price drops below the lower Bollinger Band , the strategy closes the position, indicating a loss of bullish momentum.
2. Stop Loss Exit:
A default 8% stop loss is set, which automatically exits the trade if the close falls 8% below the entry price.
This stop-loss percentage is adjustable from the strategy’s settings, allowing users to tailor risk based on their preferences.
3. Date Range:
If the current bar is outside of the specified start/end dates, the strategy will also exit any open positions.
4. Position Sizing & Other Settings
1- Position Size:
By default, the script uses 100% of account equity for each trade.
2- Commissions & Slippage:
Commission is set to 0%, and slippage is set to 3 ticks.
3- Timeframe Handling:
You can select a custom timeframe or leave it blank to use the chart’s timeframe.
5. Customization
1. Bollinger Bands Parameters:
Length of the moving average, type of moving average (SMA, EMA, etc.), and the standard deviation multiplier can be adjusted.
2. Stop Loss (%)
The default stop loss of 8% can be changed in the script’s input settings to any percentage you prefer.
3. Date Filter:
Modify the start/end dates to control the historical period over which the strategy executes trades.
6. Notes & Best Practices
1- No Short Trades:
This is a long‐only strategy. It will either be in a long position or flat (no open position).
2- Risk Management:
An 8% stop loss may or may not align with your personal risk tolerance. Always adjust according to market conditions and your own trading style.
3- Market Gaps & Volatility:
In highly volatile markets, slippage or gaps can cause the actual exit price to be worse than the intended stop-loss level.
4- Test Thoroughly:
Backtest on different timeframes and market conditions. No single strategy works in all scenarios.
7. Disclaimer
Educational Use Only: This script is for informational and illustrative purposes and should not be considered financial advice.
No Guarantee of Profit: Past performance does not guarantee future results. Trading involves substantial risk, and it is possible to lose more than your initial investment.
Consult a Professional: Always consult a qualified financial advisor before making investment decisions.
Use this script as a foundation and personalize it based on your trading style, tolerance for drawdowns, and market conditions.

FVG LevelsFVG Levels Indicator Description
The FVG Levels indicator dynamically identifies and displays key price zones that may represent fair value gaps and order block areas, helping traders to visually pinpoint potential support and resistance levels directly on the chart.
Key Features
Order Block Identification:
The indicator detects bullish and bearish order blocks by analyzing specific candle patterns. For bullish zones, it checks if a candle two bars ago was bullish (close greater than open) coupled with a subsequent gap condition. Similarly, bearish zones are identified when bearish candle conditions are met with an appropriate gap.
Dynamic Zone Calculation:
It computes critical levels such as the highest highs, lowest lows, highest lows, and lowest highs over a series of recent bars. These levels define the boundaries of potential buy and sell zones and adjust dynamically as new price data comes in.
Visual Representation:
Buy zones are plotted in lime and sell zones in yellow, with the indicator filling the areas between the high and low lines to create clear, shaded bands. This visual aid helps in quickly recognizing zones of potential price reaction.
Chart Overlay:
Designed to work as an overlay, the indicator integrates directly onto your price chart, allowing for seamless correlation between price action and identified zones.
How It Works
Bullish Zones:
When a bullish candle (with the candle's close above its open) is detected along with a significant gap, the indicator marks the upper and lower boundaries of the bullish order block. It further refines these levels by tracking the lowest low and highest high over recent bars to enhance the zone's definition.
Bearish Zones:
In a similar manner, the indicator calculates bearish order blocks by confirming bearish candle conditions and corresponding gap criteria. It then updates the bearish zone levels and computes the highest high and lowest low to establish clear sell zone boundaries.
Usage
Traders can use the FVG Levels indicator to:
Identify potential entry and exit points by observing where price may reverse or consolidate.
Recognize fair value gaps or imbalances that often act as magnet points for price action.
Enhance risk management by using the dynamically calculated zones to set stop-losses or take-profits.

Gap Detector RSTThis script detects and visualizes price gaps in the market using customizable settings. It identifies bullish and bearish gaps over a specified lookback period and marks them with clearly defined boxes. Users can adjust the minimum gap percentage threshold and customize colors for better visibility.

SMC Liquidity & Order Blocks🔹 1. Moving Averages for Trend Confirmation
Uses Exponential Moving Averages (EMA) to determine trend direction.
9-period EMA (blue) and 15-period EMA (red) are plotted.
🔹 2. Liquidity Zones (Swing Highs & Lows)
Identifies liquidity zones where price is likely to react.
Buy-Side Liquidity: Highest high over 20 periods (Green line).
Sell-Side Liquidity: Lowest low over 20 periods (Red line).
🔹 3. Order Block Detection
Detects bullish and bearish order blocks (key price zones of institutional activity).
Bullish Order Block (OB): Formed when the highest close over 5 bars exceeds the highest high.
Bearish Order Block (OB): Formed when the lowest close over 5 bars is lower than the lowest low.
Plotted using green (up-triangle) for bullish OB and red (down-triangle) for bearish OB.
🔹 4. Fair Value Gaps (FVG)
Detects price inefficiencies (gaps between candles).
FVG Up: When a candle's high is lower than a candle two bars ahead.
FVG Down: When a candle's low is higher than a candle two bars ahead.
Plotted using blue circles (FVG Up) and orange circles (FVG Down).

2:30 [LuciTech]this is a technical analysis tool designed to highlight key price levels and patterns during a specific trading window, based on UK time (Europe/London). It overlays visual elements on the chart, including a 12 PM reference line, Buy Side Liquidity (BSL) and Sell Side Liquidity (SSL) levels, a highlighted 2:30 PM candle, and Engulfing Fair Value Gaps (FVGs). This indicator is intended for traders who focus on intraday price action and liquidity zones.
Features
The 12 PM Line displays a vertical line at 12:00 PM (UK time) to mark the start of the session. It’s customizable, allowing you to enable or disable it and adjust its color.
BSL/SSL Lines track the highest high (BSL) and lowest low (SSL) from 12:00 PM to 2:00 PM (UK time). These lines extend horizontally until 3:30 PM, after which they remain static at their last recorded levels. You can customize them by enabling or disabling visibility, adjusting colors, choosing a line style (solid, dashed, or dotted), and setting the width.
The 2:30 PM Candle highlights the candle at 2:30 PM (UK time) with a distinct color. It’s customizable, with options to enable or disable it and change its color.
Engulfing FVG (Fair Value Gap) identifies bullish and bearish engulfing patterns with a gap from the prior candle’s range. It draws a shaded box over the FVG area, and you can customize it by enabling or disabling it and adjusting the box color.
How It Works
The indicator operates within a session starting at 12:00 PM (UK time). BSL/SSL levels update between 12:00 PM and 2:00 PM, with lines extending until 3:30 PM. After 3:30 PM, these lines freeze.
BSL/SSL lines show the highest price (BSL) and lowest price (SSL) reached during the 12:00 PM to 2:00 PM window. After 3:30 PM, they remain static, marking the final range boundaries.
The 2:30 PM candle emphasizes a key timestamp, often of interest to intraday traders.
Engulfing FVGs detect significant price gaps created by engulfing candles, which may indicate potential reversal or continuation zones.
Settings
12 PM Line Settings let you toggle visibility and set the line color.
BSL/SSL Line Settings allow you to toggle visibility, set BSL and SSL colors, choose a line style (Solid, Dashed, Dotted), and adjust width (1-4).
2:30 Candle Settings let you toggle visibility and set the candle color.
Engulfing FVG Settings allow you to toggle visibility and set the box color.
Interpretation
The 12 PM Line serves as a reference for the session start.
BSL/SSL Lines may act as potential support or resistance zones or highlight liquidity areas. After 3:30 PM, they remain static, showing the session’s final range.
The 2:30 PM Candle can be monitored for price action signals, such as reversals or breakouts.
Engulfing FVGs shaded areas may indicate imbalances in supply and demand, useful for identifying trade opportunities or stop-loss placement.
Notes
The timezone is set to Europe/London (UK time). Ensure your chart’s timezone aligns for accurate results.
This indicator is best used on intraday timeframes, such as 1-minute or 5-minute charts.
It provides visual aids for analysis and does not generate buy or sell signals on its own.

Price Gap IndicatorJump Candle Indicator (Price Gap Only)
📌 Version: Pine Script v6
📌 Purpose: Detects significant price gaps between consecutive candles to identify potential trading opportunities.
📖 Overview
The Jump Candle Indicator highlights moments when the market experiences a sudden price jump, either up or down, due to overnight moves, news releases, or increased volatility.
It works by detecting candles where the opening price differs significantly from the previous closing price by a set threshold.
Unlike traditional momentum indicators, this script focuses purely on price gaps, making it ideal for traders who want to identify potential breakout zones or market inefficiencies.
⚙️ How It Works
User-Defined Threshold – Set a minimum price gap (default: $0.50).
Gap Up Condition – A candle is considered bullish if:
The current open is higher than the previous close by the defined threshold.
The candle closes higher than it opens (bullish candle).
Gap Down Condition – A candle is considered bearish if:
The current open is lower than the previous close by the defined threshold.
The candle closes lower than it opens (bearish candle).
Large Arrow Alerts –
Green Upward Triangle (📈) appears below bullish jump candles.
Red Downward Triangle (📉) appears above bearish jump candles.
🛠️ Customization
Price Gap Threshold ($): Adjust the gap size to detect smaller or larger jumps.
Visual Signals: Large green and red triangles for clear trade signals.
🎯 How to Use
✅ Breakout Traders – Spot potential trend continuations after a gap.
✅ Mean Reversion Traders – Identify overextended price movements that may revert.
✅ News/Event Traders – Track market reactions after earnings, reports, or major news.
🚨 Note: This indicator is best used with additional confirmation signals (volume, support/resistance levels, or trend analysis).

Gap Detection Indicator V.1This indicator is designed to detect gaps between candles on the chart. It detects all gaps that are higher than the specified percentage setting, draws a line passing through only the starting and ending points of the last gap, and paints between these lines.
If any candle closes above the gap starting level, the lines between the lines are colored green; If any candle closes below the gap starting level, the lines between the lines are colored red.
UPDATE1:
In addition, two more gap levels were added. A date range was added to enable control within the specified date range.

[TehThomas] - Market Structure Shift (MSS)
- Market Structure Shift (MSS) Script Overview
This TradingView script is designed to help traders identify Market Structure Shifts (MSS) and Breaks of Structure (BOS), which are key concepts in ICT (Inner Circle Trader) and Smart Money Concepts (SMC) trading. By detecting significant shifts in price action, the script provides visual cues and alerts to help traders spot potential trend changes and continuation patterns.
How the Script Works
1. Identifying Swing Highs & Lows
The script detects swing highs and swing lows based on a pivot strength setting (default: 3).
A swing high forms when a candle’s high is higher than the highs of a set number of candles on both sides.
A swing low forms when a candle’s low is lower than the lows of the surrounding candles.
2. Market Structure Shift (MSS) Detection
A bullish MSS occurs when price closes above the most recent swing high after previously being in a bearish trend.
A bearish MSS occurs when price closes below the most recent swing low after being in a bullish trend.
This signals a potential trend reversal and is often a key area for liquidity grabs and smart money entry points.
3. Break of Structure (BOS) Detection (Optional - Can be enabled/disabled in settings)
A BOS is detected when price continues in the direction of the trend, confirming a structural break rather than a shift.
Bullish BOS: Price breaks a swing high but does not reverse (confirms trend continuation).
Bearish BOS: Price breaks a swing low but continues downward.
BOS levels help traders confirm trend strength and potential trade continuation setups.
4. Drawing Structure Lines & Labels
The script plots horizontal lines at the detected MSS and BOS levels.
Labels such as "MSS" or "BOS" appear at the breakout points.
Traders can customize the line style, color, and text size for better visibility.
5. Alert System for MSS & BOS
The script includes alert conditions that notify traders when an MSS or BOS occurs.
Alerts can be set for:
Any MSS / Any BOS
Bullish MSS / Bullish BOS
Bearish MSS / Bearish BOS
Settings You Can Change
The script allows for full customization through the following input parameters:
Pivot Strength (pivot_strength)
Default: 4
Adjusts how many candles must be considered to form a valid swing high or low.
Higher values result in stronger structure points, while lower values detect short-term movements.
Color Settings
Highs Color (highs) → Default: Blue (for bullish structure)
Lows Color (lows) → Default: Red (for bearish structure)
Toggle Display Options
Show BOS (show_bos) → Enables/disables BOS detection.
Show MSS (show_mss) → Enables/disables MSS detection.
Line & Label Customization
BOS Line Style (bos_style) → Options: Solid, Dashed, Dotted
MSS Line Style (mss_style) → Options: Solid, Dashed, Dotted
BOS & MSS Line Width → Adjustable from 1 to 4 pixels
BOS & MSS Text Size → Options: Tiny, Small, Normal, Large, Huge
BOS & MSS Text Position → Options: Left, Center, Right
Why This Script is Useful
✔ Detects Key Market Structure Changes
MSS and BOS are critical for identifying trend reversals and trend continuations.
Helps traders avoid false breakouts by distinguishing between structural shifts and simple breakouts.
✔ Enhances Smart Money Trading Strategies
MSS often aligns with liquidity grabs before price reverses.
BOS confirms continuation trades in strong trends.
Works well with Fair Value Gaps (FVGs), Order Blocks (OBs), and Liquidity Zones.
✔ Customizable Alerts & Visuals
Traders can enable alerts for MSS and BOS to receive notifications when price shifts.
Adjustable styling ensures clarity across different trading setups.
✔ Works on Any Asset & Timeframe
Suitable for Forex, Crypto, Stocks, and Indices.
Can be used on lower timeframes (scalping) or higher timeframes (swing trading).
How to Use the Market Structure Shift Concept in Trading
1️⃣ Identify Market Conditions
Apply the script and check if price is forming Higher Highs (HH), Higher Lows (HL), Lower Highs (LH), or Lower Lows (LL).
Determine if the market is trending or ranging.
2️⃣ Watch for MSS (Reversal Signals)
Bullish MSS: Price closes above a key swing high → potential bullish reversal.
Bearish MSS: Price closes below a swing low → potential bearish reversal.
3️⃣ Confirm BOS (Trend Continuation Signals)
Bullish BOS: Price continues breaking highs, confirming an uptrend.
Bearish BOS: Price continues breaking lows, confirming a downtrend.
4️⃣ Combine with Other ICT & SMC Concepts
Look for Order Blocks (OBs) and Fair Value Gaps (FVGs) near MSS/BOS levels for better trade entries.
Wait for liquidity grabs before entering trades (avoid stop hunts).
Use higher timeframe MSS/BOS zones as key support & resistance areas.
Final Thoughts
This script is a must-have tool for traders using ICT & SMC trading strategies. It helps identify trend shifts, liquidity grabs, and continuation moves by marking Market Structure Shifts (MSS) and Breaks of Structure (BOS) on the chart.

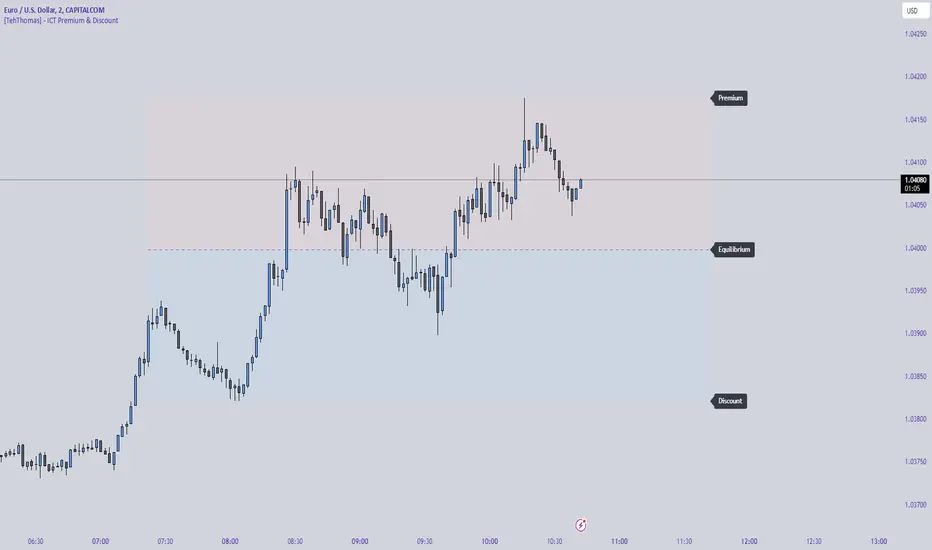
[TehThomas] - ICT Premium & Discount - ICT Premium & Discount: Script Overview
This TradingView script is designed to visualize the ICT (Inner Circle Trader) Premium & Discount Concept by dynamically identifying the key price zones within a specified lookback period. It highlights the Premium Zone, Discount Zone, and Equilibrium Level, helping traders assess where price is trading in relation to historical highs and lows.
How the Script Works
1. Lookback Period Calculation
The script scans the last X bars (user-defined lookback period) to find the highest high and lowest low during that time.
This helps establish a reference range for determining whether the current price is trading in a premium (overbought) or discount (oversold) area.
2. Equilibrium Level
The equilibrium is simply the midpoint between the highest high and the lowest low within the lookback period.
This level serves as a fair value price where price often reacts or consolidates.
3. Drawing the Premium & Discount Zones
The script creates two distinct zones:
Premium Zone (above equilibrium): Price is considered expensive.
Discount Zone (below equilibrium): Price is considered cheap.
These zones are displayed using colored boxes (red for premium, green for discount).
4. Equilibrium Line & Labels
A dashed equilibrium line is plotted at the midpoint to give a visual reference.
Labels for Premium, Discount, and Equilibrium are added to help traders quickly identify these levels.
Settings You Can Change
The script includes multiple input parameters that allow customization:
1. Lookback Period (lookback)
Default: 50 bars
Defines how many past candles to analyze for the highest high and lowest low.
A larger lookback provides a broader market structure, while a smaller one captures short-term moves.
Premium Zone Color (premium_color)
Default: Red (80% transparency)
You can modify this to change how the premium zone appears on the chart.
Discount Zone Color (discount_color)
Default: Green (80% transparency)
Allows customization of the discount zone’s color.
Extend Boxes Right (extend_right)
Default: 15 bars
Defines how far the premium and discount boxes extend into the future for better visibility.
Why This Script is Useful
Identifies High-Probability Trade Zones.
Traders can use the Premium & Discount zones to find optimal trade entries based on ICT concepts.
Buy in the Discount Zone and sell in the Premium Zone when confluence aligns.
Enhances Smart Money Concepts (SMC) Trading
ICT traders look for liquidity sweeps, fair value gaps, and order blocks.
Combining these with premium & discount levels increases trade accuracy.
Works on Any Timeframe & Asset
The script is effective across forex, crypto, stocks, and indices on multiple timeframes.
How to Use the ICT Premium & Discount Concept in Trading
Find the Range
Apply the script to your chart and check the premium and discount levels.
Ensure you are using a relevant lookback period (e.g., 50 bars for intraday, 100+ for higher timeframes).
Wait for Price to Enter a Key Zone
Long Trades: Look for bullish confirmations (e.g., liquidity grabs, order blocks) in the Discount Zone.
Short Trades: Seek bearish setups in the Premium Zone where price is expensive.
Use the Equilibrium as a Reaction Zone
Price often bounces off or retests equilibrium before making a directional move.
Consider it as a dynamic support/resistance level.
Combine with Other ICT Concepts
Fair Value Gaps (FVGs): Look for price inefficiencies inside premium/discount zones.
Liquidity Sweeps: Watch for stop hunts and false breakouts before entering trades.
Order Blocks (OBs): Use smart money footprints to refine your entries.
Final Thoughts
This script is a powerful tool for ICT traders looking to refine their premium & discount analysis. By visually separating the market into premium (overbought) and discount (oversold) zones, traders can make more informed, high-probability trading decisions.
John Bob-Trading-BotDeveloped by Ayebale John Bob with the help of his bestie, this innovative strategy combines advanced Smart Money Concepts with practical risk management tools to help traders identify and capitalize on key market moves.
Key Features:
Smart Money Concepts & Fair Value Gaps (FVG):
The strategy monitors price action for fair value gaps, which are visualized as extremely faint horizontal lines on the chart. These FVGs signal potential areas where institutional traders might have entered or exited positions.
Dynamic Entry Signals:
Buy signals are triggered when the price crosses above the 50-bar lowest low or when a bullish FVG is detected. Conversely, sell signals are generated when the price falls below the 50-bar highest high or a bearish FVG is identified. Each signal is visually marked on the chart with clear buy (green) and sell (red) labels.
Multi-Level Order Execution:
Once an entry signal occurs, the strategy places five separate orders, each with its own take-profit (TP) level. The TP levels are calculated dynamically using the Average True Range (ATR) and a set of predefined multipliers. This allows traders to scale out of positions as the market moves favorably.
Dynamic Risk Management:
A stop-loss is automatically set at a distance determined by the ATR, ensuring that risk is managed in accordance with current market volatility.
Real-Time Trade Information Table:
In the bottom-right corner of the chart, a trade information table displays essential details about the current trade:
Side: Displays "BUY NOW" (with a dark green background) for long entries or "SELL NOW" (with a dark red background) for short entries.
Entry Price & Stop-Loss: Shows the entry price (highlighted in green) and the corresponding stop-loss level (highlighted in red).
Take-Profit Levels: Lists the five TP levels, each of which turns green once the market price reaches that target.
Timer: A live timer in minutes counts from the moment the current trade trigger started, helping traders track the duration of their active trades.
Visual Progress Bar:
A histogram-style progress bar is plotted on the chart, visually representing the percentage gain (or loss) relative to the entry price.
This strategy was meticulously designed to incorporate both technical analysis and smart risk management, offering a robust trading solution that adapts to changing market conditions. Whether you're a seasoned trader or just starting out, the AyebaleJohnBob Trading Bot equips you with the tools and visual cues needed to make well-informed trading decisions. Enjoy a seamless blend of strategy and style—crafted with passion by Ayebale John Bob and his bestie!

Reversal rehersal v1This indicator was designed to identify potential market reversal zones using a combination of RSI thresholds (shooting range/falling range), candlestick patterns, and Fair Value Gaps (FVGs). By combining all these elements into one indicator, it allow for outputting high probability buy/sell signals for use by scalpers on low timeframes like 1-15 mins, for quick but small profits.
Note: that this has been mainly tested on DE40 index on the 1 min timeframe, and need to be adjusted to whichever timeframe and symbol you intend to use. Refer to the backtester feature for checking if this indicator may work for you.
The indicator use RSI ranges from two timeframes to highlight where momentum is building up. During these areas, it will look for certain candlestick patterns (Sweeps as the primary one) and check for existance of fair value gaps to further enhance the hitrate of the signal.
The logic for FVG detection was based on ©pmk07's work with MTF FVG tiny indicator. Several major changes was implemented though and incorporated into this indicator. Among these are:
Automatically adjustments of FVG boxes when mitigated partially and options to extend/cull boxes for performance and clarity.
Backtesting Table (Experimental):
This indicator also features an optional simplified table to review historical theoretical performance of signals, including win rate, profit/loss, and trade statistics. This does not take commision or slippage into consideration.
Usage Notes:
Setup:
1. Add the indicator to your chart.
2. Decide if you want to use Long or Short (or both).
3. If you're scalping on ie. 1 min time frame, make sure to set FVG's to higher timeframes (ie. 5, 15, 60).
4. Enable the 'Show backtest results' and adjust the 'Signals' og 'Take profit' and 'Stop loss' values until you are satisfied with the results.
Use:
1. Setup an alert based on either of the 'BullishShooting range' or 'BearishFalling range' alerts. This will draw your attention to watch for the possible setups.
2. Verify if there's a significant imbalance prior to the signal before taking the trade. Otherwise this may invalidate the setup.
3. Once a signal is shown on the graph (either Green arrow up for buys/Red arrow down for sells) - you should enter a trade with the given 'Take profit' and 'Stop loss' values.
4. (optional) Setup an alert for either the Strong/Weak signals. Which corresponds to when one of the arrows are printed.
Important: This is the way I use it myself, but use at own risk and remember to combine with other indicators for further confluence. Remember this is no crystal ball and I do not guarantee profitable results. The indicator merely show signals with high probability setups for scalping.

Uptrick: Volatility Reversion BandsUptrick: Volatility Reversion Bands is an indicator designed to help traders identify potential reversal points in the market by combining volatility and momentum analysis within one comprehensive framework. It calculates dynamic bands around a simple moving average and issues signals when price interacts with these bands. Below is a fully expanded description, structured in multiple sections, detailing originality, usefulness, uniqueness, and the purpose behind blending standard deviation-based and ATR-based concepts. All references to code have been removed to focus on the written explanation only.
Section 1: Overview
Uptrick: Volatility Reversion Bands centers on a moving average around which various bands are constructed. These bands respond to changes in price volatility and can help gauge potential overbought or oversold conditions. Signals occur when the price moves beyond certain thresholds, which may imply a reversal or significant momentum shift.
Section 2: Originality, Usefulness, Uniqness, Purpose
This indicator merges two distinct volatility measurements—Bollinger Bands and ATR—into one cohesive system. Bollinger Bands use standard deviation around a moving average, offering a baseline for what is statistically “normal” price movement relative to a recent mean. When price hovers near the upper band, it may indicate overbought conditions, whereas price near the lower band suggests oversold conditions. This straightforward construction often proves invaluable in moderate-volatility settings, as it pinpoints likely turning points and gauges a market’s typical trading range.
Yet Bollinger Bands alone can falter in conditions marked by abrupt volatility spikes or sudden gaps that deviate from recent norms. Intraday news, earnings releases, or macroeconomic data can alter market behavior so swiftly that standard-deviation bands do not keep pace. This is where ATR (Average True Range) adds an important layer. ATR tracks recent highs, lows, and potential gaps to produce a dynamic gauge of how much price is truly moving from bar to bar. In quieter times, ATR contracts, reflecting subdued market activity. In fast-moving markets, ATR expands, exposing heightened volatility on each new bar.
By overlaying Bollinger Bands and ATR-based calculations, the indicator achieves a broader situational awareness. Bollinger Bands excel at highlighting relative overbought or oversold areas tied to an established average. ATR simultaneously scales up or down based on real-time market swings, signaling whether conditions are calm or turbulent. When combined, this means a price that barely crosses the Bollinger Band but also triggers a high ATR-based threshold is likely experiencing a volatility surge that goes beyond typical market fluctuations. Conversely, a price breach of a Bollinger Band when ATR remains low may still warrant attention, but not necessarily the same urgency as in a high-volatility regime.
The resulting synergy offers balanced, context-rich signals. In a strong trend, the ATR layer helps confirm whether an apparent price breakout really has momentum or if it is just a temporary spike. In a range-bound market, standard deviation-based Bollinger Bands define normal price extremes, while ATR-based extensions highlight whether a breakout attempt has genuine force behind it. Traders gain clarity on when a move is both statistically unusual and accompanied by real volatility expansion, thus carrying a higher probability of a directional follow-through or eventual reversion.
Practical advantages emerge across timeframes. Scalpers in fast-paced markets appreciate how ATR-based thresholds update rapidly, revealing if a sudden price push is routine or exceptional. Swing traders can rely on both indicators to filter out false signals in stable conditions or identify truly notable moves. By calibrating to changes in volatility, the merged system adapts naturally whether the market is trending, ranging, or transitioning between these phases.
In summary, combining Bollinger Bands (for a static sense of standard-deviation-based overbought/oversold zones) with ATR (for a dynamic read on current volatility) yields an adaptive, intuitive indicator. Traders can better distinguish fleeting noise from meaningful expansions, enabling more informed entries, exits, and risk management. Instead of relying on a single yardstick for all market conditions, this fusion provides a layered perspective, encouraging traders to interpret price moves in the broader context of changing volatility.
Section 3: Why Bollinger Bands and ATR are combined
Bollinger Bands provide a static snapshot of volatility by computing a standard deviation range above and below a central average. ATR, on the other hand, adapts in real time to expansions or contractions in market volatility. When combined, these measures offset each other’s limitations: Bollinger Bands add structure (overbought and oversold references), and ATR ensures responsiveness to rapid price shifts. This synergy helps reduce noisy signals, particularly during sudden market turbulence or extended consolidations.
Section 4: User Inputs
Traders can adjust several parameters to suit their preferences and strategies. These typically include:
1. Lookback length for calculating the moving average and standard deviation.
2. Multipliers to control the width of Bollinger Bands.
3. An ATR multiplier to set the distance for additional reversal bands.
4. An option to display weaker signals when the price merely approaches but does not cross the outer bands.
Section 5: Main Calculations
At the core of this indicator are four important steps:
1. Calculate a basis using a simple moving average.
2. Derive Bollinger Bands by adding and subtracting a product of the standard deviation and a user-defined multiplier.
3. Compute ATR over the same lookback period and multiply it by the selected factor.
4. Combine ATR-based distance with the Bollinger Bands to set the outer reversal bands, which serve as stronger signal thresholds.
Section 6: Signal Generation
The script interprets meaningful reversal points when the price:
1. Crosses below the lower outer band, potentially highlighting oversold conditions where a bullish reversal may occur.
2. Crosses above the upper outer band, potentially indicating overbought conditions where a bearish reversal may develop.
Section 7: Visualization
The indicator provides visual clarity through labeled signals and color-coded references:
1. Distinct colors for upper and lower reversal bands.
2. Markers that appear above or below bars to denote possible buying or selling signals.
3. A gradient bar color scheme indicating a bar’s position between the lower and upper bands, helping traders quickly see if the price is near either extreme.
Section 8: Weak Signals (Optional)
For those preferring early cues, the script can highlight areas where the price nears the outer bands. When weak signals are enabled:
1. Bars closer to the upper reversal zone receive a subtle marker suggesting a less robust, yet still noteworthy, potential selling area.
2. Bars closer to the lower reversal zone receive a subtle marker suggesting a less robust, yet still noteworthy, potential buying area.
Section 9: Simplicity, Effectiveness, and Lower Timeframes
Although combining standard deviation and ATR involves sophisticated volatility concepts, this indicator is visually straightforward. Reversal bands and gradient-colored bars make it easy to see at a glance when price approaches or crosses a threshold. Day traders operating on lower timeframes benefit from such clarity because it helps filter out minor fluctuations and focus on more meaningful signals.
Section 10: Adaptability across Market Phases
Because both the standard deviation (for Bollinger Bands) and ATR adapt to changing volatility, the indicator naturally adjusts to various environments:
1. Trending: The additional ATR-based outer bands help distinguish between temporary pullbacks and deeper reversals.
2. Ranging: Bollinger Bands often remain narrower, identifying smaller reversals, while the outer ATR bands remain relatively close to the main bands.
Section 11: Reduced Noise in High-Volatility Scenarios
By factoring ATR into the band calculations, the script widens or narrows the thresholds during rapid market fluctuations. This reduces the amount of false triggers typically found in indicators that rely solely on fixed calculations, preventing overreactions to abrupt but short-lived price spikes.
Section 12: Incorporation with Other Technical Tools
Many traders combine this indicator with oscillators such as RSI, MACD, or Stochastic, as well as volume metrics. Overbought or oversold signals in momentum oscillators can provide additional confirmation when price reaches the outer bands, while volume spikes may reinforce the significance of a breakout or potential reversal.
Section 13: Risk Management Considerations
All trading strategies carry risk. This indicator, like any tool, can and does produce losing trades if price unexpectedly reverses again or if broader market conditions shift rapidly. Prudent traders employ protective measures:
1. Stop-loss orders or trailing stops.
2. Position sizing that accounts for market volatility.
3. Diversification across different asset classes when possible.
Section 14: Overbought and Oversold Identification
Standard Bollinger Bands highlight regions where price might be overextended relative to its recent average. The extended ATR-based reversal bands serve as secondary lines of defense, identifying moments when price truly stretches beyond typical volatility bounds.
Section 15: Parameter Customization for Different Needs
Users can tailor the script to their unique preferences:
1. Shorter lookback settings yield faster signals but risk more noise.
2. Higher multipliers spread the bands further apart, filtering out small moves but generating fewer signals.
3. Longer lookback periods smooth out market noise, often leading to more stable but less frequent trading cues.
Section 16: Examples of Different Trading Styles
1. Day Traders: Often reduce the length to capture quick price swings.
2. Swing Traders: May use moderate lengths such as 20 to 50 bars.
3. Position Traders: Might opt for significantly longer settings to detect macro-level reversals.
Section 17: Performance Limitations and Reality Check
No technical indicator is free from false signals. Sudden fundamental news events, extreme sentiment changes, or low-liquidity conditions can render signals less reliable. Backtesting and forward-testing remain essential steps to gauge whether the indicator aligns well with a trader’s timeframe, risk tolerance, and instrument of choice.
Section 18: Merging Volatility and Momentum
A critical uniqueness of this indicator lies in how it merges Bollinger Bands (standard deviation-based) with ATR (pure volatility measure). Bollinger Bands provide a relative measure of price extremes, while ATR dynamically reacts to market expansions and contractions. Together, they offer an enhanced perspective on potential market turns, ideally reducing random noise and highlighting moments where price has traveled beyond typical bounds.
Section 19: Purpose of this Merger
The fundamental purpose behind blending standard deviation measures with real-time volatility data is to accommodate different market behaviors. Static standard deviation alone can underreact or overreact in abnormally volatile conditions. ATR alone lacks a baseline reference to normality. By merging them, the indicator aims to provide:
1. A versatile dynamic range for both typical and extreme moves.
2. A filter against frequent whipsaws, especially in choppy environments.
3. A visual framework that novices and experts can interpret rapidly.
Section 20: Summary and Practical Tips
Uptrick: Volatility Reversion Bands offers a powerful tool for traders looking to combine volatility-based signals with momentum-derived reversals. It emphasizes clarity through color-coded bars, defined reversal zones, and optional weak signal markers. While potentially useful across all major timeframes, it demands ongoing risk management, realistic expectations, and careful study of how signals behave under different market conditions. No indicator serves as a crystal ball, so integrating this script into an overall strategy—possibly alongside volume data, fundamentals, or momentum oscillators—often yields the best results.
Disclaimer and Educational Use
This script is intended for educational and informational purposes. It does not constitute financial advice, nor does it guarantee trading success. Sudden economic events, low-liquidity times, and unexpected market behaviors can all undermine technical signals. Traders should use proper testing procedures (backtesting and forward-testing) and maintain disciplined risk management measures.

CandelaCharts - Inversion Fair Value Gap (IFVG) 📝 Overview
An ICT Inversion Fair Value Gap, often called an Inverse FVG, occurs when a Fair Value Gap (FVG) fails to maintain price support or resistance, resulting in a price breach beyond the FVG. This phenomenon highlights an initial shift in price momentum, signaling potential reversals or retracements.
A Bullish IFVG forms when the price breaks above a bearish fair value gap, signaling a potential shift to bullish momentum.
A Bearish IFVG forms when the price breaks below a bullish fair value gap, signaling a potential shift to bearish momentum.
The IFVG Indicator is a powerful tool designed to automatically detect Inversion Fair Value Gaps (IFVGs) on your charts. It highlights key zones where price breaches fair value gaps, signaling potential momentum shifts or trend reversals. Whether you're tracking bullish or bearish IFVGs, this indicator provides clear visual cues, helping you make informed trading decisions with precision and confidence. Perfect for traders seeking to anticipate market structure changes effortlessly.
📦 Features
MTF
Mitigation
Consequent Encroachment
Threshold
Hide Overlap
Advanced Styling
⚙️ Settings
Show: Controls whether FVGs are displayed on the chart.
Show Last: Sets the number of FVGs you want to display.
Length: Determines the length of each IFVG.
Mitigation: Highlights when an IFVG has been touched, using a different color without marking it as invalid.
Timeframe: Specifies the timeframe used to detect IFVGs.
Threshold: Sets the minimum gap size required for IFVG detection on the chart.
Show Mid-Line: Configures the midpoint line's width and style within the IFVG. (Consequent Encroachment - CE)
Show Border: Defines the border width and line style of the IFVG.
Hide Overlap: Removes overlapping IFVGs from view.
Extend: Extends the IFVG length to the current candle.
Elongate: Fully extends the IFVG length to the right side of the chart.
⚡️ Showcase
Simple
Mitigated
Bordered
Consequent Encroachment
Extended
🚨 Alerts
This script provides alert options for all signals.
Bearish Signal
A bearish signal is invalidated if the price re-enters a bearish inversion zone but fails to reverse downward.
Bullish Signal
A bullish signal is invalidated if the price re-enters a bullish inversion zone but fails to reverse upward.
⚠️ Disclaimer
Trading involves significant risk, and many participants may incur losses. The content on this site is not intended as financial advice and should not be interpreted as such. Decisions to buy, sell, hold, or trade securities, commodities, or other financial instruments carry inherent risks and are best made with guidance from qualified financial professionals. Past performance is not indicative of future results.

NWOG with FVGThe New Week Opening Gap (NWOG) and Fair Value Gap (FVG) combined indicator is a trading tool designed to analyze price action and detect potential support, resistance, and trade entry opportunities based on two significant concepts:
New Week Opening Gap (NWOG): The price range between the high and low of the first candle of the new trading week.
Fair Value Gap (FVG): A price imbalance or gap between candlesticks, where price may retrace to fill the gap, indicating potential support or resistance zones.
When combined, these two concepts help traders identify key price levels (from the new week open) and price imbalances (from FVGs), which can act as powerful indicators for potential market reversals, retracements, or continuation trades.
1. New Week Opening Gap (NWOG):
Definition:
The New Week Opening Gap (NWOG) refers to the range between the high and low of the first candle in a new trading week (often, the Monday open in most markets).
Purpose:
NWOG serves as a significant reference point for market behavior throughout the week. Price action relative to this range helps traders identify:
Support and Resistance zones.
Bullish or Bearish sentiment depending on price’s relation to the opening gap levels.
Areas where the market may retrace or reverse before continuing in the primary trend.
How NWOG is Identified:
The high and low of the first candle of the new week are drawn on the chart, and these levels are used to assess the market's behavior relative to this range.
Trading Strategy Using NWOG:
Above the NWOG Range: If price is trading above the NWOG levels, it signals bullish sentiment.
Below the NWOG Range: If price is trading below the NWOG levels, it signals bearish sentiment.
Price Touching the NWOG Levels: If price approaches or breaks through the NWOG levels, it can indicate a potential retracement or reversal.
2. Fair Value Gap (FVG):
Definition:
A Fair Value Gap (FVG) occurs when there is a gap or imbalance between two consecutive candlesticks, where the high of one candle is lower than the low of the next candle (or vice versa), creating a zone that may act as a price imbalance.
Purpose:
FVGs represent an imbalance in price action, often indicating that the market moved too quickly and left behind a price region that was not fully traded.
FVGs can serve as areas where price is likely to retrace to fill the gap, as traders seek to correct the imbalance.
How FVG is Identified:
An FVG is detected if:
Bearish FVG: The high of one candle is less than the low of the next (gap up).
Bullish FVG: The low of one candle is greater than the high of the next (gap down).
The area between the gap is drawn as a shaded region, indicating the FVG zone.
Trading Strategy Using FVG:
Price Filling the FVG: Price is likely to retrace to fill the gap. A reversal candle in the FVG zone can indicate a trade setup.
Support and Resistance: FVG zones can act as support (in a bullish FVG) or resistance (in a bearish FVG) if the price retraces to them.
Combined Strategy: New Week Opening Gap (NWOG) and Fair Value Gap (FVG):
The combined use of NWOG and FVG helps traders pinpoint high-probability price action setups where:
The New Week Opening Gap (NWOG) acts as a major reference level for potential support or resistance.
Fair Value Gaps (FVG) represent market imbalances where price might retrace to, filling the gap before continuing its move.
Signal Logic:
Buy Signal:
Price touches or breaks above the NWOG range (indicating a bullish trend) and there is a bullish FVG present (gap indicating a support area).
Price retraces to fill the bullish FVG, offering a potential buy opportunity.
Sell Signal:
Price touches or breaks below the NWOG range (indicating a bearish trend) and there is a bearish FVG present (gap indicating a resistance area).
Price retraces to fill the bearish FVG, offering a potential sell opportunity.
Example:
Buy Setup:
Price breaks above the NWOG resistance level, and a bullish FVG (gap down) appears below. Traders can wait for price to pull back to fill the gap and then take a long position when confirmation occurs.
Sell Setup:
Price breaks below the NWOG support level, and a bearish FVG (gap up) appears above. Traders can wait for price to retrace and fill the gap before entering a short position.
Key Benefits of the Combined NWOG & FVG Indicator:
Combines Two Key Concepts:
NWOG provides context for the market's overall direction based on the start of the week.
FVG highlights areas where price imbalances exist and where price might retrace to, making it easier to spot entry points.
High-Probability Setups:
By combining these two strategies, the indicator helps traders spot high-probability trades based on major market levels (from NWOG) and price inefficiencies (from FVG).
Helps Identify Reversal and Continuation Opportunities:
FVGs act as potential support and resistance zones, and when combined with the context of the NWOG levels, it gives traders clearer guidance on where price might reverse or continue its trend.
Clear Visual Signals:
The indicator can plot the NWOG levels on the chart, and shade the FVG areas, providing a clean and easy-to-read chart with entry signals marked for buy and sell opportunities.
Conclusion:
The New Week Opening Gap (NWOG) and Fair Value Gap (FVG) combined indicator is a powerful tool for traders who use price action strategies. By incorporating the New Week's opening range and identifying gaps in price action, this indicator helps traders identify potential support and resistance zones, pinpoint entry opportunities, and increase the probability of successful trades.
This combined strategy enhances your analysis by adding layers of confirmation for trades based on significant market levels and price imbalances. Let me know if you'd like more details or modifications!

C|M Capital (Market Structure Pro)CM Capital (Market Structure Pro)
Overview:
The CM Capital (Market Structure Pro) Indicator is a groundbreaking tool for traders seeking a comprehensive market analysis. This closed-source script merges multiple facets of market dynamics into a single, user-friendly interface, designed to enhance decision-making by providing a multi-dimensional view of market behavior. By combining advanced market structure detection, liquidity event identification, Fair Value Gap analysis, and session-specific insights, this indicator offers traders a strategic advantage in navigating the complexities of financial markets.
Key Functionalities:
Market Structure Insights:
Break of Structure (BOS) and Market Structure Shifts (MSS):
Methodology: Our approach uses fractal analysis coupled with custom algorithms to dissect price movements, identifying pivotal moments where market structure breaks or shifts. The script evaluates candle patterns, volume data, and price momentum to flag these events.
Customization: Users can choose between candle close or wick confirmations and select from various line styles for visualization, tailoring the sensitivity to match their trading strategy, whether it's scalping or swing trading.
Utility: These markers act as early signals for trend changes, allowing traders to prepare for potential reversals or continuations, especially useful in volatile markets where timely decisions are crucial.
Structure Strength:
Highs and Lows Definition: The 'Structure Strength' setting in this indicator directly influences the identification of structure highs and lows. It's not just about detecting market structure; it's about defining what constitutes a significant high or low based on your trading horizon.
Swing vs. Internal Structure:
Lower Strength: Opting for a lower strength setting will highlight more extreme, swing-type structures. This means the indicator will mark out only the most pronounced highs and lows, which are ideal for traders focusing on broader market swings or longer-term trends.
Higher Strength: Conversely, increasing the strength level plots more internal structure levels. This setting is perfect for traders who want to dive into the market's micro-movements, offering insights into potential support and resistance within ongoing trends, essentially capturing more reactive and detailed price action.
Strategic Application: This adjustable parameter allows traders to zoom in or out on the market structure, aligning with their trading style or the specific market conditions they're navigating. Whether you're looking to catch significant market turns or to finesse entries and exits within a trend, the structure strength setting provides the granularity needed for nuanced market analysis.
Liquidity Sweeps:
Detection: Beyond traditional price action analysis, our indicator incorporates a unique method to spot liquidity sweeps. By analyzing price movements against historical support/resistance zones, it highlights instances where significant orders might have been absorbed, suggesting areas of potential price reversal or continuation.
Visualization: Liquidity sweeps are visually marked with customizable colors and an 'X' label, making them instantly recognizable. This feature is particularly beneficial for traders looking to enter or exit trades based on market inefficiencies or anticipated institutional activity.
Application: Traders can use these signals to anticipate where the market might react strongly, either as support for entries or as a caution for exits, enhancing trade precision.
Fair Value Gaps (FVGs):
Identification: Our proprietary FVG detection algorithm looks for price discrepancies over recent bars, signaling where the market could aim to rebalance. This is not merely about spotting gaps but understanding their context within the market's flow.
Enhanced Visualization: Users can extend FVGs across the chart, providing a clearer view of potential mean reversion points or continuation levels, aiding in setting targets or stop-losses.
Strategic Use: FVGs serve as dynamic levels where traders might expect price action to revisit, offering opportunities for mean reversion trades or confirming trend strength.
Session Visualization:
Session Markers: By delineating Asia, London, and New York session times, the indicator helps traders recognize session-specific volatility, trends, and liquidity conditions. Each session can be customized for color and duration, aligning with various trading strategies.
Timeframe Correlation: Integrating session analysis with structural and liquidity insights allows for a strategy where trades are timed not just by price action but by when in the global market cycle they occur, potentially increasing the effectiveness of entry and exit points.
Watermark Display:
Personalization: Add a personal touch or brand identity to your charts with customizable text and color options for the watermark, enhancing both the aesthetic and functional aspects of your trading setup.
Originality:
This script's originality lies in its holistic approach to market analysis. The integration of these diverse yet synergistic components provides a unique toolset:
Confluence of Signals: Each element enhances the others, creating a confluence where structural changes, liquidity events, and time-based market conditions are analyzed in concert, offering a more complete trading signal than isolated indicators.
Customization for Diverse Trading Styles: From high-frequency scalping to long-term trend following, the script's flexibility caters to a broad spectrum of trading strategies by allowing adjustments in sensitivity, visualization, and application.
How to Use:
Setup: Add the script to your chart and explore the settings in the input panel. Customize the visual and functional aspects to align with your trading style.
Strategy Application:
Use BOS/MSS for trend confirmation, liquidity sweeps for entry/exit precision, FVGs for mean reversion opportunities, and session markers to time your trades optimally.
Consider combining signals for stronger trade validation; for instance, a BOS during the London session might be more significant if it coincides with a liquidity sweep and an FVG from the Asian session.

Multi-Timeframe Stochastic Alert [tradeviZion]# Multi-Timeframe Stochastic Alert : Complete User Guide
## 1. Introduction
### What is the Multi-Timeframe Stochastic Alert?
The Multi-Timeframe Stochastic Alert is an advanced technical analysis tool that helps traders identify potential trading opportunities by analyzing momentum across multiple timeframes. It combines the power of the stochastic oscillator with multi-timeframe analysis to provide more reliable trading signals.
### Key Features and Benefits
- Simultaneous analysis of 6 different timeframes
- Advanced alert system with customizable conditions
- Real-time visual feedback with color-coded signals
- Comprehensive data table with instant market insights
- Motivational trading messages for psychological support
- Flexible theme support for comfortable viewing
### How it Can Help Your Trading
- Identify stronger trends by confirming momentum across multiple timeframes
- Reduce false signals through multi-timeframe confirmation
- Stay informed of market changes with customizable alerts
- Make more informed decisions with comprehensive market data
- Maintain trading discipline with clear visual signals
## 2. Understanding the Display
### The Stochastic Chart
The main chart displays three key components:
1. ** K-Line (Fast) **: The primary stochastic line (default color: green)
2. ** D-Line (Slow) **: The signal line (default color: red)
3. ** Reference Lines **:
- Overbought Level (80): Upper dashed line
- Middle Line (50): Center dashed line
- Oversold Level (20): Lower dashed line
### The Information Table
The table provides a comprehensive view of stochastic readings across all timeframes. Here's what each column means:
#### Column Explanations:
1. ** Timeframe **
- Shows the time period for each row
- Example: "5" = 5 minutes, "15" = 15 minutes, etc.
2. ** K Value **
- The fast stochastic line value (0-100)
- Higher values indicate stronger upward momentum
- Lower values indicate stronger downward momentum
3. ** D Value **
- The slow stochastic line value (0-100)
- Helps confirm momentum direction
- Crossovers with K-line can signal potential trades
4. ** Status **
- Shows current momentum with symbols:
- ▲ = Increasing (bullish)
- ▼ = Decreasing (bearish)
- Color matches the trend direction
5. ** Trend **
- Shows the current market condition:
- "Overbought" (above 80)
- "Bullish" (above 50)
- "Bearish" (below 50)
- "Oversold" (below 20)
#### Row Explanations:
1. ** Title Row **
- Shows "🎯 Multi-Timeframe Stochastic"
- Indicates the indicator is active
2. ** Header Row **
- Contains column titles
- Dark blue background for easy reading
3. ** Timeframe Rows **
- Six rows showing different timeframe analyses
- Each row updates independently
- Color-coded for easy trend identification
4. **Message Row**
- Shows rotating motivational messages
- Updates every 5 bars
- Helps maintain trading discipline
### Visual Indicators and Colors
- ** Green Background **: Indicates bullish conditions
- ** Red Background **: Indicates bearish conditions
- ** Color Intensity **: Shows strength of the signal
- ** Background Highlights **: Appear when alert conditions are met
## 3. Core Settings Groups
### Stochastic Settings
These settings control the core calculation of the stochastic oscillator.
1. ** Length (Default: 14) **
- What it does: Determines the lookback period for calculations
- Higher values (e.g., 21): More stable, fewer signals
- Lower values (e.g., 8): More sensitive, more signals
- Recommended:
* Day Trading: 8-14
* Swing Trading: 14-21
* Position Trading: 21-30
2. ** Smooth K (Default: 3) **
- What it does: Smooths the main stochastic line
- Higher values: Smoother line, fewer false signals
- Lower values: More responsive, but more noise
- Recommended:
* Day Trading: 2-3
* Swing Trading: 3-5
* Position Trading: 5-7
3. ** Smooth D (Default: 3) **
- What it does: Smooths the signal line
- Works in conjunction with Smooth K
- Usually kept equal to or slightly higher than Smooth K
- Recommended: Keep same as Smooth K for consistency
4. ** Source (Default: Close) **
- What it does: Determines price data for calculations
- Options: Close, Open, High, Low, HL2, HLC3, OHLC4
- Recommended: Stick with Close for most reliable signals
### Timeframe Settings
Controls the multiple timeframes analyzed by the indicator.
1. ** Main Timeframes (TF1-TF6) **
- TF1 (Default: 10): Shortest timeframe for quick signals
- TF2 (Default: 15): Short-term trend confirmation
- TF3 (Default: 30): Medium-term trend analysis
- TF4 (Default: 30): Additional medium-term confirmation
- TF5 (Default: 60): Longer-term trend analysis
- TF6 (Default: 240): Major trend confirmation
Recommended Combinations:
* Scalping: 1, 3, 5, 15, 30, 60
* Day Trading: 5, 15, 30, 60, 240, D
* Swing Trading: 15, 60, 240, D, W, M
2. ** Wait for Bar Close (Default: true) **
- What it does: Controls when calculations update
- True: More reliable but slightly delayed signals
- False: Faster signals but may change before bar closes
- Recommended: Keep True for more reliable signals
### Alert Settings
#### Main Alert Settings
1. ** Enable Alerts (Default: true) **
- Master switch for all alert notifications
- Toggle this off when you don't want any alerts
- Useful during testing or when you want to focus on visual signals only
2. ** Alert Condition (Options) **
- "Above Middle": Bullish momentum alerts only
- "Below Middle": Bearish momentum alerts only
- "Both": Alerts for both directions
- Recommended:
* Trending Markets: Choose direction matching the trend
* Ranging Markets: Use "Both" to catch reversals
* New Traders: Start with "Both" until you develop a specific strategy
3. ** Alert Frequency **
- "Once Per Bar": Immediate alerts during the bar
- "Once Per Bar Close": Alerts only after bar closes
- Recommended:
* Day Trading: "Once Per Bar" for quick reactions
* Swing Trading: "Once Per Bar Close" for confirmed signals
* Beginners: "Once Per Bar Close" to reduce false signals
#### Timeframe Check Settings
1. ** First Check (TF1) **
- Purpose: Confirms basic trend direction
- Alert Triggers When:
* For Bullish: Stochastic is above middle line (50)
* For Bearish: Stochastic is below middle line (50)
* For Both: Triggers in either direction based on position relative to middle line
- Settings:
* Enable/Disable: Turn first check on/off
* Timeframe: Default 5 minutes
- Best Used For:
* Quick trend confirmation
* Entry timing
* Scalping setups
2. ** Second Check (TF2) **
- Purpose: Confirms both position and momentum
- Alert Triggers When:
* For Bullish: Stochastic is above middle line AND both K&D lines are increasing
* For Bearish: Stochastic is below middle line AND both K&D lines are decreasing
* For Both: Triggers based on position and direction matching current condition
- Settings:
* Enable/Disable: Turn second check on/off
* Timeframe: Default 15 minutes
- Best Used For:
* Trend strength confirmation
* Avoiding false breakouts
* Day trading setups
3. ** Third Check (TF3) **
- Purpose: Confirms overall momentum direction
- Alert Triggers When:
* For Bullish: Both K&D lines are increasing (momentum confirmation)
* For Bearish: Both K&D lines are decreasing (momentum confirmation)
* For Both: Triggers based on matching momentum direction
- Settings:
* Enable/Disable: Turn third check on/off
* Timeframe: Default 30 minutes
- Best Used For:
* Major trend confirmation
* Swing trading setups
* Avoiding trades against the main trend
Note: All three conditions must be met simultaneously for the alert to trigger. This multi-timeframe confirmation helps reduce false signals and provides stronger trade setups.
#### Alert Combinations Examples
1. ** Conservative Setup **
- Enable all three checks
- Use "Once Per Bar Close"
- Timeframe Selection Example:
* First Check: 15 minutes
* Second Check: 1 hour (60 minutes)
* Third Check: 4 hours (240 minutes)
- Wider gaps between timeframes reduce noise and false signals
- Best for: Swing trading, beginners
2. ** Aggressive Setup **
- Enable first two checks only
- Use "Once Per Bar"
- Timeframe Selection Example:
* First Check: 5 minutes
* Second Check: 15 minutes
- Closer timeframes for quicker signals
- Best for: Day trading, experienced traders
3. ** Balanced Setup **
- Enable all checks
- Use "Once Per Bar"
- Timeframe Selection Example:
* First Check: 5 minutes
* Second Check: 15 minutes
* Third Check: 1 hour (60 minutes)
- Balanced spacing between timeframes
- Best for: All-around trading
### Visual Settings
#### Alert Visual Settings
1. ** Show Background Color (Default: true) **
- What it does: Highlights chart background when alerts trigger
- Benefits:
* Makes signals more visible
* Helps spot opportunities quickly
* Provides visual confirmation of alerts
- When to disable:
* If using multiple indicators
* When preferring a cleaner chart
* During manual backtesting
2. ** Background Transparency (Default: 90) **
- Range: 0 (solid) to 100 (invisible)
- Recommended Settings:
* Clean Charts: 90-95
* Multiple Indicators: 85-90
* Single Indicator: 80-85
- Tip: Adjust based on your chart's overall visibility
3. ** Background Colors **
- Bullish Background:
* Default: Green
* Indicates upward momentum
* Customizable to match your theme
- Bearish Background:
* Default: Red
* Indicates downward momentum
* Customizable to match your theme
#### Level Settings
1. ** Oversold Level (Default: 20) **
- Traditional Setting: 20
- Adjustable Range: 0-100
- Usage:
* Lower values (e.g., 10): More conservative
* Higher values (e.g., 30): More aggressive
- Trading Applications:
* Potential bullish reversal zone
* Support level in uptrends
* Entry point for long positions
2. ** Overbought Level (Default: 80) **
- Traditional Setting: 80
- Adjustable Range: 0-100
- Usage:
* Lower values (e.g., 70): More aggressive
* Higher values (e.g., 90): More conservative
- Trading Applications:
* Potential bearish reversal zone
* Resistance level in downtrends
* Exit point for long positions
3. ** Middle Line (Default: 50) **
- Purpose: Trend direction separator
- Applications:
* Above 50: Bullish territory
* Below 50: Bearish territory
* Crossing 50: Potential trend change
- Trading Uses:
* Trend confirmation
* Entry/exit trigger
* Risk management level
#### Color Settings
1. ** Bullish Color (Default: Green) **
- Used for:
* K-Line (Main stochastic line)
* Status symbols when trending up
* Trend labels for bullish conditions
- Customization:
* Choose colors that stand out
* Match your trading platform theme
* Consider color blindness accessibility
2. ** Bearish Color (Default: Red) **
- Used for:
* D-Line (Signal line)
* Status symbols when trending down
* Trend labels for bearish conditions
- Customization:
* Choose contrasting colors
* Ensure visibility on your chart
* Consider monitor settings
3. ** Neutral Color (Default: Gray) **
- Used for:
* Middle line (50 level)
- Customization:
* Should be less prominent
* Easy on the eyes
* Good background contrast
### Theme Settings
1. **Color Theme Options**
- Dark Theme (Default):
* Dark background with white text
* Optimized for dark chart backgrounds
* Reduces eye strain in low light
- Light Theme:
* Light background with black text
* Better visibility in bright conditions
- Custom Theme:
* Use your own color preferences
2. ** Available Theme Colors **
- Table Background
- Table Text
- Table Headers
Note: The theme affects only the table display colors. The stochastic lines and alert backgrounds use their own color settings.
### Table Settings
#### Position and Size
1. ** Table Position **
- Options:
* Top Right (Default)
* Middle Right
* Bottom Right
* Top Left
* Middle Left
* Bottom Left
- Considerations:
* Chart space utilization
* Personal preference
* Multiple monitor setups
2. ** Text Sizes **
- Title Size Options:
* Tiny: Minimal space usage
* Small: Compact but readable
* Normal (Default): Standard visibility
* Large: Enhanced readability
* Huge: Maximum visibility
- Data Size Options:
* Recommended: One size smaller than title
* Adjust based on screen resolution
* Consider viewing distance
3. ** Empowering Messages **
- Purpose:
* Maintain trading discipline
* Provide psychological support
* Remind of best practices
- Rotation:
* Changes every 5 bars
* Categories include:
- Market Wisdom
- Strategy & Discipline
- Mindset & Growth
- Technical Mastery
- Market Philosophy
## 4. Setting Up for Different Trading Styles
### Day Trading Setup
1. **Timeframes**
- Primary: 5, 15, 30 minutes
- Secondary: 1H, 4H
- Alert Settings: "Once Per Bar"
2. ** Stochastic Settings **
- Length: 8-14
- Smooth K/D: 2-3
- Alert Condition: Match market trend
3. ** Visual Settings **
- Background: Enabled
- Transparency: 85-90
- Theme: Based on trading hours
### Swing Trading Setup
1. ** Timeframes **
- Primary: 1H, 4H, Daily
- Secondary: Weekly
- Alert Settings: "Once Per Bar Close"
2. ** Stochastic Settings **
- Length: 14-21
- Smooth K/D: 3-5
- Alert Condition: "Both"
3. ** Visual Settings **
- Background: Optional
- Transparency: 90-95
- Theme: Personal preference
### Position Trading Setup
1. ** Timeframes **
- Primary: Daily, Weekly
- Secondary: Monthly
- Alert Settings: "Once Per Bar Close"
2. ** Stochastic Settings **
- Length: 21-30
- Smooth K/D: 5-7
- Alert Condition: "Both"
3. ** Visual Settings **
- Background: Disabled
- Focus on table data
- Theme: High contrast
## 5. Troubleshooting Guide
### Common Issues and Solutions
1. ** Too Many Alerts **
- Cause: Settings too sensitive
- Solutions:
* Increase timeframe intervals
* Use "Once Per Bar Close"
* Enable fewer timeframe checks
* Adjust stochastic length higher
2. ** Missed Signals **
- Cause: Settings too conservative
- Solutions:
* Decrease timeframe intervals
* Use "Once Per Bar"
* Enable more timeframe checks
* Adjust stochastic length lower
3. ** False Signals **
- Cause: Insufficient confirmation
- Solutions:
* Enable all three timeframe checks
* Use larger timeframe gaps
* Wait for bar close
* Confirm with price action
4. ** Visual Clarity Issues **
- Cause: Poor contrast or overlap
- Solutions:
* Adjust transparency
* Change theme settings
* Reposition table
* Modify color scheme
### Best Practices
1. ** Getting Started **
- Start with default settings
- Use "Both" alert condition
- Enable all timeframe checks
- Wait for bar close
- Monitor for a few days
2. ** Fine-Tuning **
- Adjust one setting at a time
- Document changes and results
- Test in different market conditions
- Find your optimal timeframe combination
- Balance sensitivity with reliability
3. ** Risk Management **
- Don't trade against major trends
- Confirm signals with price action
- Use appropriate position sizing
- Set clear stop losses
- Follow your trading plan
4. ** Regular Maintenance **
- Review settings weekly
- Adjust for market conditions
- Update color scheme for visibility
- Clean up chart regularly
- Maintain trading journal
## 6. Tips for Success
1. ** Entry Strategies **
- Wait for all timeframes to align
- Confirm with price action
- Use proper position sizing
- Consider market conditions
2. ** Exit Strategies **
- Trail stops using indicator levels
- Take partial profits at targets
- Honor your stop losses
- Don't fight the trend
3. ** Psychology **
- Stay disciplined with settings
- Don't override system signals
- Keep emotions in check
- Learn from each trade
4. ** Continuous Improvement **
- Record your trades
- Review performance regularly
- Adjust settings gradually
- Stay educated on markets

Gap Marker (>5%)This TradingView script identifies and highlights price gaps of more than 5% between consecutive candles. It is a valuable tool for traders to quickly spot significant price movements and take action accordingly.
Features:
Gap-Up Detection: Marks green triangles when a candle’s opening price is more than 5% higher than the previous candle’s closing price.
Gap-Down Detection: Marks red triangles when a candle’s opening price is more than 5% lower than the previous candle’s closing price.
Percentage Display: Shows the percentage change next to the marker for added clarity.
This script is especially useful for identifying potential trading opportunities triggered by substantial market moves.
Dieses TradingView-Skript identifiziert und markiert Kurslücken (Gaps) von mehr als 5 % zwischen aufeinanderfolgenden Kerzen. Es ist ein hilfreiches Tool für Trader, um bedeutende Kursbewegungen sofort zu erkennen und darauf zu reagieren.
Funktionen:
Gap-Up-Erkennung: Markiert grüne Dreiecke, wenn der Eröffnungskurs einer Kerze mehr als 5 % über dem Schlusskurs der vorherigen Kerze liegt.
Gap-Down-Erkennung: Markiert rote Dreiecke, wenn der Eröffnungskurs einer Kerze mehr als 5 % unter dem Schlusskurs der vorherigen Kerze liegt.
Prozentanzeige: Zeigt die prozentuale Veränderung direkt neben der Markierung an.
Das Skript ist besonders nützlich, um potenzielle Handelsmöglichkeiten zu identifizieren, die durch signifikante Marktbewegungen ausgelöst werden.

ICT FVG [TheFundedRoad]This indicator shows you all ICT Fair value gaps on chart with midpoint line
Fair value gap is a gap in a set of 3 candles, in a bullish FVG you have 1st candle high being lower than third candle low, and in a bearish FVG you have first candle low higher than third candle high, thats how this indicator finds these fair value gaps
It draws the fair value gap from the 2nd candle forward
You can customize the color and if you want to see the midpoint or not, midpoint is 50% of the gap
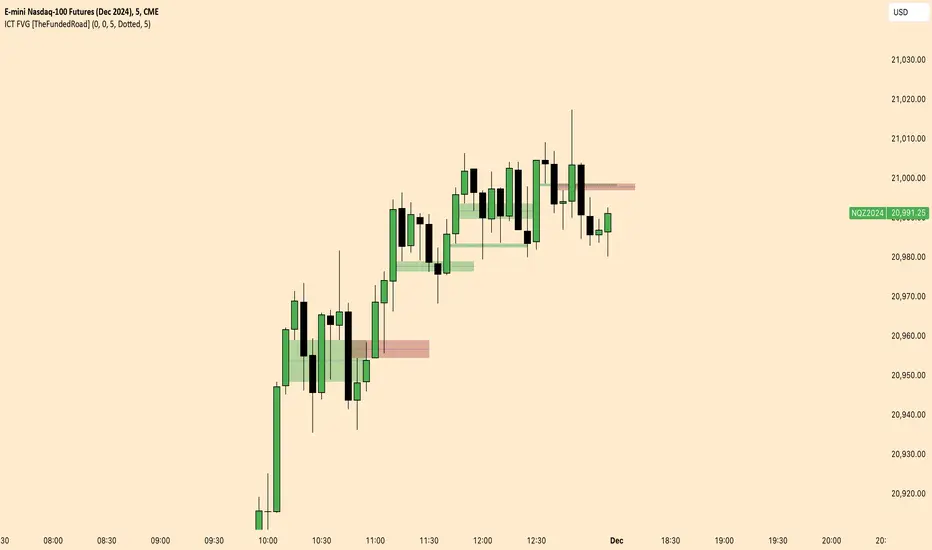
Pivotal Point Detection
The indicator highlights price gaps (overnight gaps) with significantly increased volume in the daily chart only. These price jumps can occur after earnings reports or other significant news and often point to an important event (e.g., a new product or business model). According to Jesse Livermore, these are called Pivotal Points.
The price jumps displayed by the indicator are not a guarantee that they represent a true Pivotal Point, but they provide a hint of a significant business development - especially when they occur repeatedly alongside revenue growth. This can help identify potentially strong growth stocks and high-performing investments. However, the underlying events and connections must be investigated through additional research.
make posible to find stocks like:
NYSE:PLTR NASDAQ:ROOT NASDAQ:NVDA NYSE:CVNA NYSE:LRN
A "pivotal price line" is drawn at the opening price of the Pivotal Point. This line is considered a support level. If the price falls below this line, the Pivotal Point loses its validity.

Wick Trend Analysis - AYNETScientific Explanation
1. Wick Trend Lines
Upper Wick Trend Line: The upper_wick_trend is calculated as the Simple Moving Average (SMA) of the upper wick lengths over the user-defined period (trend_length).
pinescript
Kodu kopyala
float upper_wick_trend = ta.sma(upper_wick_length, trend_length)
Lower Wick Trend Line: The lower_wick_trend is similarly calculated for the lower wick lengths.
pinescript
Kodu kopyala
float lower_wick_trend = ta.sma(lower_wick_length, trend_length)
2. Filling Between Lines
fill Function: The fill function colors the area between two plotted lines (plot_upper and plot_lower) based on a defined condition.
pinescript
Kodu kopyala
fill(plot_upper, plot_lower, color=fill_color, title="Wick Trend Area")
Condition for Coloring: The color is determined based on whether the upper wick trend is greater or less than the lower wick trend:
Green Fill: Indicates that the upper wick trend is dominant (i.e., upper_wick_trend > lower_wick_trend).
Red Fill: Indicates that the lower wick trend is dominant (i.e., upper_wick_trend <= lower_wick_trend).
Visualization Features
Trend Lines:
Upper wick trend is plotted as a green line.
Lower wick trend is plotted as a red line.
Filled Area:
The area between the two trend lines is filled:
Green when the upper wick trend is dominant.
Red when the lower wick trend is dominant.
Dynamic Adjustments:
The user can adjust the trend_length to change the sensitivity of the SMA calculations.
Applications
Sentiment Analysis:
Green Fill (Upper Trend Dominance): Indicates stronger rejection at higher prices, suggesting bearish sentiment.
Red Fill (Lower Trend Dominance): Indicates stronger rejection at lower prices, suggesting bullish sentiment.
Signal Generation:
Transitions in the fill color (from green to red or vice versa) can serve as potential trade signals.
Volatility Assessment:
Wider gaps between the trend lines indicate higher market volatility, while narrower gaps suggest lower volatility.
Enhancements
1. Trend Strength Filtering
Add thresholds to filter out minor trends or insignificant wick activity:
pinescript
Kodu kopyala
bool significant_upper_wick = upper_wick_length > 10 // Minimum length for upper wick
bool significant_lower_wick = lower_wick_length > 10
2. Alerts for Trend Changes
Trigger alerts when the dominance of the trend changes:
pinescript
Kodu kopyala
alertcondition(upper_wick_trend > lower_wick_trend, title="Upper Wick Dominance", message="Upper wick trend is now dominant.")
alertcondition(lower_wick_trend > upper_wick_trend, title="Lower Wick Dominance", message="Lower wick trend is now dominant.")
3. Combined Wick Analysis
Incorporate total wick activity (upper + lower wicks) for holistic analysis:
pinescript
Kodu kopyala
float total_wick_trend = ta.sma(upper_wick_length + lower_wick_length, trend_length)
Conclusion
This script provides a robust visualization of wick trends with dynamic color filling to indicate trend dominance. By observing the relative strength of upper and lower wick trends, traders can assess market sentiment, detect potential reversals, and gauge volatility. This method can be further enhanced with additional filters, alerts, and composite indicators to refine trading strategies.